. 2024 Jan 23;43(1):113595.
doi: 10.1016/j.celrep.2023.113595. Epub 2023 Dec 19.

Synaptic plasticity via receptor tyrosine kinase/G-protein-coupled receptor crosstalk

Affiliations

Synaptic plasticity via receptor tyrosine kinase/G-protein-coupled receptor crosstalk

Cristina Lao-Peregrin et al. Cell Rep. .

Abstract

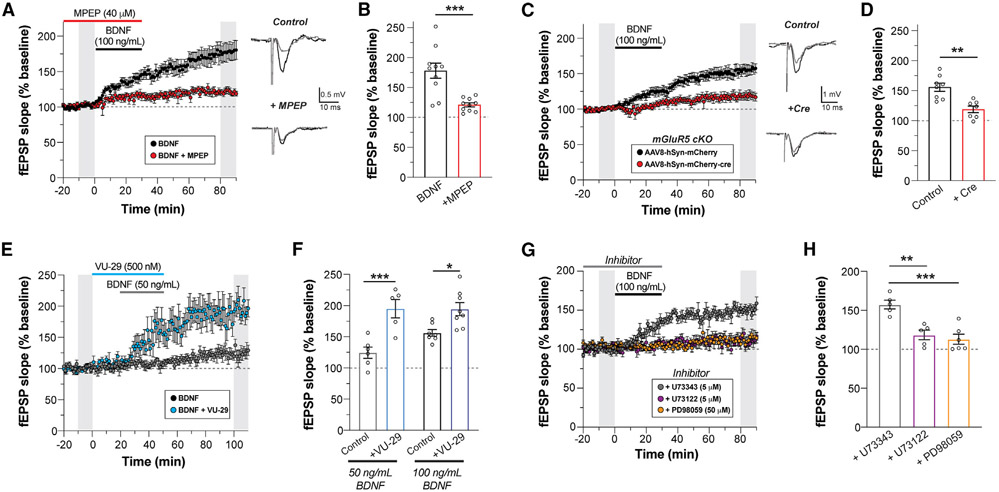
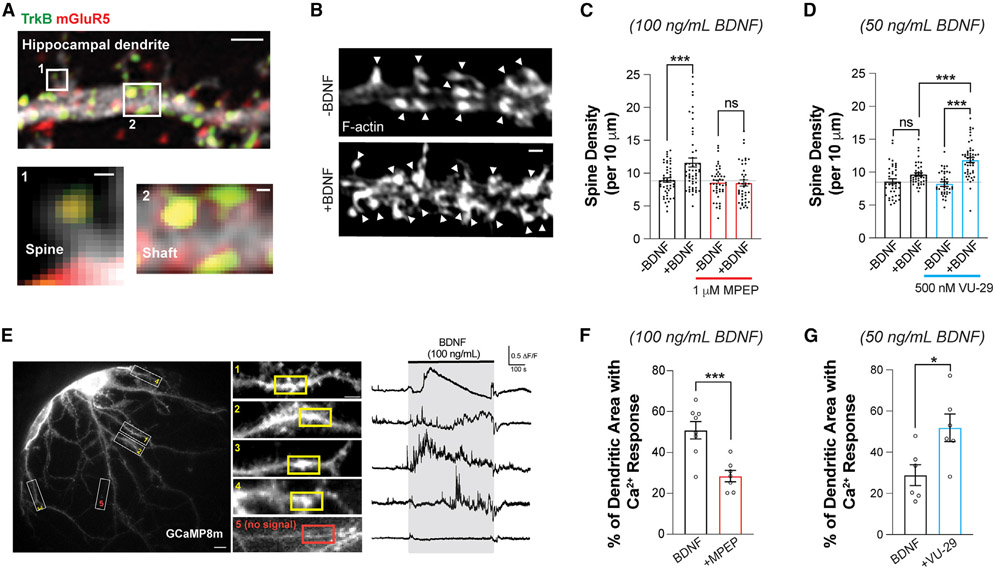
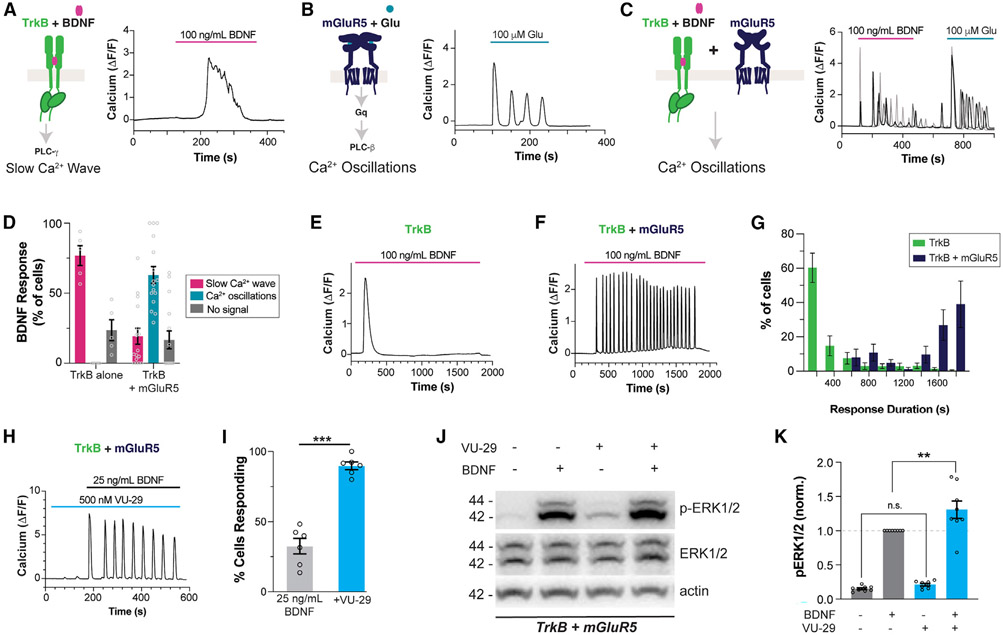
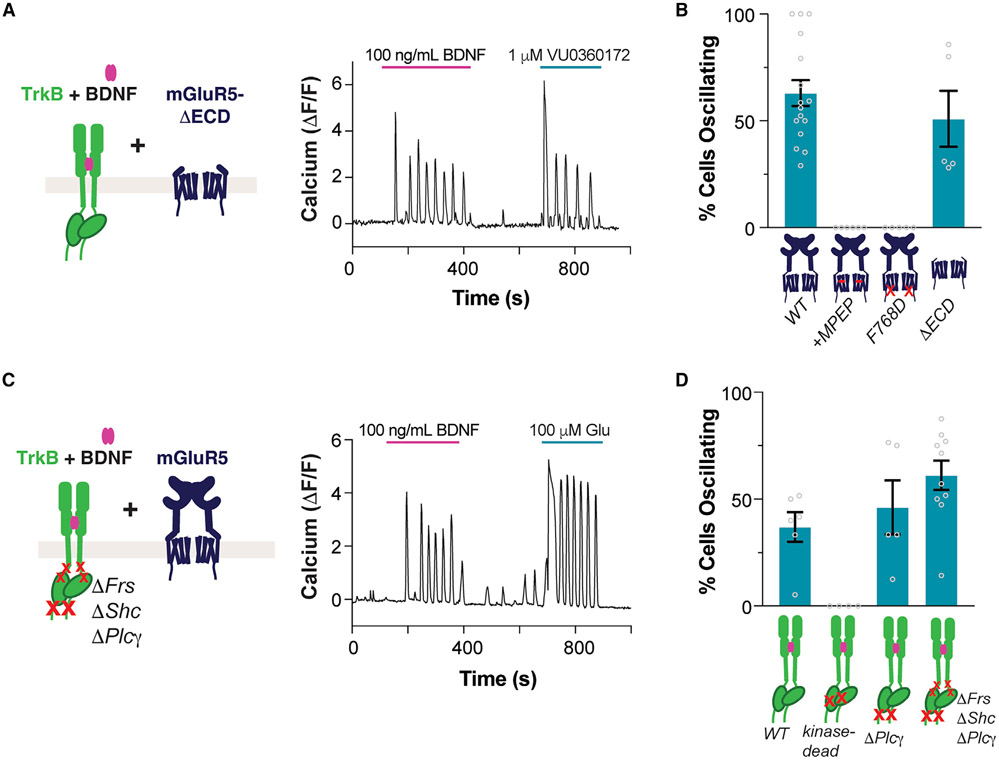
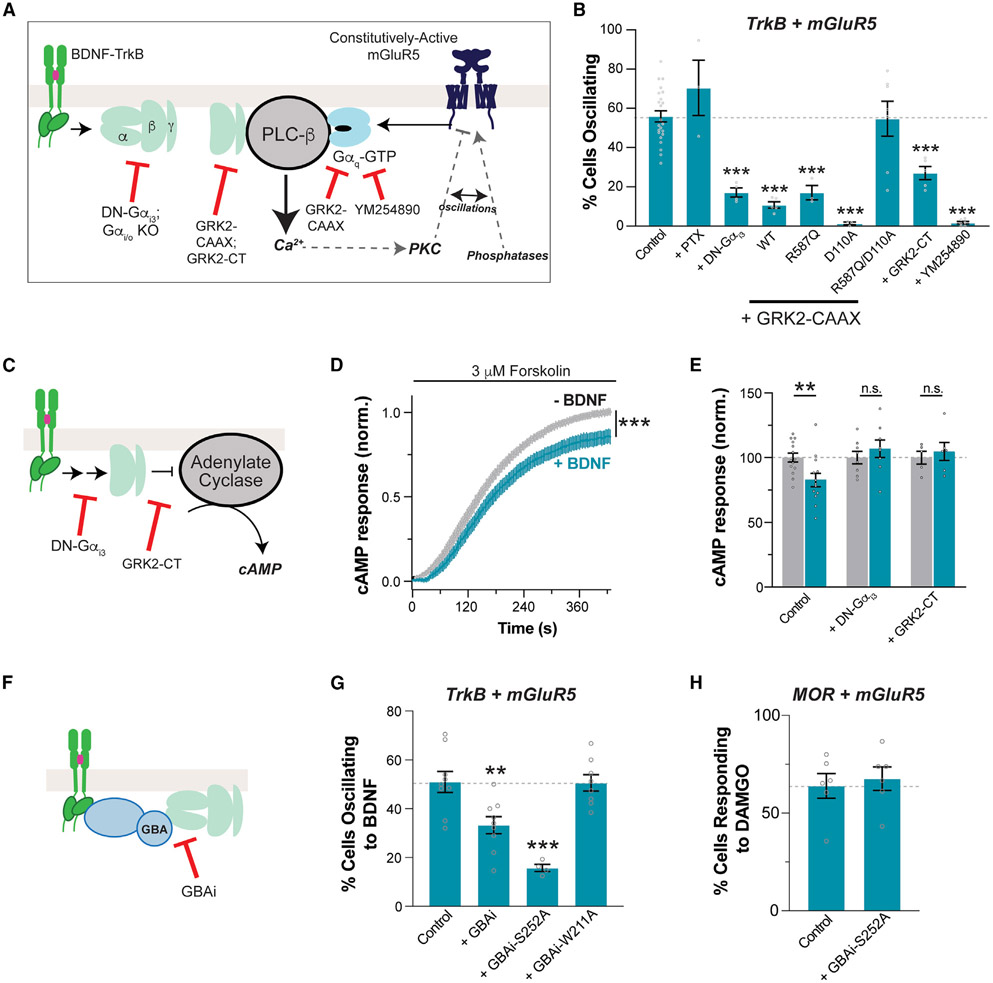
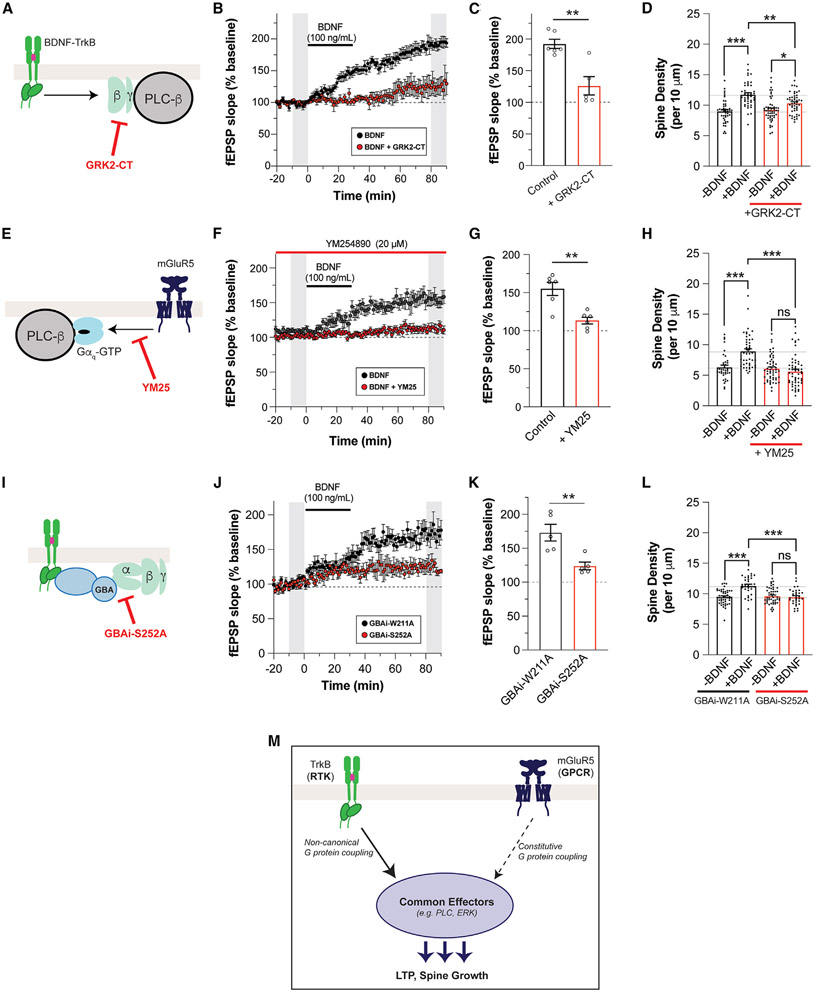
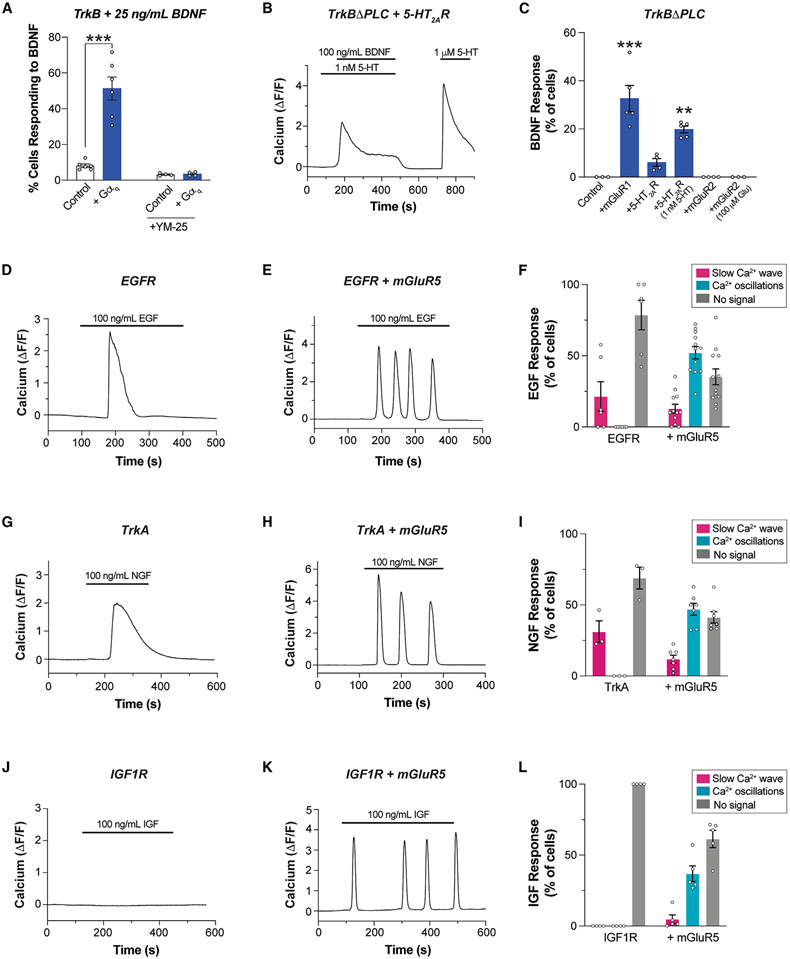
Cellular signaling involves a large repertoire of membrane receptors operating in overlapping spatiotemporal regimes and targeting many common intracellular effectors. However, both the molecular mechanisms and the physiological roles of crosstalk between receptors, especially those from different superfamilies, are poorly understood. We find that the receptor tyrosine kinase (RTK) TrkB and the G-protein-coupled receptor (GPCR) metabotropic glutamate receptor 5 (mGluR5) together mediate hippocampal synaptic plasticity in response to brain-derived neurotrophic factor (BDNF). Activated TrkB enhances constitutive mGluR5 activity to initiate a mode switch that drives BDNF-dependent sustained, oscillatory Ca2+ signaling and enhanced MAP kinase activation. This crosstalk is mediated, in part, by synergy between Gβγ, released by TrkB, and Gαq-GTP, released by mGluR5, to enable physiologically relevant RTK/GPCR crosstalk.

Keywords: BDNF; CP: Cell biology; CP: Neuroscience; G-protein-coupled receptor; GBA motif; TrkB; calcium signaling; metabotropic glutamate receptor; neuromodulation; neurotrophin; receptor tyrosine kinase; synaptic plasticity.


Conflict of interest statement

Declaration of interests The authors declare that they have no competing interests.

Figures

Figure 1.
Figure 1.. BDNF-induced LTP is dependent on mGluR5 and enhanced by an mGluR5 allosteric modulator
(A) fEPSP slope time course showing that blockade of mGluR5 with MPEP prevents BDNF-induced LTP. Gray bars show regions averaged for baseline and post-BDNF values in (B). Right, representative fEPSP traces recorded during basal and after 60 min of BDNF perfusion. (B) Summary bar graph showing a lack of BDNF-induced potentiation in the presence of MPEP. (C and D) Conditional KO of mGluR5 in CA1 pyramidal neurons impairs BDNF-LTP compared with control slices. (E and F) Co-application of the mGluR5 PAM VU-29 enhances LTP induced by low-dose (50 ng/mL) or high-dose (100 ng/mL) BDNF. (G and H) BDNF-induced LTP is blocked by an ERK inhibitor (PD98059, 50 μM) or a PLC inhibitor (U-73122, 5 μM), but not an inactive PLC inhibitor analog (U-73343, 5 μM). For (B), (D), (F), (H): individual points represent independent slices taken from distinct mice. For (B) and (D), unpaired t test is used. For (F) and (H), one-way ANOVA with Sidak’s multiple comparisons is used. All data are shown as the mean ± SEM; *p < 0.05, **p < 0.01, ***p < 0.001. See also Figure S1.
Figure 2.
Figure 2.. BDNF-induced dendritic spine growth and calcium signaling are dependent on mGluR5
(A) Confocal image of fixed hippocampal neuron showing anti-TrkB and anti-mGluR5, including co-localization in dendrites (scale bars, 1 μm dendrite; 0.1 μm spine and shaft). Of the spines, 49.3% ± 6.6% showed co-expression of TrkB and mGluR5; Pearson’s correlation co-efficient between TrkB and mGluR5 in dendritic shaft (top 10% of pixels) = 0.49 ± 0.05 (n = 12 neurons). (B) Representative images showing BDNF-induced (100 ng/mL) spine density increases in DIV 21 hippocampal neurons. Arrowheads indicate spine heads enriched with F-actin. (C and D) Bar graphs summarizing the BDNF-induced increases in spine density. MPEP blocks 100 ng/mL BDNF-induced spine density increase (C), while VU-29 potentiates the increase in spine density induced by low-dose 50 ng/mL BDNF (D). (E) Representative image of GCaMP8m-expressing hippocampal neuron (left, scale bar, 10 μm), with snapshots of dendrites (white rectangles) taken in the presence of 100 ng/mL BDNF (middle, scale bar, 5 μm). Right, representative trace from 10 μm regions of interest (ROIs) with Ca2+ response (yellow rectangles) or without Ca2+ response (red rectangle) from each dendrite. (F) Bar graph showing that 1 μM MPEP co-application significantly decreases the percentage of total dendritic area with BDNF-induced Ca2+ responses. (G) Bar graph showing that co-application of low-dose (50 ng/mL) BDNF with 500 nM VU-29 leads to an increased percentage of total dendritic area with Ca2+ responses. For (C), (D), (F), and (G), individual points represent separate neurons, taken from at least three separate culture preparations. For (C) and (D), one-way ANOVA with Tukey’s multiple comparisons is used. For (F) and (G), unpaired t test is used. All data are shown as the mean ± SEM, *p < 0.05, ***p < 0.001. See also Figure S2.
Figure 3.
Figure 3.. BDNF-mediated TrkB activation produces mGluR5-dependent Ca2+ oscillations in HEK 293 cells
(A–C) Representative traces showing intracellular Ca2+ responses to TrkB activation by BDNF (A), mGluR5 activation by glutamate (B), and TrkB activation by BDNF in mGluR5 co-expressing cells (C). (D) Distribution of BDNF responses in the absence or presence of mGluR5 co-expression. Only cells showing a response to glutamate are analyzed in the TrkB + mGluR5 condition. (E–G) Representative traces showing Ca2+ responses to extended 30 min BDNF application in cells expressing TrkB (E) or TrkB and mGluR5 (F), with summary histogram (G) showing the distribution of response durations. (H and I) Co-application of the mGluR5 PAM VU-29 enhances the response to low-dose BDNF, as seen in a representative cell (H) and a summary bar graph of the percentage of cells responding to BDNF (I). Only cells responding to glutamate were included in the bar graph in (I). (J and K) Representative western blot (J) and quantification (K) of BDNF-induced ERK activation (p-ERK/ERK normalized ratio at 15 min) in HEK293-TrkB cells co-expressing mGluR5, showing an enhanced response in the presence of 500 nM VU-29. For (D) and (I), points represent values from individual movies taken from distinct coverslips. For (K), individual points represent values from individual blots. For all conditions, the data come from at least three separate cell preparations. Unpaired t test for (I); one-way ANOVA with Tukey’s multiple comparisons for (K). All data are shown as the mean ± SEM; **p < 0.01, ***p < 0.001. See also Figures S3 and S4.
Figure 4.
Figure 4.. Molecular determinants of BDNF-induced Ca2+ oscillations
(A) Representative trace showing BDNF-induced Ca2+ oscillations in cells co-expressing TrkB and mGluR5-ΔECD. Ca2+ oscillations are also produced with VU0360172, an mGluR5 allosteric agonist. (B) Summary bar graph showing lack of BDNF-induced Ca2+ oscillations when mGluR5 is blocked by MPEP or when the F768D mutation is introduced, but not when the ECD is removed. Only cells responding to glutamate or VU0360172 (for mGluR5-ΔECD) were analyzed. (C) Representative trace showing BDNF-induced Ca2+ oscillations in cells co-expressing mGluR5 and TrkB-ΔFrs-ΔShc-ΔPLCγ. (D) Summary bar graph showing lack of BDNF-induced Ca2+ oscillations with kinase-dead TrkB (K571N), but clear oscillations for TrkB-ΔPLCγ and TrkB-ΔFrs-ΔShc-ΔPLCγ. Only cells showing a response to glutamate were analyzed. Points in (B) and (D) represent values from individual movies taken from distinct coverslips. For all conditions, data come from at least three separate cell preparations. All data are shown as the mean ± SEM. See also Figure S5.
Figure 5.
Figure 5.. G-protein dependence of TrkB/mGluR5 crosstalk
(A) Schematic of the proposed “G-protein synergy” mechanism underlying TrkB/mGluR5 crosstalk. (B) Summary bar graph showing effects of G-protein perturbations on the efficiency of 100 ng/mL BDNF-induced Ca2+ oscillations in cells expressing TrkB and mGluR5. PTX, pertussis toxin; DN-Gαi3, Gαi3-G203A; GRK2-CAAX, membrane-tethered GRK2; R587Q impairs Gβγ binding; D110A impairs Gαq binding; GRK2-CT, isolated, membrane-tethered PH domain of GRK2; WT, wild type; YM-254890 (20 μM), Gαq blocker. (C–E) Schematic of cAMP signaling (C) with average traces (D) and summary bar graph (E) showing that TrkB activation by 100 ng/mL BDNF inhibits cAMP production in a G-protein-dependent manner. (F–H) Schematic of GBAi inhibition of G-protein coupling (F) with summary bar graphs showing that GBAi overexpression decreases TrkB/mGluR5 crosstalk (G) but not MOR/mGluR5 crosstalk (H). For (B) and (F) through (H), only cells showing a response to 100 μM glutamate were analyzed, except for the YM-254890 condition, in which only cells responding to BDNF were included. Points represent values from individual movies taken from distinct coverslips (≥3 separate cell preparations per condition). All conditions were compared with the control group using one-way ANOVA with Dunnett’s multiple comparisons. All data are shown as the mean ± SEM; **p < 0.01; ***p < 0.001. See also Figure S6.
Figure 6.
Figure 6.. mGluR5-dependent BDNF-LTP and BDNF-induced dendritic spine growth are mediated by G-protein crosstalk
(A) Schematic of GRK2-CT mechanism. (B and C) fEPSP slope time course (B) showing that overexpression of GRK2-CT leads to attenuation of BDNF-LTP. In (B), gray bars show regions averaged for baseline and post-BDNF values in (C). (D) Bar graph summarizing the partial suppression of BDNF-induced increases in spine density with overexpression of GRK2-CT. (E) Schematic of YM-254890 mechanism. (F and G) fEPSP slope time course (F) showing that pre-incubation with YM-254890 leads to attenuation of BDNF-LTP. In (F), gray bars show regions averaged for baseline and post-BDNF values in (G). (H) Pre-incubation with YM-254890 inhibits BDNF-induced spine density increase. (I) Schematic of GBAi-S252A mechanism. (J and K) fEPSP slope time course (J) showing that overexpression of GBAi-S252A leads to attenuation of BDNF-LTP. Overexpression of the non-binding GBAi-W211A does not affect BDNF-LTP. In (J), gray bars show regions averaged for baseline and post-BDNF values in (K). (L) Bar graph summarizing the suppression of BDNF-induced increases in spine density with overexpression of GBAi-S252A, but not with overexpression of GBAi-W211A. (M) Schematic of RTK/GPCR synergy model that drives BDNF-dependent LTP and spine growth. Points in (D) and (G) represent independent slices from separate mice. Points in (D), (H), and (L) represent independent neurons from three or four separate preparations. Unpaired t test is used for (C), (G), and (K). One-way ANOVA with Tukey’s multiple comparisons is used for (D), (H), and (L). All data are shown as the mean ± SEM; *p < 0.05, **p < 0.01, ***p < 0.001. See also Figure S7.
Figure 7.
Figure 7.. RTK/GPCR crosstalk is observed across a panel of receptors
(A) Summary bar graph showing that co-expression of Gαq enhances Ca2+ responses upon low-dose BDNF-induced TrkB activation in HEK 293-TrkB cells. (B) Representative trace showing Ca2+ response upon co-application of BDNF and subthreshold dose of 5-HT in HEK 293 cells co-expressing TrkB-ΔPLC and 5-HT2AR. (C) Summary bar graph showing percentage of cells responding to BDNF in HEK293 cells co-expressing TrkBΔPLC and mGluR1 or 5-HT2AR or mGluR2 with or without co-application of 5-HT or glutamate. (D and E) Representative traces showing intracellular Ca2+ responses to endogenous EGFR activation by EGF in the absence (D) or presence (E) of mGluR5. (F) Distribution of EGF responses in the absence or presence of mGluR5 co-expression. (G and H) Representative traces showing intracellular Ca2+ responses to TrkA activation by NGF in the absence (G) or presence (H) of mGluR5. (I) Distribution of NGF responses in the absence or presence of mGluR5 co-expression. (J and K) Representative traces showing intracellular Ca2+ responses to IGF1R activation by IGF in the absence (J) or presence (K) of mGluR5. (L) Distribution of IGF responses in the absence or presence of mGluR5 co-expression. For (A) (C), (F), (I), and (L), points represent values from individual movies taken from distinct coverslips. For all conditions, data come from at least three separate cell preparations. Only cells showing a response to glutamate are analyzed in the conditions with mGluR5. One-way ANOVA with Tukey’s multiple comparisons is used for (A) and (C). All data are shown as the mean ± SEM; **p < 0.01, ***p < 0.001. See also Figure S8.

Update of

References

    1. Grundmann M, and Kostenis E (2017). Temporal Bias: Time-Encoded Dynamic GPCR Signaling. Trends Pharmacol. Sci 38, 1110–1124. - PubMed
    1. Lemmon MA, and Schlessinger J (2010). Cell signaling by receptor tyrosine kinases. Cell 141, 1117–1134. - PMC - PubMed
    1. Pierce KL, Premont RT, and Lefkowitz RJ (2002). Seven-transmembrane receptors. Nat. Rev. Mol. Cell Biol 3, 639–650. - PubMed
    1. Reiner A, and Levitz J (2018). Glutamatergic Signaling in the Central Nervous System: Ionotropic and Metabotropic Receptors in Concert. Neuron 98, 1080–1098. - PMC - PubMed
    1. Lee FS, and Hempstead BL (2018). New Roles for an Ancient Factor. Trends Neurosci. 41, 765–767. - PubMed

Publication types

MeSH terms

Substances

LinkOut - more resources