. 2023 Dec 22;9(51):eadj6856.
doi: 10.1126/sciadv.adj6856. Epub 2023 Dec 20.

Role of hierarchy structure on the mechanical adaptation of self-healing hydrogels under cyclic stretching

Affiliations

Role of hierarchy structure on the mechanical adaptation of self-healing hydrogels under cyclic stretching

Xueyu Li et al. Sci Adv. .

Abstract

Soft materials with mechanical adaptability have substantial potential for various applications in tissue engineering. Gaining a deep understanding of the structural evolution and adaptation dynamics of soft materials subjected to cyclic stretching gives insight into developing mechanically adaptive materials. Here, we investigate the effect of hierarchy structure on the mechanical adaptation of self-healing hydrogels under cyclic stretching training. A polyampholyte hydrogel, composed of hierarchical structures including ionic bonds, transient and permanent polymer networks, and bicontinuous hard/soft-phase networks, is adopted as a model. Conditions for effective training, mild overtraining, and fatal overtraining are demonstrated in soft materials. We further reveal that mesoscale hard/soft-phase networks dominate the long-term memory effect of training and play a crucial role in the asymmetric dynamics of compliance changes and the symmetric dynamics of hydrogel shape evolution. Our findings provide insights into the design of hierarchical structures for adaptive soft materials.


Figures

Fig. 1.
Fig. 1.. Schematic illustrations of hierarchical structures in s-PA gel and their dynamic adaptation to mechanical training.
(A) Multiscale structure in s-PA gel, including ~1-nm transient network by dynamic ionic bonds, ~10-nm (mesh size ξ) permanent polymer network by entanglement and cross-linking, and ~100-nm (d-spacing d0) bicontinuous hard/soft-phase networks by phase separation. The gel has at least three relaxation times related to the three networks (the transient network, the soft-phase network, and the hard-phase network). They are accumulations of ionic aggregations. (B) A scheme of the deformation of bicontinuous phase networks and transient network to cyclic training at conditions (I) λtr < λaffine and (II) λaffine < λtr < λc. I: Both the hard- and soft-phase networks are intact. II: Damage occurs in the hard-phase network, while the soft-phase network remains intact. λaffine and λc are maximum stretch ratio for the onset for the damage of the hard- and soft-phase networks, respectively (fig. S1). (C) A scheme of effective training (Training I), overtraining (Training II), and detraining. Under successive cyclic training stimuli, a stretch-induced decrease of stiffness and strain energy to a specific deformation (Wd) that increased compliance of the material (red curve). For Training I, the stiffness and Wd recover during detraining (dashed green curves). The recovery rate depends on duration (ttr) and training intensity. Overtraining occurred during Training II causing unrecoverable damage.
Fig. 2.
Fig. 2.. Cyclic training of s-PA gel and evolution of the bicontinuous phase structure.
(A) Experimental protocol for cyclic training and detraining (rest). L0 = 50 mm, H0 = 10 mm, and λtr = 1.7 to 7.1. (B) Evolution of loading-unloading curves with training cycle (Ntr). (C) Loading-unloading curves for a trained gel resting for trest. Training at λtr = 3.7 for Ntr = 104 cycles is taken as an example. (D) Scheme for work of extension (Wex, total hatched area) and the residual stretch ratio (λres). (E) Normalized Wex/Wex0 and λres in cyclic training and detraining as a function of time. Dashed arrows indicate the start point of detraining. The top scheme shows the corresponding training and detraining processes. Training at λtr = 3.7 for Ntr = 104 is taken as an example. (F and G) Cyclic training-induced evolution of 2D SAXS patterns (F) and the corresponding 1D azimuthal scan profiles (G). The right inset in (G) shows the azimuthal scan’s integration q range (between two concentric circles). The left inset shows the evolution of full peak width at half maximum (ΔΨ1/2) of unloading sample (strain-free state) as a function of training cycle Ntr. λtr = 2.9 < λaffine is taken as an example. (H) Microscopic deformation (d/d0) in perpendicular to loading direction versus macroscopic stretch ratio λ for loading to different cycle number Ntr at λtr = 3.44. The d/d0 decreases with λ, due to lateral contraction of phase network when elongation along the stretch direction (51). The blue line stands for the prediction of affine deformation (d/d0 = λ−1/2) of the phase networks perpendicular to the loading direction (incompressible materials). The black arrow indicates the maximum λ to show affine deformation of the bicontinuous hard/soft-phase networks (λaffine ≈ 3.06).
Fig. 3.
Fig. 3.. Characteristic training cycles and detraining times of s-PA gel at varied λtr for Ntr = 104cycles.
Characteristic training cycles and characteristic detraining times were obtained from the three-term Prony series fitting (see the Supplementary Materials). (A and B) Characteristic training cycles N1, N2, and N3 of Wex (A) and λres (B) as a function of λtr. (C and D) Characteristic training time τi and characteristic detraining time τf,i versus λtr for Wex (C) and λres (D). The vertical dashed line indicates λaffine. Dashed lines are guides for the eyes. The error bar (λtr = 2.1 to 3.7) is SE from at least three measurements.
Fig. 4.
Fig. 4.. Role of training intensity (λtr), training duration (Ntr), and rest time (trest) on fatigue resistance of s-PA gel.
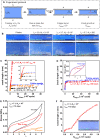
(A) Experimental protocol. The unnotched sample was trained at stretching ratio λtr for Ntr cycles, then allowed to rest for time trest, after which the sample was notched (c0 = 10 mm), and then immediately subjected to fatigue testing at λfatigue = 2.9 for Nfatigue cycles to observe crack resistance. Crack growth length is denoted as c. (B and C) Typical crack tip shape (B) and fatigue crack propagation behavior (C) for samples trained at λtr = 2.9 for Ntr = 2000 and λtr = 3.7 for Ntr = 2000 and 200 with trest = 0. Inset is a zoom-in view of the initial 6000 cycles. (D) Fatigue results for the sample experienced mild overtraining (λtr = 3.7 for Ntr = 2000) and resting for trest = 55 hours. Inset shows the loading-unloading curve of the rested sample compared to the pristine sample. (E and F) Loading-unloading curves for gel trained at λtr = 7.1 for Ntr = 104 and allowed to rest for trest = 10 days (E), and its fatigue test result (F).

References

    1. M. P. McHugh, C. H. Cosgrave, To stretch or not to stretch: The role of stretching in injury prevention and performance. Scand. J. Med. Sci. Sports 20, 169–181 (2010). - PubMed
    1. I. Mujika, S. Padilla, Detraining: Loss of training-induced physiological and performance adaptations. Part II: Long term insufficient training stimulus. Sports Med. 30, 145–154 (2000). - PubMed
    1. I. Mujika, S. Padilla, Detraining: Loss of training-induced physiological and performance adaptations. Part I: Short term insufficient training stimulus. Sports Med. 30, 79–87 (2000). - PubMed
    1. N. Matos, R. J. Winsley, Trainability of young athletes and overtraining. J. Sports Sci. Med. 6, 353–367 (2007). - PMC - PubMed
    1. L. L. Smith, Tissue trauma: The underlying cause of overtraining syndrome? J. Strength Cond. Res. 18, 185–193 (2004). - PubMed