. 2024 Feb 9;52(3):1298-1312.
doi: 10.1093/nar/gkad1207.

A phage-encoded RNA-binding protein inhibits the antiviral activity of a toxin-antitoxin system

Affiliations

A phage-encoded RNA-binding protein inhibits the antiviral activity of a toxin-antitoxin system

Chantal K Guegler et al. Nucleic Acids Res. .

Abstract

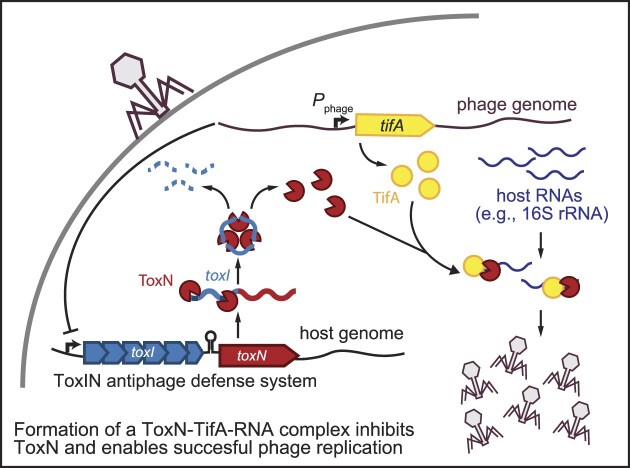
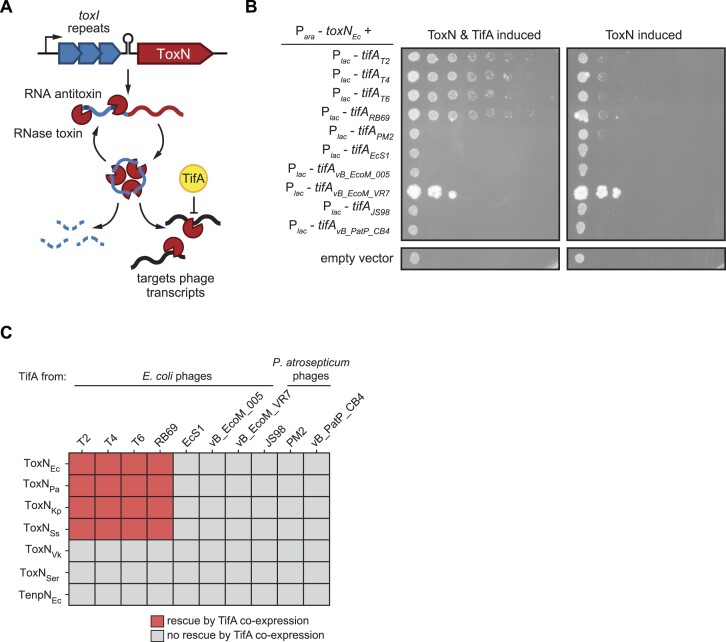
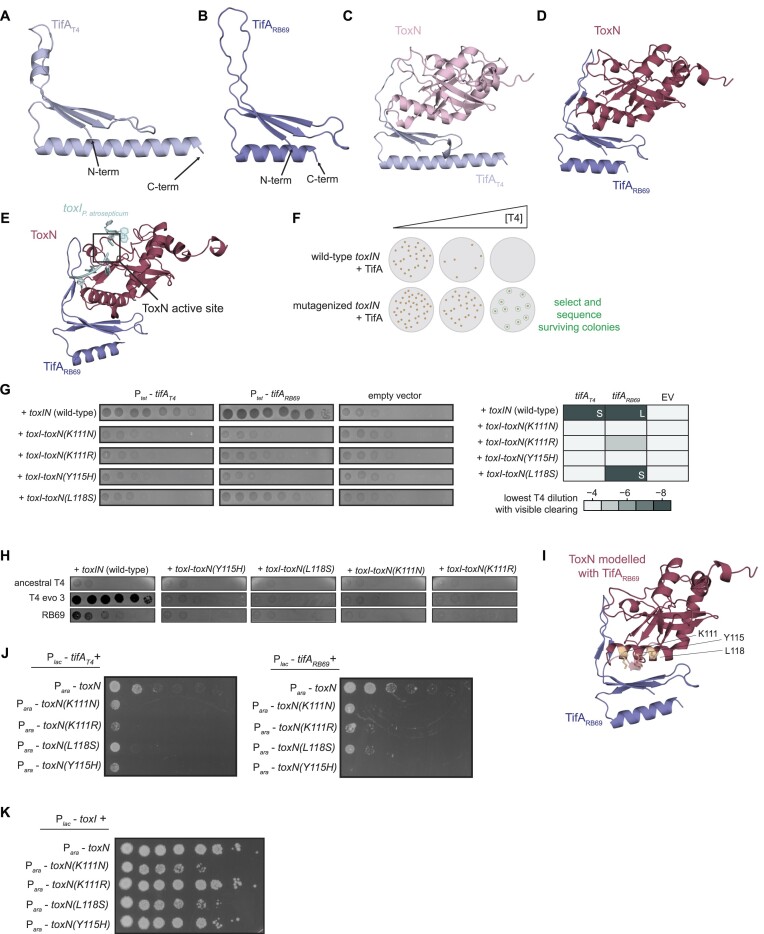
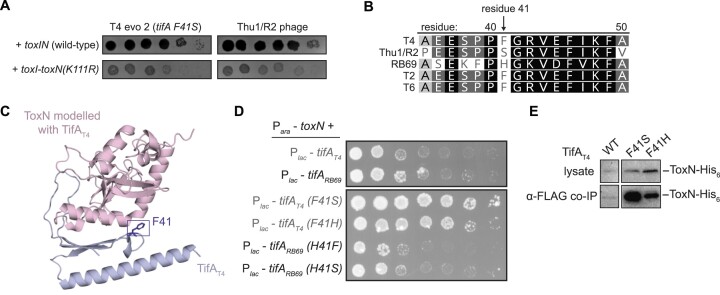
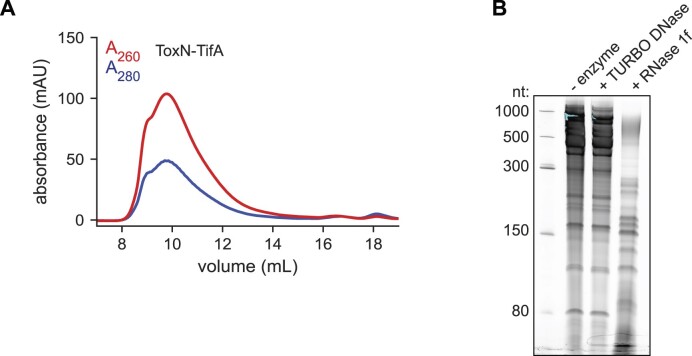
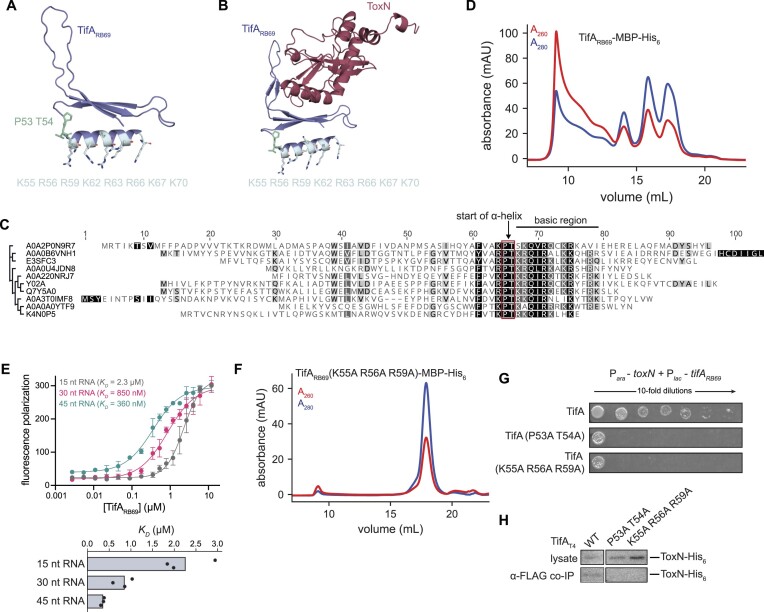
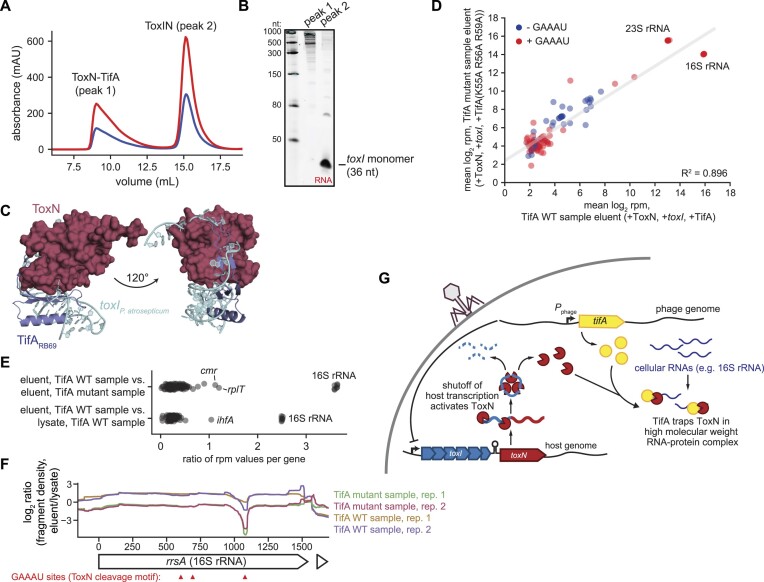
Bacteria harbor diverse mechanisms to defend themselves against their viral predators, bacteriophages. In response, phages can evolve counter-defense systems, most of which are poorly understood. In T4-like phages, the gene tifA prevents bacterial defense by the type III toxin-antitoxin (TA) system toxIN, but the mechanism by which TifA inhibits ToxIN remains unclear. Here, we show that TifA directly binds both the endoribonuclease ToxN and RNA, leading to the formation of a high molecular weight ribonucleoprotein complex in which ToxN is inhibited. The RNA binding activity of TifA is necessary for its interaction with and inhibition of ToxN. Thus, we propose that TifA inhibits ToxN during phage infection by trapping ToxN on cellular RNA, particularly the abundant 16S rRNA, thereby preventing cleavage of phage transcripts. Taken together, our results reveal a novel mechanism underlying inhibition of a phage-defensive RNase toxin by a small, phage-encoded protein.


Figures

Graphical Abstract
Graphical Abstract
Figure 1.
Figure 1.
TifA is a small phage-encoded inhibitor of ToxN. (A) Model for ToxIN complex formation, activation, and inhibition by TifA during phage infection. (B) Serial dilutions of E. coli cells expressing toxNEc and several tifA homologs. Plasmids harboring toxN and tifA under arabinose- and IPTG-inducible promoters, respectively, were transformed into E. coli MG1655, and expression was induced as indicated with the addition of arabinose and IPTG. (C) Heatmap showing the ability of various TifA homologs to rescue overproduction of various ToxN homologs; for plate images, see Supplementary Figure S2A-F. Bacterial species from which ToxN and TenpN homologs were cloned: Escherichia coli (Ec); Pectobacterium atrosepticum (Pa); Klebsiella pneumoniae (Kp); Shigella sonnei (Ss); Vibrio kanaloae (Vk); Serratia sp. SRS-8-S-2018 (Ser). Also see Supplementary Figures S1 and S2.
Figure 2.
Figure 2.
Prediction and validation of the ToxN-TifA interface. (A, B) AlphaFold model for TifAT4 (A) and TifARB69 (B). (C, D) AlphaFold models for the ToxN-TifAT4 (C) and ToxN-TifARB69 (D) complexes. (E) AlphaFold model for ToxN-TifARB69 with toxIPa and the predicted ToxN active site indicated. The position for toxIPa relative to ToxN was visualized by overlaying the E. coli ToxN predicted structure and the ToxINPa crystal structure (PDB: 2xdd) and is shown to indicate the ToxN active site. (F) Schematic of tab screen used to isolate TifA-resistant ToxN mutants. (G) (Left) Spotting assays for T4 on lawns of +toxIN (either wild-type or mutant toxN) cells with TifAT4, TifARB69, or neither expressed from an anhydrous tetracycline (tet)-inducible promoter during phage infection. (Right) Heatmap quantifying spotting assays, with color indicating the lowest T4 dilution in which the cells displayed visible clearing (either plaques or lower cell density). L and S refer to large and small plaques, respectively, for samples on which T4 formed visible plaques. (H) Spotting assays for wild-type (ancestral) T4, evolved T4 with increased expression of dmd-tifA (T4 evo 3), and RB69 on lawns of +toxIN (with wild-type or mutant toxN) cells. (I) AlphaFold model for the ToxN-TifARB69 complex, with residues K111, Y115 and L118 on ToxN highlighted. (J) Serial dilutions of E. coli cells ectopically expressing toxN (wild-type or mutant) and tifAT4 or tifARB69. (K) Serial dilutions of E. coli cells ectopically expressing toxN (wild-type or mutant) and toxI. Also see Supplementary Figures S3 and S4.
Figure 3.
Figure 3.
Mutations in TifA that strengthen its interaction with ToxN. (A) Spotting assays for evolved T4 phage with increased expression of dmd-tifA(F41S) (T4 evo 2) and Thu1/R2 phage on lawns of +toxIN and +toxI-toxN(K111R) cells. (B) Alignment of residues 35–50 of TifA homologs from several T4-like phages, with residue 41 indicated. Degree of sequence similarity is highlighted in gray/black. (C) AlphaFold model for the ToxN-TifAT4 complex, with residue F41 on TifA highlighted. (D) Serial dilutions of E. coli cells ectopically expressing toxN and wild-type or mutant tifAT4 or tifARB69. (E) Western blot of ToxN-His6 in cell lysate and following co-immunoprecipitation with TifAT4-FLAG (wild-type or mutant) during T4 infection.
Figure 4.
Figure 4.
ToxN and TifA form an RNA-protein complex.(A) Size-exclusion chromatogram of purified ToxN-TifARB69 run on a Superose 6 Increase 10/300 GL column. (B) Denaturing 6% urea-PAGE gel resolving nucleic acid that copurifies with ToxN-TifARB69 on chitin resin; nucleic acid was treated with Turbo DNase, RNase 1f, or neither before running on the gel. Also see Supplementary Figure S5.
Figure 5.
Figure 5.
TifA is an RNA-binding protein. (A) AlphaFold model for TifARB69 with residues capping the predicted C-terminal α-helix (P53 T54) and basic residues on the surface of the predicted α-helix indicated. (B) AlphaFold model for the ToxN-TifARB69 complex with residues capping the predicted C-terminal α-helix (P53 T54) and basic residues on the surface of the predicted α-helix indicated. (C) Sequence alignment for 10 TifA homologs from different phylogenetic clusters indicating the highly-conserved PT motif, immediately followed by a cluster of basic residues. UniProtKB accession numbers for the TifA homologs in the alignment are, from top to bottom, as follows: A0A2P0N9R7; A0A0B6VNH1; E3SFC3; A0A0U4JDN8; A0A220NRJ7; Y02A; Q7Y5A0; A0A3T0IMF8; A0A0A0YTF9; K4N0P5. (D) Size-exclusion chromatogram of purified TifARB69-MBP-His6 run on a Superose 6 Increase 10/300 GL column. (E) Fluorescence polarization assay of increasing concentrations of synthesized TifARB69 incubated with several fluorescently-labeled RNA species (lengths indicated). RNA sequences were derived from the region of the E. coli transcript artJ that is cleaved by ToxN; see Supplementary Table S5 for sequences. (F) Size-exclusion chromatogram of purified TifARB69 (K55A R56A R59A)-MBP-His6 run on a Superose 6 Increase 10/300 GL column. (G) Serial dilutions of E. coli cells ectopically expressing toxN and wild-type or RNA-binding deficient tifARB69. (H) Western blot of ToxN-His6 in cell lysate and following co-immunoprecipitation with TifAT4-FLAG (wild-type or RNA-binding deficient) in T4-infected cells producing TifAT4 and ToxN. Note that the TifAT4 wild-type control is same as in Figure 3E because both experiments were run on the same blot. Also see Supplementary Figure S6.
Figure 6.
Figure 6.
ToxN co-purifies with the 16S rRNA in the presence of TifA. (A) Size-exclusion chromatogram of ToxN co-purified with toxI and TifA run a Superose 6 Increase 10/300 GL column. (B) 6% urea–PAGE gel analyzing the RNA content of the two major peaks in (A). (C) AlphaFold model for the ToxN-TifARB69 complex, with P. atrosepticum toxI (PDB: 2xdd) modelled into the complex. (D) Scatter plot comparing the mean summed RNA-seq counts (log2 RPM) for individual genes in the TifA WT sample eluent (+ToxN, +toxI, +TifARB69) and the TifA mutant sample eluent (+ToxN, +toxI, +TifARB69 (K55A R56A R59A)) (two biological replicates each). Genes with RPM values greater than or equal to 3 in all sequenced libraries (lysates and eluents) are shown. The gray line indicates the linear regression fit for the data. (E) Scatter plots showing the ratio of mean RPM values for individual transcripts in the samples indicated. (F) Plot of log2 (ratio, fragment density in eluent versus lysate) across the 16S rRNA locus rrsA for both biological replicates of the TifA WT and TifA mutant samples. Sites containing the ToxN cleavage motif (GAAAU) are indicated with red arrows. (G) Proposed model for TifA inhibition of ToxN. Following phage infection, shutoff of host transcription, including of the toxIN locus, leads to degradation of toxI and release of ToxN. TifA then interacts with activated ToxN to prevent degradation of cellular transcripts, likely by recruiting and/or sequestering ToxN to a subset of cellular RNAs, in particular the 16S rRNA, such that ToxN can no longer cleave phage transcripts. Also see Supplementary Figure S7.

References

    1. Labrie S.J., Samson J.E., Moineau S.. Bacteriophage resistance mechanisms. Nat. Rev. Microbiol. 2010; 8:317–327. - PubMed
    1. Tal N., Sorek R.. SnapShot: bacterial immunity. Cell. 2022; 185:578–578. - PubMed
    1. Bernheim A., Sorek R.. The pan-immune system of bacteria: antiviral defence as a community resource. Nat. Rev. Microbiol. 2020; 18:113–119. - PubMed
    1. Hampton H.G., Watson B.N.J., Fineran P.C.. The arms race between bacteria and their phage foes. Nature. 2020; 577:327–336. - PubMed
    1. Samson J.E., Magadán A.H., Sabri M., Moineau S.. Revenge of the phages: defeating bacterial defences. Nat. Rev. Microbiol. 2013; 11:675–687. - PubMed

MeSH terms