. 2024 Mar 21;52(5):2273-2289.
doi: 10.1093/nar/gkad1193.

Histone lactylation-boosted ALKBH3 potentiates tumor progression and diminished promyelocytic leukemia protein nuclear condensates by m1A demethylation of SP100A

Affiliations

Histone lactylation-boosted ALKBH3 potentiates tumor progression and diminished promyelocytic leukemia protein nuclear condensates by m1A demethylation of SP100A

Xiang Gu et al. Nucleic Acids Res. .

Abstract

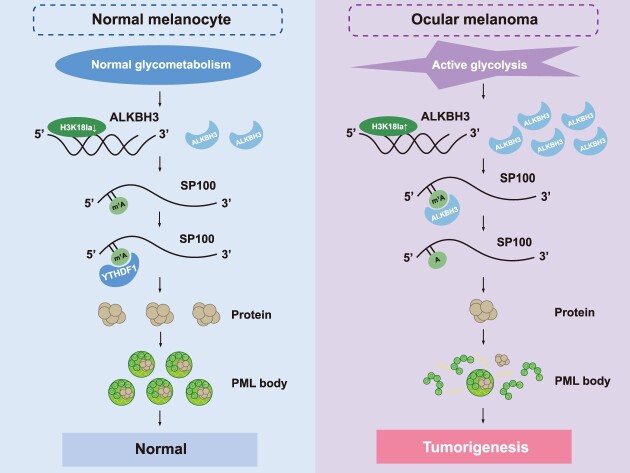
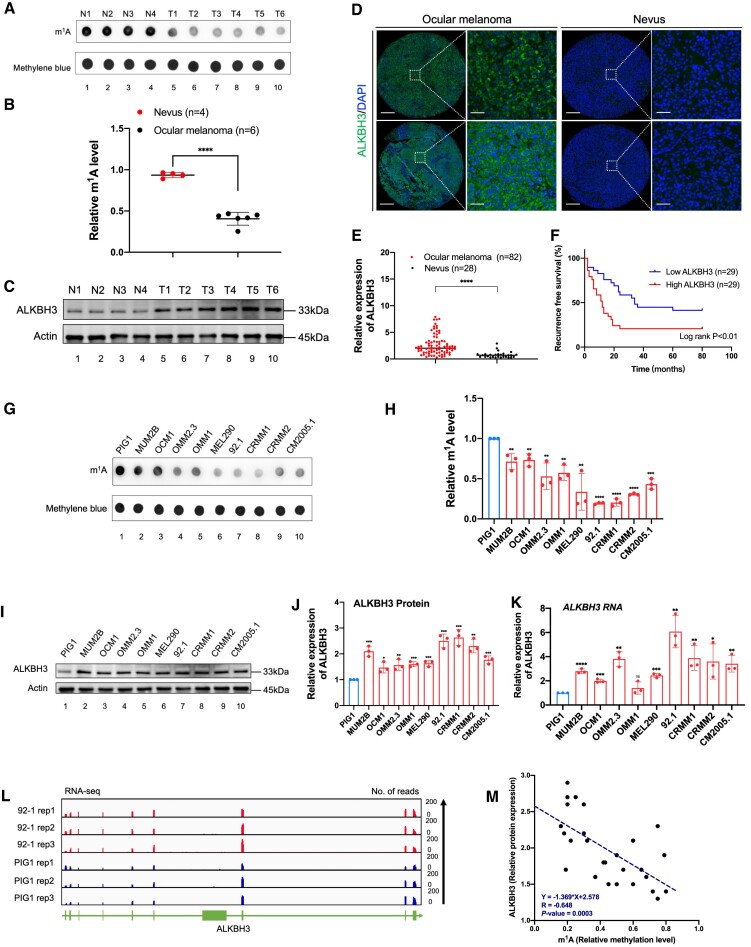
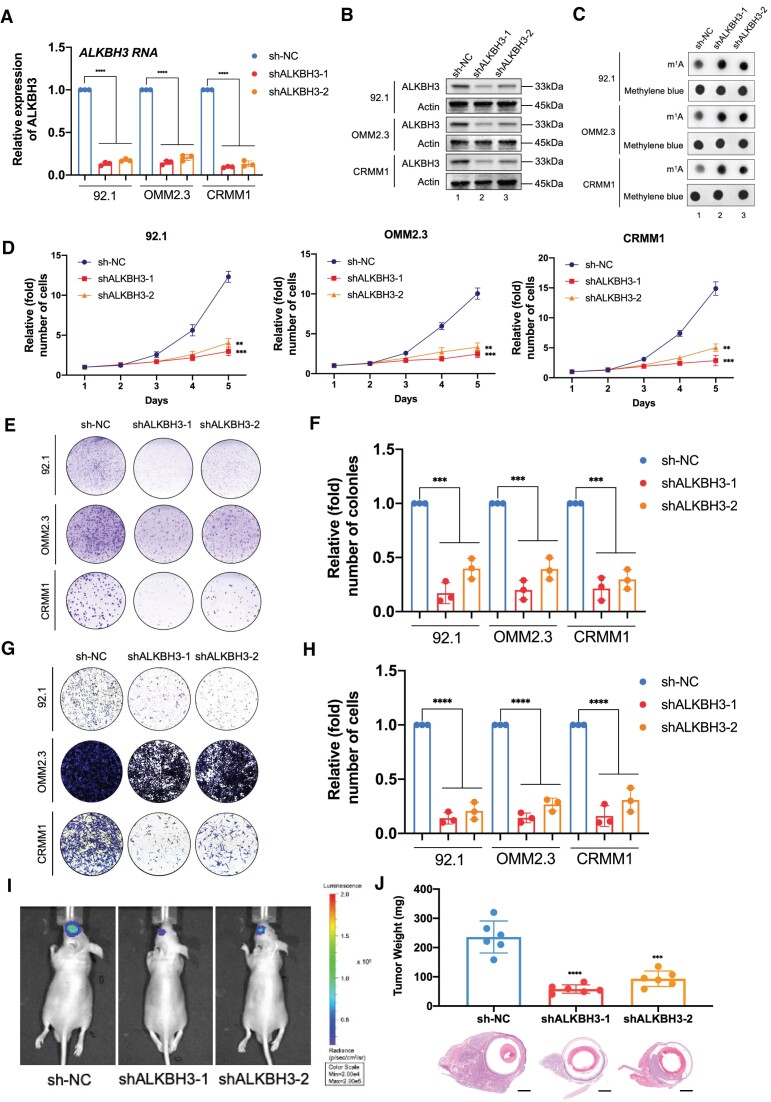
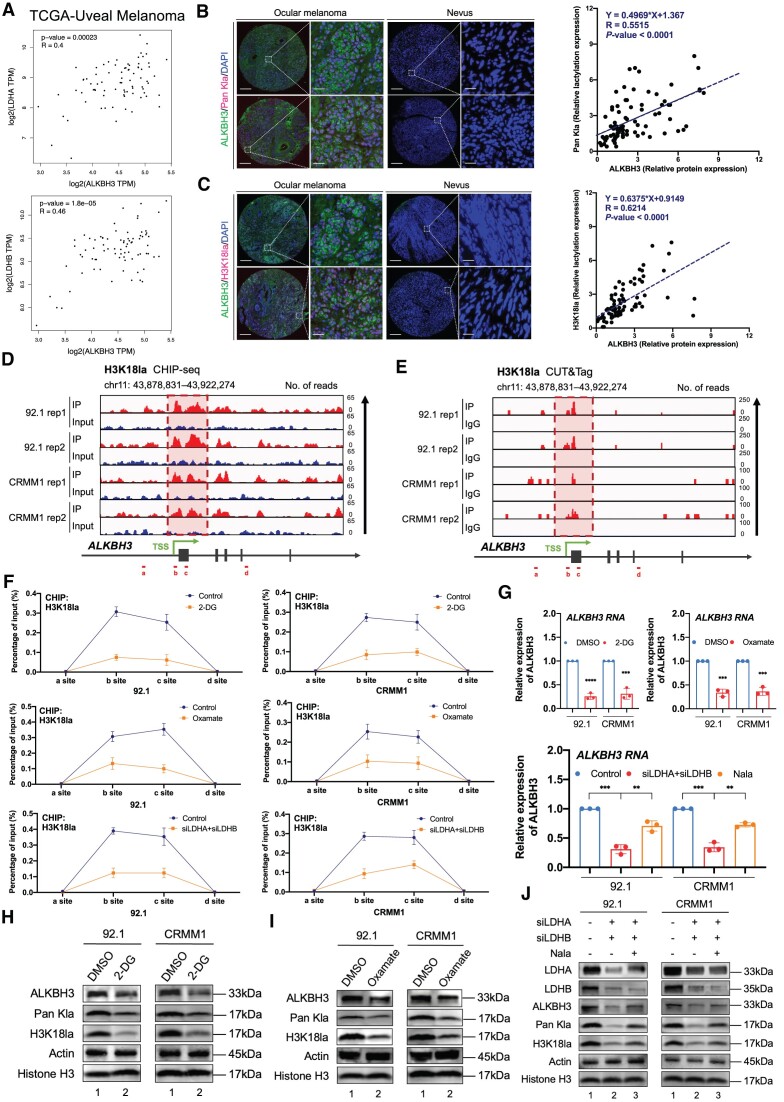
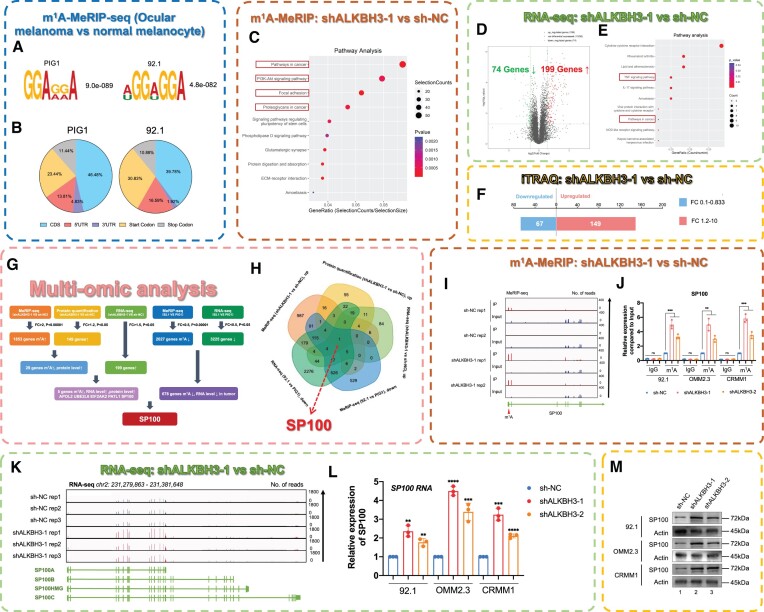
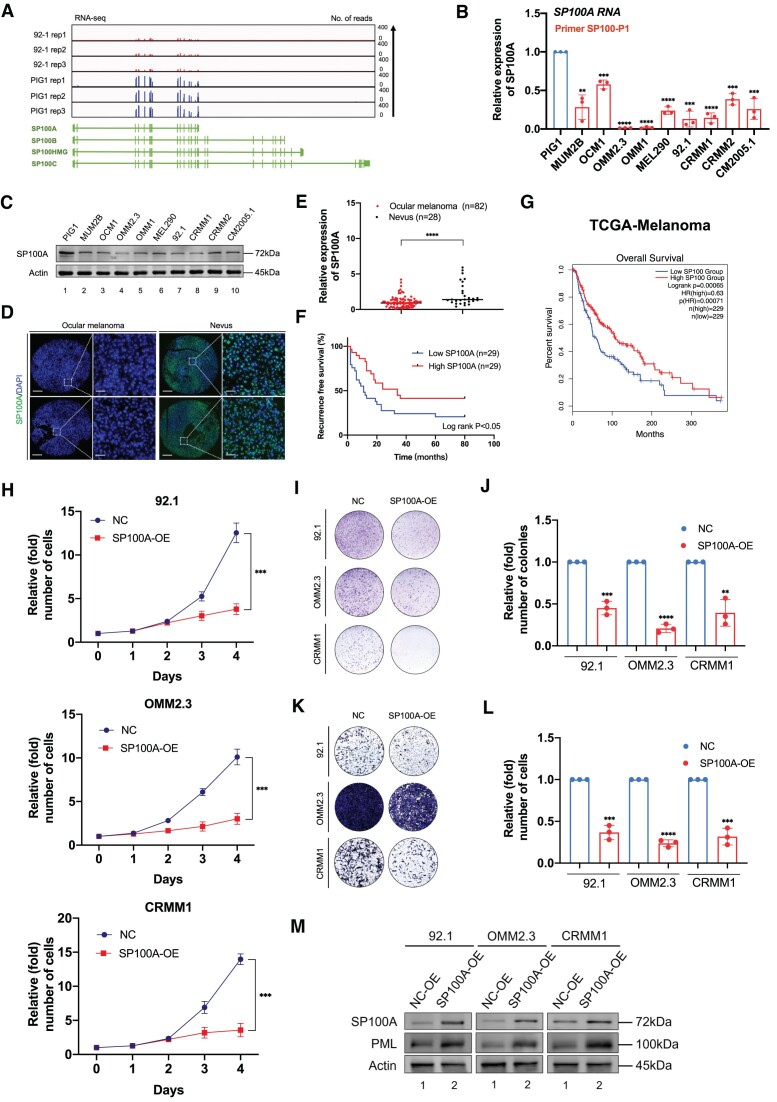
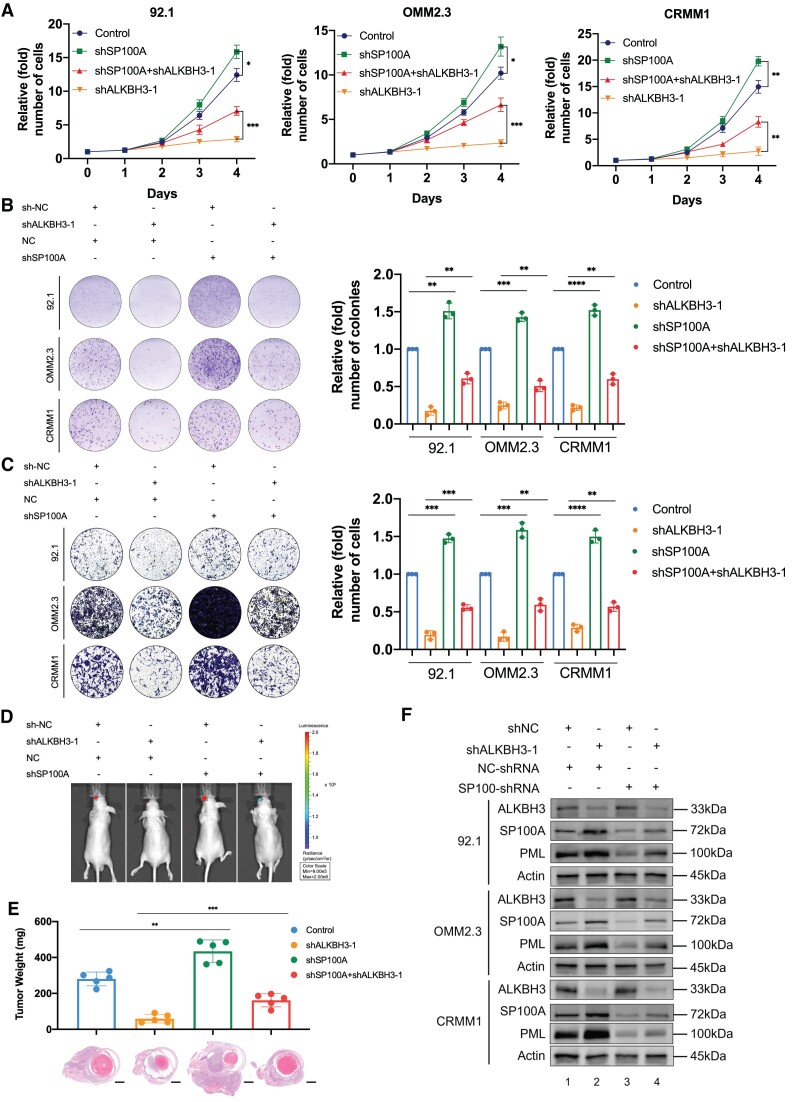
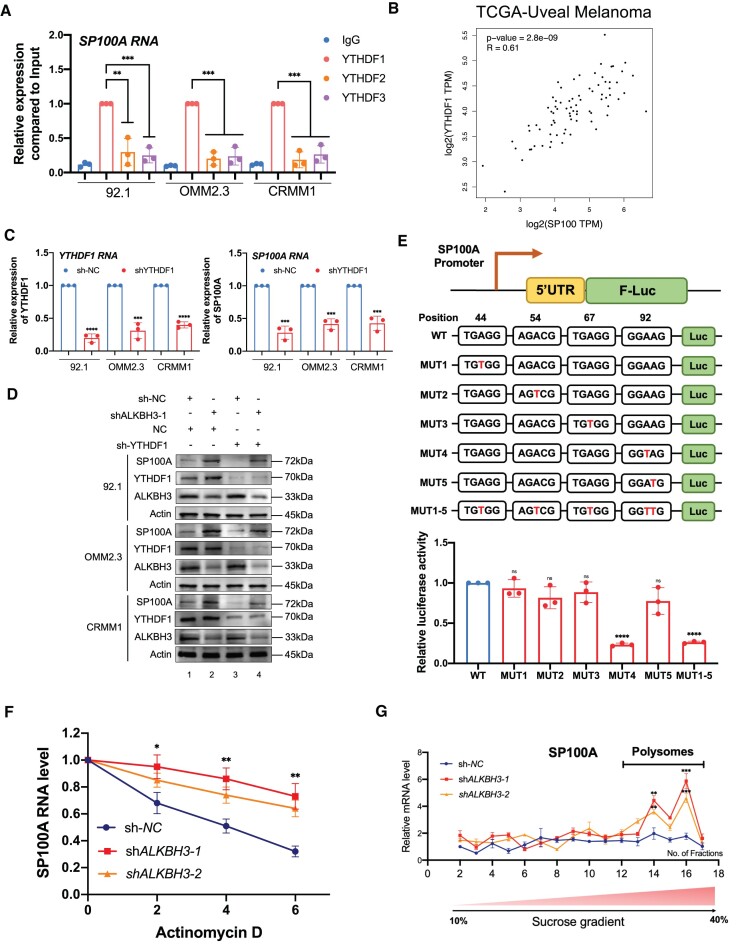
Albeit N1-Methyladenosine (m1A) RNA modification represents an important regulator of RNA metabolism, the role of m1A modification in carcinogenesis remains enigmatic. Herein, we found that histone lactylation enhances ALKBH3 expression and simultaneously attenuates the formation of tumor-suppressive promyelocytic leukemia protein (PML) condensates by removing the m1A methylation of SP100A, promoting the malignant transformation of cancers. First, ALKBH3 is specifically upregulated in high-risk ocular melanoma due to excessive histone lactylation levels, referring to m1A hypomethylation status. Moreover, the multiomics analysis subsequently identified that SP100A, a core component for PML bodies, serves as a downstream candidate target for ALKBH3. Therapeutically, the silencing of ALKBH3 exhibits efficient therapeutic efficacy in melanoma both in vitro and in vivo, which could be reversed by the depletion of SP100A. Mechanistically, we found that YTHDF1 is responsible for recognition of the m1A methylated SP100A transcript, which increases its RNA stability and translational efficacy. Conclusively, we initially demonstrated that m1A modification is necessary for tumor suppressor gene expression, expanding the current understandings of dynamic m1A function during tumor progression. In addition, our results indicate that lactylation-driven ALKBH3 is essential for the formation of PML nuclear condensates, which bridges our knowledge of m1A modification, metabolic reprogramming, and phase-separation events.


Figures

Graphical Abstract
Graphical Abstract
Figure 1.
Figure 1.
Ocular melanoma exhibits increased ALKBH3 expression and decreased m1A levels, which are associated with poor survival. (A) Dot blot showing the m1A signal relative to the methylene blue signal in tumor and normal samples. The data are representative of experimental triplicates. (B) Densitometric analysis showing the expression of m1A relative to methylene blue in tumor and normal samples. The data are presented as the mean ± SD of experimental triplicates. Significance was determined by unpaired two-tailed Student's t test. ****P < 0.0001. (C) Western blot showing ALKBH3 expression relative to ACTB expression in tumor and normal samples. The data are representative of experimental triplicates. (D) Immunofluorescence of ALKBH3 (green) and DAPI (blue) in tumor and normal samples. Scale bars: left panel, 100 μm; right panel, 20 μm. (E) Statistical results of ALKBH3 levels in normal and tumor tissues. Significance was determined by unpaired two-tailed Student's t test. ****P < 0.0001. (F) Kaplan–Meier curves of tumor recurrence showing the difference between ocular melanoma patients with low ALKBH3 levels (n = 29) and high ALKBH3 levels (n = 29). log rank test, P < 0.01. (G) Dot blot showing the m1A signal relative to the methylene blue signal in ocular melanoma cells and normal melanocytes. The data are representative of experimental triplicates. (H) Densitometric analysis showing the expression of m1A relative to methylene blue in ocular melanoma cells and normal melanocytes. The data are presented as the mean ± SD of experimental triplicates. Significance was determined by unpaired two-tailed Student's t test. **P < 0.01, ***P < 0.001, ****P < 0.0001. (I) Western blot showing ALKBH3 expression relative to ACTB expression in ocular melanoma cells and normal melanocytes. The data are representative of experimental triplicates. (J) Densitometric analysis showing the protein expression of ALKBH3 relative to that of ACTB in ocular melanoma cells and normal melanocytes. The data are presented as the mean ± SD of experimental triplicates. Significance was determined by unpaired two-tailed Student's t test. *P < 0.05, **P < 0.01, ***P < 0.001. (K) qPCR data showing ALKBH3 expression in ocular melanoma cells relative to PIG1 cells. The data are presented as the mean ± SD of experimental triplicates. Significance was determined by unpaired two-tailed Student's t test. *P < 0.05, **P < 0.01, ***P < 0.001, ****P < 0.0001. (L) Integrative Genomics Viewer (IGV) tracks for ALKBH3 from RNA-seq data in an ocular melanoma cell line (92.1) and a normal melanocyte cell line (PIG1). Data were obtained from biological triplicates. (M) Correlation analysis of the relative protein expression of ALKBH3 and the m1A methylation level in ocular melanoma cells and normal melanocytes. Significance was determined by Pearson correlation analysis (R = –0.648, P= 0.0003).
Figure 2.
Figure 2.
ALKBH3 knockdown increased the m1A levels and suppressed ocular melanoma tumorigenesis. (A) qPCR data showing ALKBH3 expression in ocular melanoma cells (92.1, OMM2.3 and CRMM1) upon ALKBH3 knockdown. The data are presented as the mean± SD of experimental triplicates. Significance was determined by unpaired two-tailed Student's t test. ****P < 0.0001. (B) Western blot showing ALKBH3 expression relative to ACTB expression in ocular melanoma cells (92.1, OMM2.3 and CRMM1) upon ALKBH3 knockdown. (C) Dot blot showing the m1A signal relative to the methylene blue signal in ocular melanoma cells (92.1, OMM2.3 and CRMM1) upon ALKBH3 knockdown. (D) A CCK-8 assay was employed to evaluate the proliferation of ocular melanoma cells (92.1, OMM2.3 and CRMM1) upon ALKBH3 knockdown. The data are presented as the mean ± SD of experimental triplicates. Significance was determined by unpaired two-tailed Student's t test. **P < 0.01, ***P < 0.001. (E) A colony formation assay was employed to evaluate the growth of ocular melanoma cells (92.1, OMM2.3 and CRMM1) upon ALKBH3 knockdown. Representative images from three experimental replicates are shown. (F) Statistical analysis of the colony formation assay data in ocular melanoma cells (92.1, OMM2.3 and CRMM1) upon ALKBH3 knockdown. The data are presented as the mean ± SD of experimental triplicates. Significance was determined by unpaired two-tailed Student's t test. ***P < 0.001. (G) A transwell assay was employed to evaluate the migration of ocular melanoma cells (92.1, OMM2.3 and CRMM1) upon ALKBH3 knockdown. Representative images from three experimental replicates are shown. (H) Statistical analysis of the transwell assay data in ocular melanoma cells (92.1, OMM2.3 and CRMM1) upon ALKBH3 knockdown. The data are presented as the mean ± SD of experimental triplicates. Significance was determined by unpaired two-tailed Student's t test. ****P < 0.0001. (I) Images acquired with an in vivo small animal imaging system showing the suppression of bioluminescent signals in orthotopic xenografts derived from ALKBH3-deficient 92.1 cells. Representative images from six biological replicates are shown. The remaining images are provided in Supplementary Figure 1B. (J) Histograms of the weights of orthotopic xenografts derived from ALKBH3-deficient 92.1 cells. H&E staining was used to visualize tumor tissues. Representative images from six biological replicates are shown. The data are presented as the mean ± SD. Significance was determined by unpaired two-tailed Student's t test. ***P < 0.001, ****P< 0.0001. Scale bar: 200 μm.
Figure 3.
Figure 3.
Histone lactylation potentiates the expression of ALKBH3. (A) Correlation analysis of ALKBH3 expression and LDHA or LDHB expression in the TCGA-UM cohort (n = 80). Significance was determined by Pearson correlation analysis (LDHA: R = 0.4, P = 0.00023, LDHB: R = 0.46, P = 0.000018). (B) Immunofluorescence of ALKBH3 (green), Pan Kla (red) and DAPI (blue) in tumor and normal samples. Scale bars: left panel, 100 μm; right panel, 20 μm. Correlation analysis of the relative protein expression of ALKBH3 and Pan Kla level in ocular melanoma cells and normal melanocytes. Significance was determined by Pearson correlation analysis (R= 0.5515, P < 0.0001). (C) Immunofluorescence of ALKBH3 (green), H3K18la (red) and DAPI (blue) in tumor and normal samples. Scale bars: left panel, 100 μm; right panel, 20 μm. Correlation analysis of the relative protein expression of ALKBH3 and H3K18la level in ocular melanoma cells and normal melanocytes. Significance was determined by Pearson correlation analysis (R= 0.6214, P < 0.0001). (D) IGV tracks from ChIP-seq analysis showing H3K18la enrichment at the promoter of ALKBH3. Sites a–d are distributed in the ALKBH3 genomic region, and sites b and c are the H3K18la peaks. Biological duplicates were analyzed. (E) IGV tracks from CUT&Tag analysis showing H3K18la enrichment at the promoter of ALKBH3. Sites a–d are distributed in the ALKBH3 genomic region, and sites b and c are the H3K18la peaks. Biological duplicates were analyzed. (F) ChIP-qPCR assay of H3K18la status in the ALKBH3genomic region in ocular melanoma cells (92.1 and CRMM1) upon treatment with histone lactylation inhibitors (2-DG or oxamate) or LDHA/B inhibition. The data are presented as the mean ± SD of experimental triplicates. (G) qPCR data showing ALKBH3 expression in ocular melanoma cells (92.1 and CRMM1) upon treatment with histone lactylation inhibitors (2-DG or oxamate) or LDHA/B inhibition. The data are presented as the mean ± SD of experimental triplicates. Significance was determined by unpaired two-tailed Student's t test. **P < 0.01, ***P < 0.001, ****P < 0.0001. (H and I) Western blot showing ALKBH3 expression relative to ACTB expression and Pan Kla, H3K18la expression relative to Histone H3 expression in ocular melanoma cells (92.1 and CRMM1) upon histone lactylation inhibitors (2-DG or oxamate). (J) Western blot showing LDHA, LDHB, ALKBH3 expression relative to ACTB expression and Pan Kla, H3K18la expression relative to Histone H3 expression in ocular melanoma cells (92.1 and CRMM1) upon LDHA/B inhibition. Nala, sodium lactate.
Figure 4.
Figure 4.
ALKBH3 suppresses SP100 expression by removing its m1A modification. (A) m1A-MeRIP-seq data showing the top enriched motifs within m1A peaks identified in ocular melanoma cells and normal melanocytes. (B) Pie charts showing the m1A peak distribution in different RNA regions (CDS, 5′ UTR, 3′ UTR, start codon and stop codon) in ocular melanoma cells and normal melanocytes. (C) KEGG pathway analysis of m1A-modified genes in wild-type and ALKBH3-deficient ocular melanoma cells. (D) Volcano plots showing ALKBH3-regulated genes in wild-type and ALKBH3-deficient ocular melanoma cells. (E) KEGG pathway analysis of ALKBH3-regulated genes in wild-type and ALKBH3-deficient ocular melanoma cells. (F) Histogram showing the protein expression of ALKBH3-regulated genes in wide-type and ALKBH3-deficient ocular melanoma cells. (G and H) Multiomics analysis identified SP100 as a downstream target of ALKBH3. (I) IGV tracks from m1A-meRIP-seq analysis showing m1A enrichment at the 5′UTR of SP100A. Biological duplicates were analyzed. (J) m1A-MeRIP-qPCR assay of m1A status in SP100 in wild-type and ALKBH3-deficient ocular melanoma cells (92.1, OMM2.3 and CRMM1). The data are presented as the mean ± SD of experimental triplicates. Significance was determined by unpaired two-tailed Student's t test. **P < 0.01, ***P < 0.001. (K) IGV tracks for SP100 from RNA-seq data in wild-type and ALKBH3-deficient ocular melanoma cells. Biological triplicates were analyzed. (L) qPCR data showing SP100 RNA expression in ocular melanoma cells (92.1, OMM2.3 and CRMM1) upon ALKBH3 knockdown. The data are presented as the mean ± SD of experimental triplicates. Significance was determined by unpaired two-tailed Student's t test. **P < 0.01, ***P < 0.001, ****P < 0.0001. (M) Western blot showing SP100 expression relative to ACTB expression in wild-type and ALKBH3-deficient ocular melanoma cells (92.1, OMM2.3 and CRMM1).
Figure 5.
Figure 5.
SP100A functions as a tumor suppressor in ocular melanoma. (A) IGV tracks for SP100 from RNA-seq data in an ocular melanoma cell line (92.1) and a normal melanocyte cell line (PIG1). Data were obtained from biological triplicates. (B) qPCR data showing the SP100A expression in ocular melanoma cells relative to PIG1 cells. The data are presented as the mean ± SD of experimental triplicates. Significance was determined by unpaired two-tailed Student's t test. **P < 0.01, ***P < 0.001, ****P < 0.0001. (C) Western blot showing SP100A expression relative to ACTB expression in ocular melanoma cells and normal melanocytes. The data are representative of experimental triplicates. (D) Immunofluorescence of SP100A (green) and DAPI (blue) in tumor and normal samples. Scale bars: left panel, 100 μm; right panel, 20 μm. (E) Statistical results of SP100A levels in normal and tumor tissues. Significance was determined by unpaired two-tailed Student's t test. ****P < 0.0001. (F) Kaplan–Meier curves of tumor recurrence showing the difference between ocular melanoma patients with low SP100A levels (n = 29) and high SP100A levels (n = 29). log rank test, P < 0.05. (G) Kaplan–Meier analysis of the correlations between SP100 expression and overall survival in TCGA melanoma patients stratified by the SP100 expression level: high (top 50th percentile, n = 229) and low (bottom 50th percentile, n = 229). Significance was determined by a two-sided log-rank test. (H) A CCK8 assay was employed to evaluate the proliferation of ocular melanoma cells (92.1, OMM2.3 and CRMM1) upon SP100A overexpression. The data are presented as the mean ± SD of experimental triplicates. Significance was determined by unpaired two-tailed Student's t test. ***P < 0.001. (I) A colony formation assay was employed to evaluate the growth of ocular melanoma cells (92.1, OMM2.3 and CRMM1) upon SP100A overexpression. Representative images from three experimental replicates are shown. (J) Statistical analysis of the colony formation assay data in ocular melanoma cells (92.1, OMM2.3 and CRMM1) upon SP100A overexpression. The data are presented as the mean ± SD of experimental triplicates. Significance was determined by unpaired two-tailed Student's t test. **P < 0.01, ***P < 0.001, ****P < 0.0001. (K) A transwell assay was employed to evaluate the migration of ocular melanoma cells (92.1, OMM2.3 and CRMM1) upon SP100A overexpression. Representative images from three experimental replicates are shown. (L) Statistical analysis of the transwell assay data in ocular melanoma cells (92.1, OMM2.3 and CRMM1) upon SP100A overexpression. The data are presented as the mean ± SD of experimental triplicates. Significance was determined by unpaired two-tailed Student's t test. ***P < 0.001, ****P < 0.0001. (M) Western blot showing PML expression relative to ACTB expression in wild-type and SP100A-overexpressing ocular melanoma cells (92.1, OMM2.3 and CRMM1).
Figure 6.
Figure 6.
The anticancer effects of ALKBH3 knockdown were partially blocked by SP100A silencing. (A) A CCK8 assay was performed to assess the proliferation of ALKBH3-deficient ocular melanoma cells (92.1, OMM2.3 and CRMM1) upon SP100A silencing. The data are presented as the mean ± SD of experimental triplicates. Significance was determined by unpaired two-tailed Student's t test. *P < 0.05, **P < 0.01, ***P < 0.001. (B) A colony formation assay was performed to assess the growth of ALKBH3-deficient ocular melanoma cells (92.1, OMM2.3 and CRMM1) upon SP100A silencing. Representative images from three experimental replicates are shown. The data are presented as the mean ± SD. Significance was determined by unpaired two-tailed Student's t test. **P < 0.01, ***P < 0.001, ****P < 0.0001. (C) A transwell assay was performed to assess the migration of ALKBH3-deficient ocular melanoma cells (92.1, OMM2.3 and CRMM1) upon SP100A silencing. Representative images from three experimental replicates are shown. The data are presented as the mean ± SD. Significance was determined by unpaired two-tailed Student's t test. **P < 0.01, ***P < 0.001, ****P < 0.0001. (D) Images acquired with an in vivo small animal imaging system showing the suppression of bioluminescent signals in orthotopic xenografts derived from ALKBH3-deficient 92.1 cells upon SP100A silencing. Representative images from five biological replicates are shown. The remaining images are provided in Supplementary Figure S12B. (E) Histograms of the weights of orthotopic xenografts derived from ALKBH3-deficient 92.1 cells upon SP100A silencing. H&E staining was used to visualize tumor tissues. Representative images from five biological replicates are shown. The data are presented as the mean ± SD values. Significance was determined by unpaired two-tailed Student's t test. **P < 0.01, ***P < 0.001. Scale bar: 200 μm. (F) Western blot showing ALKBH3, SP100A, PML expression relative to ACTB expression in ocular melanoma cells (92.1, OMM2.3 and CRMM1) upon ALKBH3 and SP100A knockdown.
Figure 7.
Figure 7.
m1A modification of SP100A increases its RNA stability and translational efficacy. (A) RIP-qPCR assay of SP100A expression in ocular melanoma cells (92.1, OMM2.3 and CRMM1) by YTHDF1, YTHDF2 and YTHDF3. The data are presented as the mean ± SD of experimental triplicates. Significance was determined by unpaired two-tailed Student's t test. **P < 0.01, ***P < 0.001. (B) Correlation analysis of SP100A expression and YTHDF1 expression in the TCGA-UM cohort (n = 80). Significance was determined by Pearson correlation analysis (R = 0.61, P < 0.0001). (C) qPCR data showing YTHDF1 RNA expression and SP100A RNA in ocular melanoma cells (92.1, OMM2.3 and CRMM1) upon YTHDF1 knockdown. The data are presented as the mean ± SD of experimental triplicates. Significance was determined by unpaired two-tailed Student's t test. ***P < 0.001, ****P< 0.0001. (D) Western blot showing YTHDF1, SP100A, ALKBH3 expression relative to ACTB expression in ocular melanoma cells (92.1, OMM2.3 and CRMM1) upon ALKBH3 and YTHDF1 knockdown. (E) The luciferase reporter gene assay demonstrated the relative luciferase activity of the wild-type and six mutant SP100A 5′UTR reporter vectors. The data are presented as the means ± SD of experimental triplicates. Significance was determined by unpaired two-tailed Student's t test. ****P < 0.0001. (F) Half-life of SP100A in wild-type and ALKBH3-deficient 92.1 cells treated with actinomycin (5 g/ml) for 0–6 h. (G) Polysome profiling assays of 92.1 cells with or without ALKBH3 knockdown. RNAs in different ribosome fractions were extracted and subjected to qPCR analysis. Data are shown as the mean ± SD. Significance was determined by unpaired two-tailed Student's t test. ***P < 0.001, ****P < 0.0001.

References

    1. Barbieri I., Kouzarides T. Role of RNA modifications in cancer. Nat. Rev. Cancer. 2020; 20:303–322. - PubMed
    1. Zhao B.S., Roundtree I.A., He C. Post-transcriptional gene regulation by mRNA modifications. Nat. Rev. Mol. Cell Biol. 2017; 18:31–42. - PMC - PubMed
    1. Boriack-Sjodin P.A., Ribich S., Copeland R.A. RNA-modifying proteins as anticancer drug targets. Nat. Rev. Drug Discov. 2018; 17:435–453. - PubMed
    1. Choi J., Indrisiunaite G., DeMirci H., Ieong K.W., Wang J., Petrov A., Prabhakar A., Rechavi G., Dominissini D., He C. et al. . 2'-O-methylation in mRNA disrupts tRNA decoding during translation elongation. Nat. Struct. Mol. Biol. 2018; 25:208–216. - PMC - PubMed
    1. Han X., Wang M., Zhao Y.L., Yang Y., Yang Y.G. RNA methylations in human cancers. Semin. Cancer Biol. 2021; 75:97–115. - PubMed

MeSH terms