. 2023 Dec 19;4(12):101333.
doi: 10.1016/j.xcrm.2023.101333.

Single-cell RNA-sequencing of PBMCs from SAVI patients reveals disease-associated monocytes with elevated integrated stress response

Affiliations

Single-cell RNA-sequencing of PBMCs from SAVI patients reveals disease-associated monocytes with elevated integrated stress response

Camille de Cevins et al. Cell Rep Med. .

Abstract

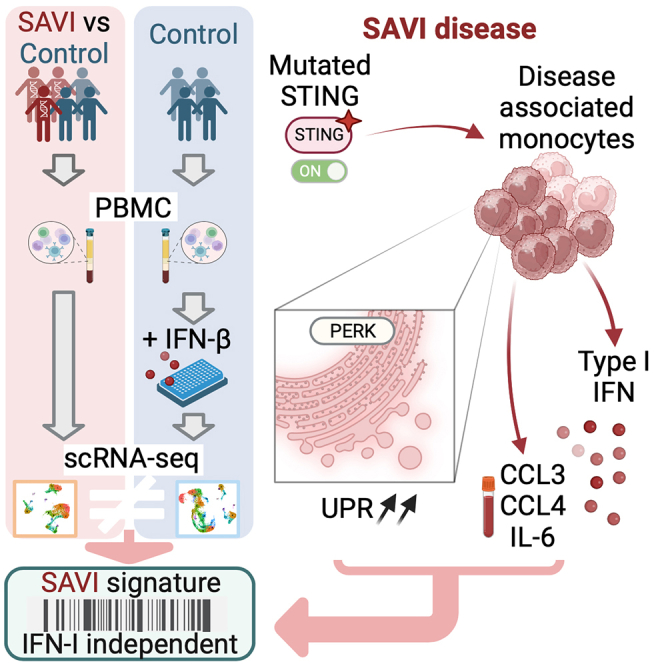
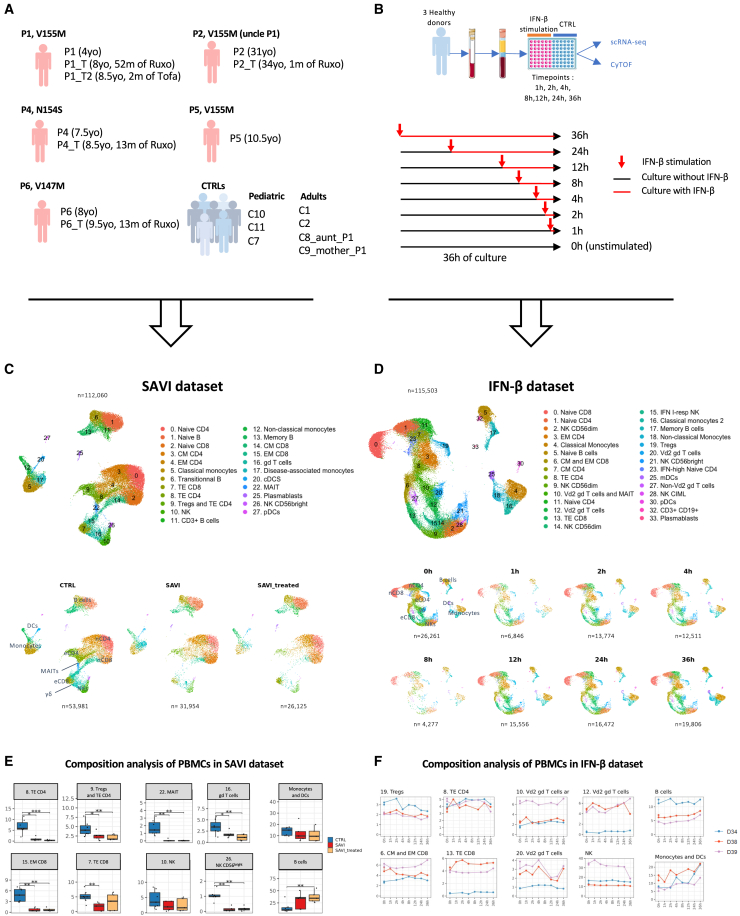
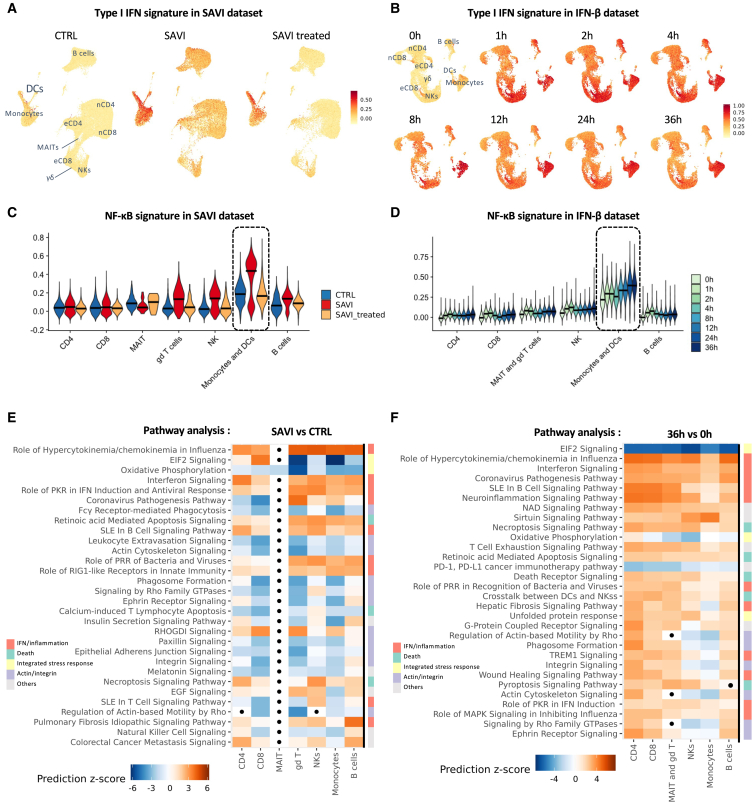
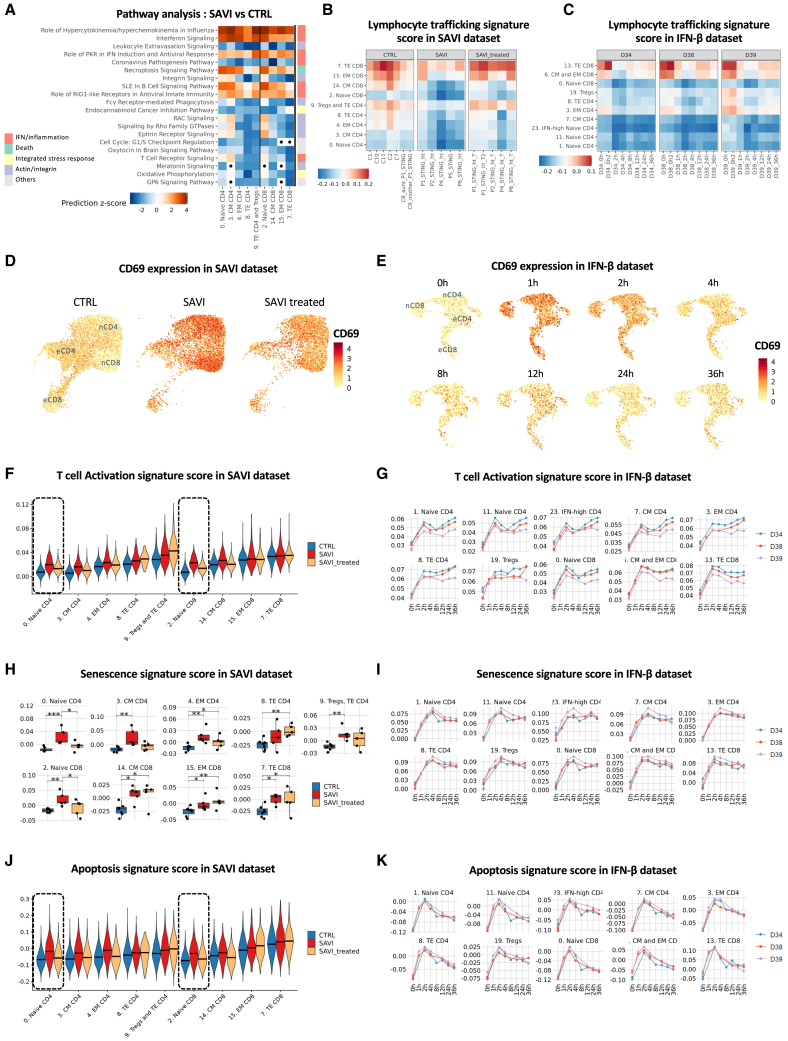
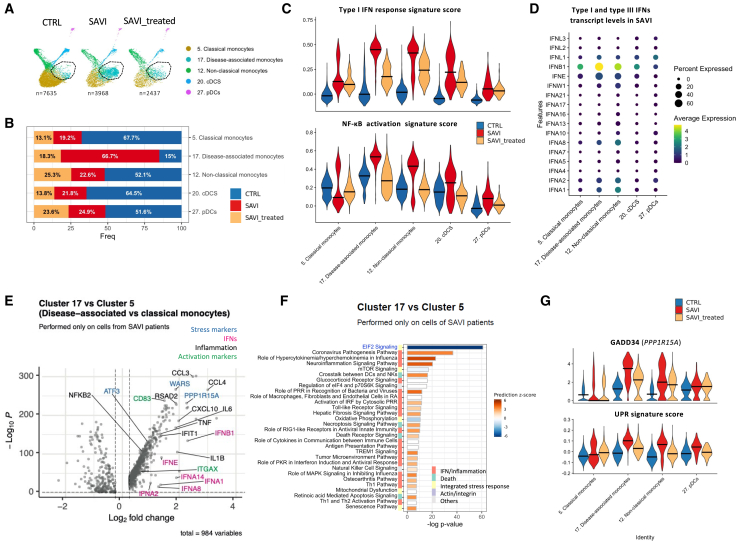
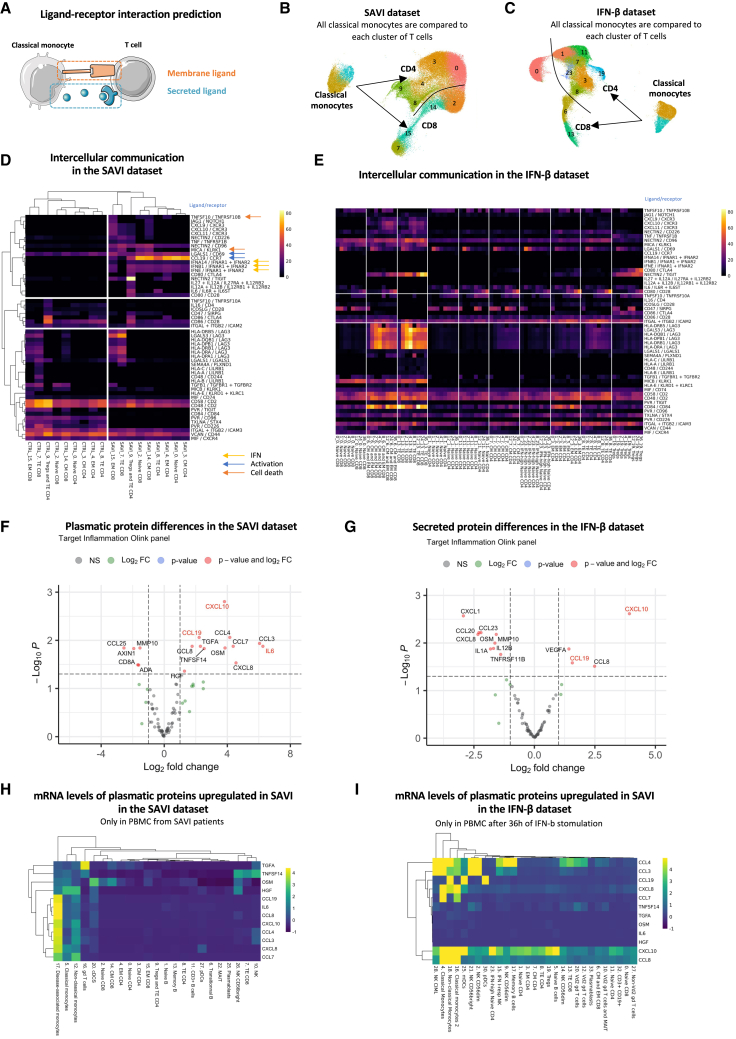
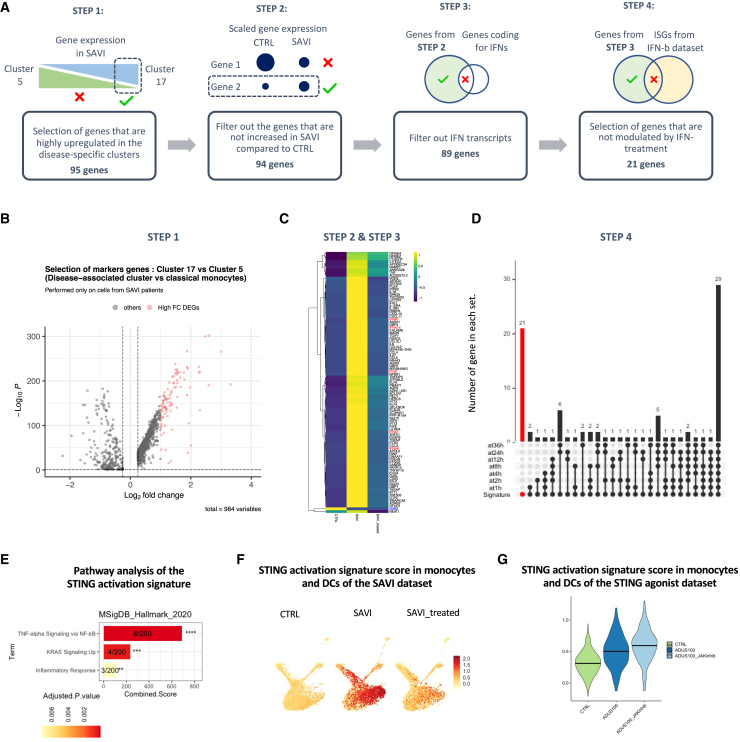
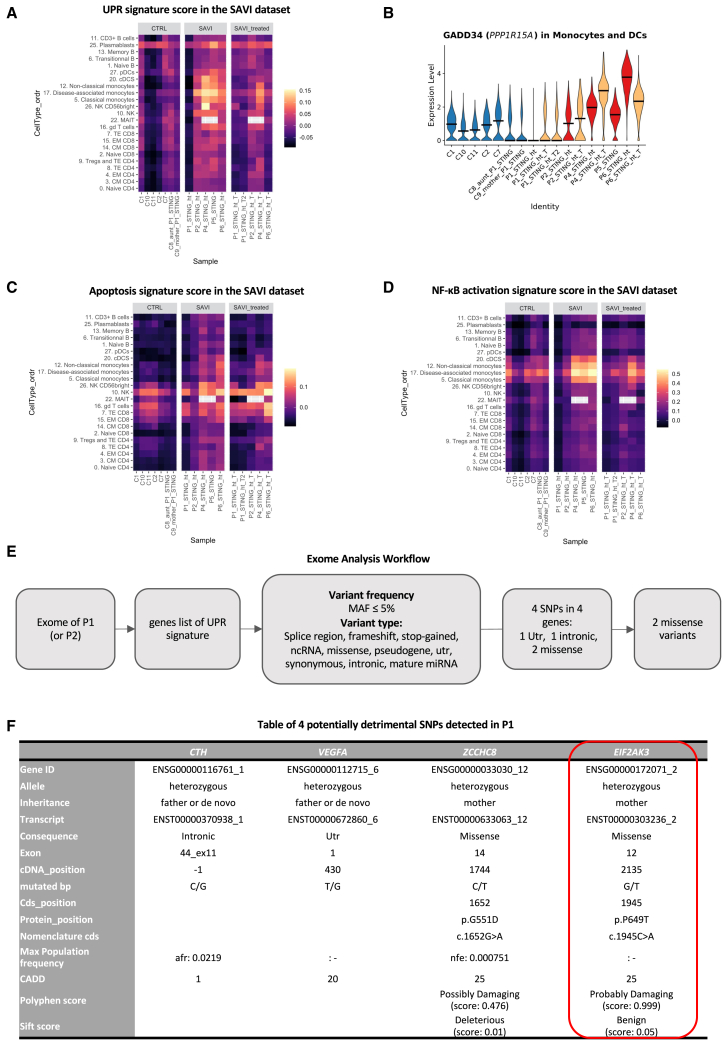
Gain-of-function mutations in stimulator of interferon gene 1 (STING1) result in STING-associated vasculopathy with onset in infancy (SAVI), a severe autoinflammatory disease. Although elevated type I interferon (IFN) production is thought to be the leading cause of the symptoms observed in patients, STING can induce a set of pathways, which have roles in the onset and severity of SAVI and remain to be elucidated. To this end, we performed a multi-omics comparative analysis of peripheral blood mononuclear cells (PBMCs) and plasma from SAVI patients and healthy controls, combined with a dataset of healthy PBMCs treated with IFN-β. Our data reveal a subset of disease-associated monocyte, expressing elevated CCL3, CCL4, and IL-6, as well as a strong integrated stress response, which we suggest is the result of direct PERK activation by STING. Cell-to-cell communication inference indicates that these monocytes lead to T cell early activation, resulting in their senescence and apoptosis. Last, we propose a transcriptomic signature of STING activation, independent of type I IFN response.

Keywords: SAVI; STING; integrated stress response; scRNA-seq; type I interferon; unfolded protein response.


Conflict of interest statement

Declaration of interests C.C., F.R.L., and M.M.M. are listed as inventors on a patent application related to this article (European Patent Application no. PCT/FR2023/050433, entitled “A gene signature for diagnosing stimulator of interferon genes (STING)-associated vasculopathy with onset in infancy (SAVI)”). F.R.L. and M.M.M. received grants from Sanofi (iAward Europe and research collaboration contract). C.C., L.D., M.D., F.A., G.B., J.C.G., and A.R. are or were employees of Sanofi and may hold shares and/or stock options in the company.

Figures

None
Graphical abstract
Figure 1
Figure 1
A scRNA-seq cohort of PBMCs from five SAVI patients shows loss of effector cells not replicated by challenging healthy PBMCs with IFN-β (A) Description of the SAVI dataset: five SAVI patients, with three different STING mutations sampled before (SAVI) and under JAK inhibitor treatment (SAVI_treated), and seven healthy donors (CTRLs). Ruxo, ruxolitinib; Tofa, tofacitinib; yo, years old. (B) Description of the IFN-β dataset. (C) UMAP and cell type assignment of all 112,060 cells from the SAVI dataset (top) dataset separated by group (bottom). (D) UMAP and cell type assignment of all 115,503 cells from the IFN-β dataset (top) and separated by time of IFN-β stimulation (bottom). (E) Boxplot of the proportion of PBMCs found in several clusters of the SAVI dataset. p values are calculated by the Kruskal-Wallis test for multiple comparisons, followed by a post hoc Dunn’s test. ∗p < 0.05, ∗∗p < 0.01, ∗∗∗p < 0.001. (F) Evolution of the proportion of PBMCs found in several clusters in the IFN-β dataset. (C and D) nCD4, naive CD4; eCD4, effector CD4; nCD8, naive CD8; eCD8, effector CD8.
Figure 2
Figure 2
Type I IFN and NF-κB signature scores are elevated in SAVI patients (A and B) Signature score of the type I IFN response in (A) the SAVI dataset and (B) the IFN-β dataset (nCD4, naive CD4; eCD4, effector CD4; nCD8, naive CD8; eCD8, effector CD8; γδ, γδ T cells). (C and D) Violin plot of the signature score of NF-κB activation in (C) the SAVI dataset and (D) the IFN-β dataset (dark lines indicate medians). (E and F) Heatmap of the pathway enrichment analysis (E) between SAVI and CTRL and (F) between healthy PBMCs stimulated with IFN-β for 36 h and unstimulated PBMCs. Dots indicate non-significant pathways (Bonferroni-Hochberg corrected p values >0.05). Side color bar indicate groups of pathways based on broader functions.
Figure 3
Figure 3
T cells of SAVI have impaired signature score of trafficking machinery, and naive cells have increased activation markers and senescence signature score (A) Heatmap of the pathway enrichment analysis between SAVI and CTRL. Dots indicate non-significant pathways (Bonferroni-Hochberg corrected p values > 0.05). Side color bar indicate groups of pathways based on broader functions. (B and C) Heatmaps of a lymphocyte trafficking signature in T cells of (B) the SAVI dataset and (C) the IFN-β dataset. (D and E) Feature plots of CD69 mRNA expression level in T cells in (D) the SAVI dataset and (E) the IFN-β dataset. nCD4, naive CD4; eCD4, effector CD4; nCD8, naive CD8; eCD8, effector CD8. (F and G) T cell activation signature score in T cells of (F) the SAVI dataset and (G) the IFN-β dataset over the time course of IFN-β stimulation. (H and I) Senescence signature score in T cells of (H) the SAVI dataset and (I) the IFN-β dataset over the time course of IFN-β stimulation. (J and K) Apoptosis signature score in (J) the SAVI dataset and (K) the IFN-β dataset over the time course of IFN-β stimulation. (J and F) Dark lines indicate medians. (G–I and K) Each dot is the average score of the signature for a sample.
Figure 4
Figure 4
SAVI patients present a disease-associated cluster of monocytes characterized by elevated type I IFN response, NF-κB activation, and ISR (A) UMAP of the monocytes and DCs in the SAVI dataset, separated by groups. Black circle indicates cluster 17 (disease-associated monocytes). (B) Composition of monocyte and DC clusters in the SAVI dataset. (C) Violin plots of the signature score of type I IFN response (top) and of NF-κB activation (bottom) in the SAVI dataset. (D) Dot plot of the expression levels of all type I and type III IFNs, in each monocyte and DC clusters, in the SAVI group. (E) Volcano plot of the differentially expressed gene (DEGs) between the cells from SAVI patients in cluster 17 (disease-associated monocytes) and cluster 5 (classical monocytes). (F) Pathway enrichment analysis between cells from SAVI patients in cluster 17 (disease-associated monocytes) and cluster 5 (classical monocytes). Side color bar indicate groups of pathways based on broader functions. (G) Violin plot of the expression of PPP1R15A which codes for GADD34 (top) and a UPR signature of 85 genes (bottom) in the SAVI dataset. (C and G) Dark lines indicate medians.
Figure 5
Figure 5
Cell-to-cell communication inference indicate that hyperinflammatory monocytes of SAVI drive activation and death of T cells through cytokine secretion (A–C) (A) Cell-to-cell communications are inferred from the expression of ligands (secreted or presented at the membrane) expressed by a sender cell (here monocytes) and receptors expressed by a receiver cell (here, T cells). UMAP of the clusters involved in the inference in (B) the SAVI dataset and (C) the IFN-β dataset. (D) Heatmap of the score of each ligand/receptor pair between each T cell cluster and the monocytes, either in the SAVI or the CTRL group. Hierarchical clustering based on Pearson correlation. Colored arrows indicate association to specific pathways. (E) Heatmap of the score of the same ligand/receptor pair as observed in the SAVI dataset, between each T cell cluster and the monocytes, in each time point of the IFN-β dataset. (F) Volcano plot of the differential protein secretion between SAVI patients and associated CTRL for 96 proteins measured from the plasma. Genes written in red are in agreement with cell-to-cell interaction predictions. (G) Volcano plot of the differential protein secretion between PBMCs stimulated with IFN-β for 36 h and unstimulated for 96 proteins measured from the supernatant using the Olink inflammation panel. Genes written in red are also increased in the plasma of SAVI. (H and I) Heatmaps of the scaled mRNA levels of the 12 proteins found upregulated in the blood of SAVI patients in (F), in (H) the SAVI patients, and (I) each cell type in cell treated with IFN-β for 36 h.
Figure 6
Figure 6
Design of a STING-activation signature, independent of type I IFN response, based on the transcriptome of the disease-associated monocytes (A) Workflow used for the extraction of an IFN-independent STING-activation signature. (B) Volcano plot of the differentially expressed genes between cluster 17 and cluster 5, in SAVI. The 95 genes highlighted in pink have log2FC > 1 and were selected as the basis of the STING activation signature. (C) Heatmap of the 95 genes of selected in (B), in the monocyte and DCs of CTRL, SAVI, and SAVI treated. Blue writing represents the genes whose expression is higher in CTRL than SAVI and are filtered out in step 2. Red writing represents the IFN transcripts that are filtered out in step 3. (D) Upset plot of the genes of the STING-activation signature. Red bar represents the genes uniquely found in the signature and not upregulated by IFN-β at any time point. These 21 genes are kept in the final STING activation signature. (E) Bar chart of pathways significantly enriched for the 21 genes of the STING activation signature in MSigDB_Hallmark_2020. ∗p < 0.05, ∗∗p < 0.01, ∗∗∗p < 0.001, ∗∗∗∗ p < 0.0001. Numbers indicate genes detected/total genes in the pathway. Color scale is proportional to adjusted p value. (F) Feature plot of the signature score of the STING activation signature in monocytes and DCs in the SAVI dataset. (G) Violin plot of the signature score of the STING activation signature in the monocytes and DCs in the ADUS100 dataset. Dark lines indicate medians.
Figure 7
Figure 7
Exome analysis of a patient with low UPR reveals another SNP in EIF2AK3 (A) Heatmap of a UPR signature in the SAVI dataset. (B) Violin plot of PPP1R15A expression (encoding GADD34) in monocytes and DCs of the SAVI dataset. Dark lines indicate medians. (C) Heatmap of an apoptosis signature in the SAVI dataset. (D) Heatmap of an NF-κB activation signature in the SAVI dataset. (E) Workflow of the exome analysis based on the 85 genes of the UPR signature. MAF, major allele frequency. (F) Table of the four SNPs found in P1. (A, C, and D) Gray squares indicate clusters not found in a sample.

References

    1. Jeremiah N., Neven B., Gentili M., Callebaut I., Maschalidi S., Stolzenberg M.-C., Goudin N., Frémond M.L., Nitschke P., Molina T.J., et al. Inherited STING-activating mutation underlies a familial inflammatory syndrome with lupus-like manifestations. J. Clin. Invest. 2014;124:5516–5520. - PMC - PubMed
    1. Liu Y., Jesus A.A., Marrero B., Yang D., Ramsey S.E., Sanchez G.A.M., Tenbrock K., Wittkowski H., Jones O.Y., Kuehn H.S., et al. Activated STING in a Vascular and Pulmonary Syndrome. N. Engl. J. Med. 2014;371:507–518. - PMC - PubMed
    1. Frémond M.L., Hadchouel A., Berteloot L., Melki I., Bresson V., Barnabei L., Jeremiah N., Belot A., Bondet V., Brocq O., et al. Overview of STING-Associated Vasculopathy with Onset in Infancy (SAVI) Among 21 Patients. J. Allergy Clin. Immunol. Pract. 2021;9:803–818.e11. - PubMed
    1. David C., Frémond M.L. Lung Inflammation in STING-Associated Vasculopathy with Onset in Infancy (SAVI) Cells. 2022;11:318. - PMC - PubMed
    1. Dobbs N., Burnaevskiy N., Chen D., Gonugunta V.K., Alto N.M., Yan N. STING Activation by Translocation from the ER Is Associated with Infection and Autoinflammatory Disease. Cell Host Microbe. 2015;18:157–168. - PMC - PubMed

Publication types