. 2023 Dec 19;4(12):101324.
doi: 10.1016/j.xcrm.2023.101324.

The anabolic response to protein ingestion during recovery from exercise has no upper limit in magnitude and duration in vivo in humans

Affiliations

The anabolic response to protein ingestion during recovery from exercise has no upper limit in magnitude and duration in vivo in humans

Jorn Trommelen et al. Cell Rep Med. .

Abstract

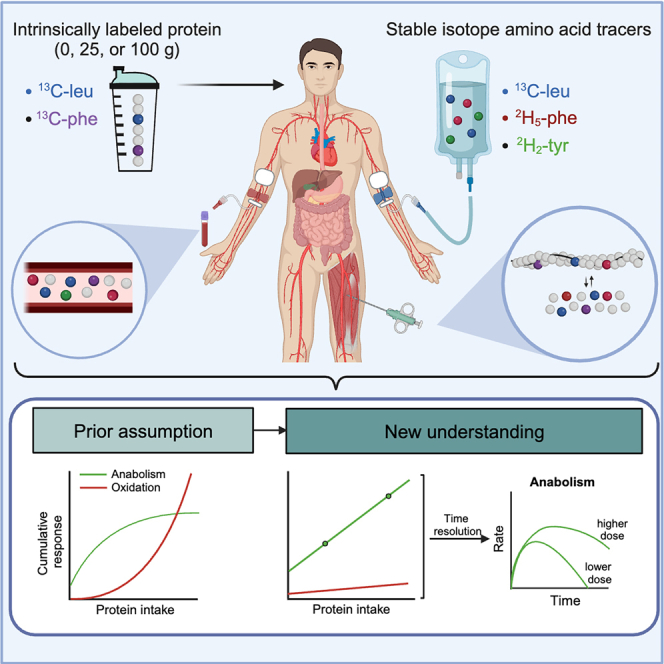
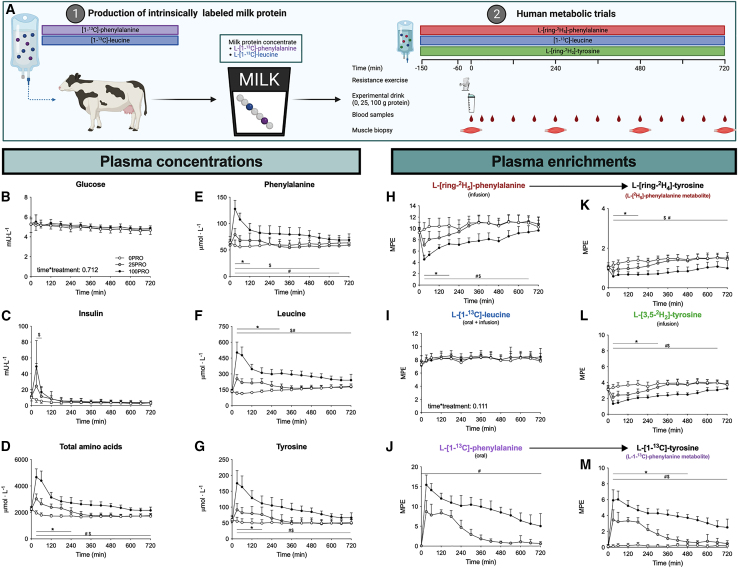
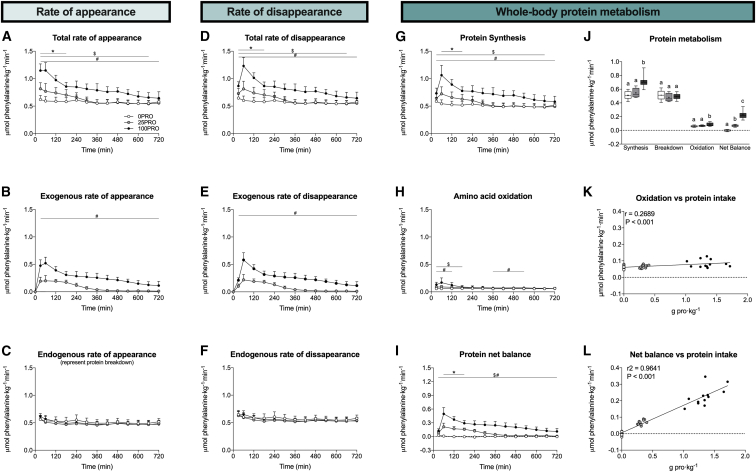
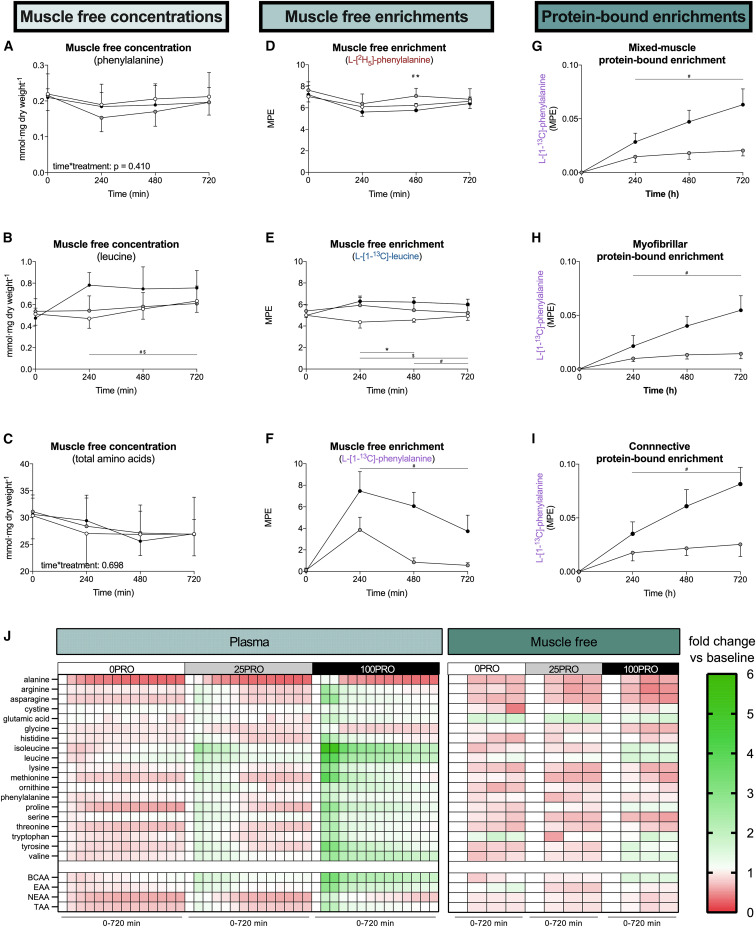
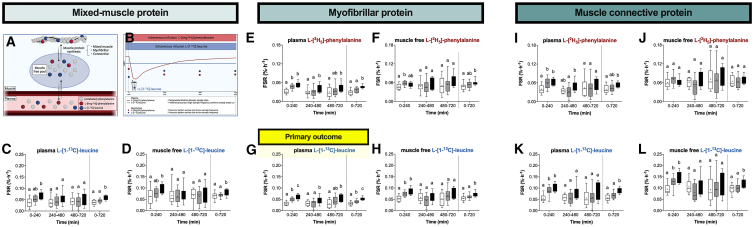
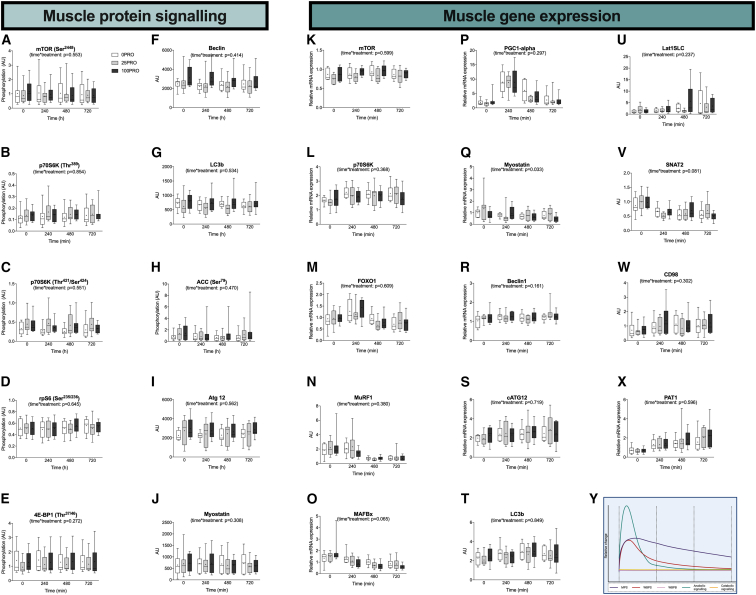
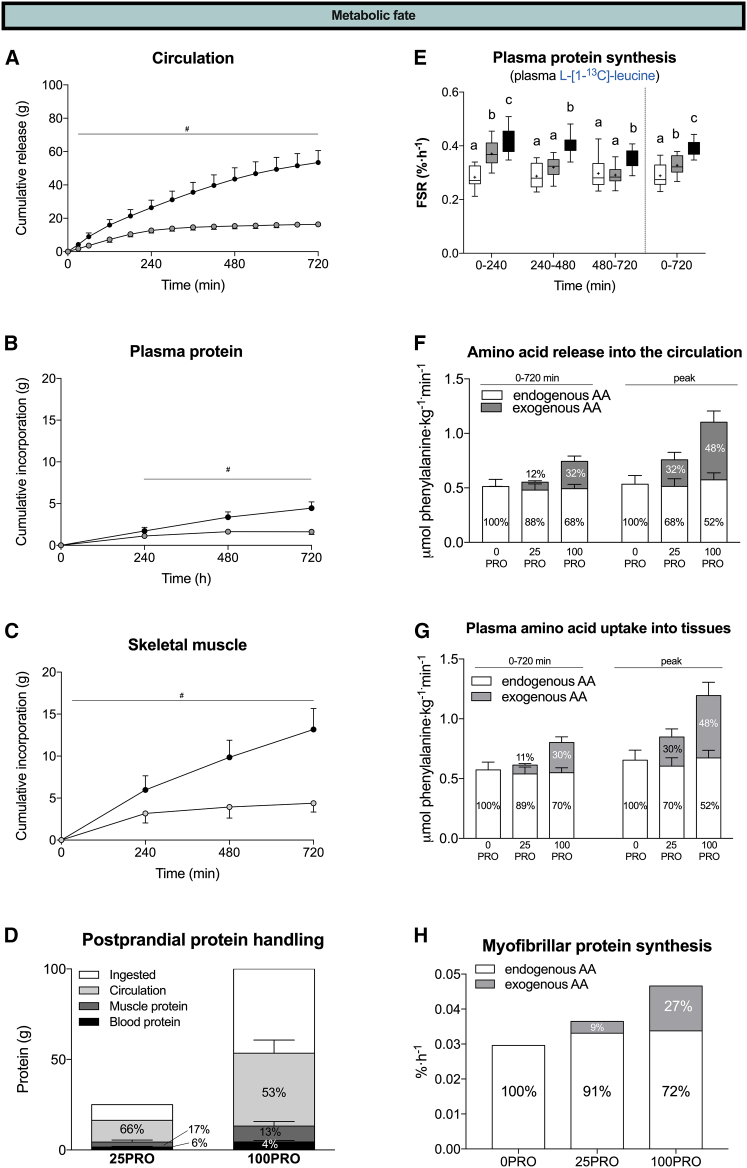
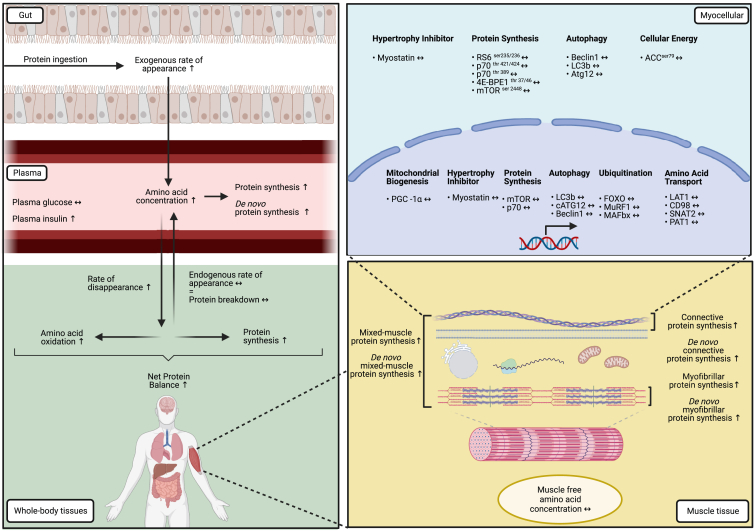
The belief that the anabolic response to feeding during postexercise recovery is transient and has an upper limit and that excess amino acids are being oxidized lacks scientific proof. Using a comprehensive quadruple isotope tracer feeding-infusion approach, we show that the ingestion of 100 g protein results in a greater and more prolonged (>12 h) anabolic response when compared to the ingestion of 25 g protein. We demonstrate a dose-response increase in dietary-protein-derived plasma amino acid availability and subsequent incorporation into muscle protein. Ingestion of a large bolus of protein further increases whole-body protein net balance, mixed-muscle, myofibrillar, muscle connective, and plasma protein synthesis rates. Protein ingestion has a negligible impact on whole-body protein breakdown rates or amino acid oxidation rates. These findings demonstrate that the magnitude and duration of the anabolic response to protein ingestion is not restricted and has previously been underestimated in vivo in humans.

Keywords: absorption; autophagy; bioavailability; de novo; digestion; intermittent fasting; mTOR; meal frequency; protein requirements; time-restricted feeding.


Conflict of interest statement

Declaration of interests G.A.A.v.L. is an employee of FrieslandCampina. The company had no role in funding, data collection and analysis, or preparation of the manuscript. See the following pages for a full overview of career funding for J.T. and L.J.C.v.L.: https://www.maastrichtuniversity.nl/j-trommelen and https://www.maastrichtuniversity.nl/ljc-van-loon.

Figures

None
Graphical abstract
Figure 1
Figure 1
Schematics of study design and plasma amino responses following protein ingestion (A) Experimental scheme. Production of intrinsically labeled protein followed by human tracer study in which subjects ingested 0, 25, or 100 g protein in a single bolus (0PRO, 25PRO, and 100PRO, respectively). (B–G) Plasma glucose (B), insulin (C), total amino acid (D), phenylalanine (E), leucine (F), and tyrosine (G) concentrations per treatment following test drink ingestion. (H–M) Plasma L-[ring-2H5]-phenylalanine (H), L-[1-13C]-leucine (I), L-1-[1-13C]-phenylalanine (J), L-[ring-2H4]-tyrosine (K), L-[3,5-2H2]-tyrosine (L), and L-[1-13C]-tyrosine (M) enrichments. Unless otherwise stated, time-dependent data were analyzed with a two-factor repeated-measures ANOVA with time as a within-subjects factor and treatment group as a between-subjects factor. Bonferroni post hoc analysis was performed whenever a significant F ratio was found to isolate specific differences. All values are means + SD. Statistical significance was set at p < 0.05. ∗: 25PRO significantly different from 0PRO; $: 100PRO significantly different from 0PRO; #: 100PRO significantly different from 25PRO. For all measurements, n = 12 biological replicates. Figure S1 displays the graphs of other individual amino acids. See also Figure S1 and Table S1.
Figure 2
Figure 2
Dose-dependent increases in plasma amino acid kinetics and whole-body protein metabolism following protein ingestion (A–C) Total (A), exogenous (B), and endogenous (C) rates of phenylalanine appearance. (D–F) Total (D), exogenous (E), and endogenous (F) rates of phenylalanine disappearance. (G–I) Whole-body protein synthesis (G), amino acid oxidation (H), and protein net balance (I) rates. (J) Average whole-body metabolism rates. (K) Correlation analysis of whole-body amino acid oxidation and protein intake relative to body mass. (L) Correlation analysis of whole-body protein net balance and protein intake relative to body mass. Unless otherwise stated, non-time-dependent data were analyzed with a one-way ANOVA with treatment group as a between-subjects factor. Bonferroni post hoc analysis were performed whenever a significant F ratio was found to isolate specific differences. (A–I) All values are means ± SD. Data in box and whiskers include the median (line), mean (cross), interquartile range (box), and minimum and maximum values (tails). Treatments without a common letter per time interval are significantly different. For all measurements, n = 12 biological replicates.
Figure 3
Figure 3
Changes in muscle free amino acid concentrations, enrichments, and exogenous amino acid incorporation into skeletal muscle (A–C) Muscle free phenylalanine (A), leucine (B), and total amino acid (C) concentrations. (D–F) Muscle free L-[2H5]-phenylalanine (D), L-[1-13C]-leucine (E), and (L-[1-13C]-phenylalanine) (F) enrichments. (G–I) Protein-bound L-[1-13C]-phenylalanine enrichments in mixed-muscle (G), myofibrillar (H), and muscle connective (I) protein. (J) Heatmap of plasma and muscle free amino acid concentration fold changes per treatment following test drink ingestion compared to baseline. All values are means ± SD. For all measurements, n = 12 biological replicates. See also Figure S2.
Figure 4
Figure 4
Prolonged increase in muscle protein synthesis rates following ingestion of a large amount of protein (A) Scheme demonstrating the various amino acid tracers, precursor pools, and muscle protein fractions. (B) Scheme demonstrating the expected time resolution of the various amino acid tracers and precursor pools. (C) Mixed-muscle protein synthesis (MPS) rates based on L-[1-13C]-leucine and the plasma precursor pool. (D) MPS rates based on L-[1-13C]-leucine and the muscle free precursor pool. (E) Myofibrillar protein synthesis (MyoPS) based on L-[2H5]-phenylalanine and the plasma precursor pool. (F) MyoPS based on L-[2H5]-phenylalanine and the muscle free precursor pool. (G) MyoPS based on L-[1-13C]-leucine and the plasma precursor pool (primary study outcome). (H) MyoPS based on L-[1-13C]-leucine and the muscle free precursor pool. (I) Muscle connective protein synthesis (ConnectivePS) based on L-[2H5]-phenylalanine and the plasma precursor pool. (J) ConnectivePS based on L-[2H5]-phenylalanine and the muscle free precursor pool. (K) ConnectivePS based on L-[1-13C]-leucine and the plasma precursor pool. (L) ConnectivePS based on L-[1-13C]-leucine and the muscle free precursor pool. Data in box and whiskers include the median (line), mean (cross), interquartile range (box), and minimum and maximum values (tails). For all measurements, n = 12 biological replicates.
Figure 5
Figure 5
Dissociation between feeding-induced muscle anabolic signaling and protein translation (A–J) Skeletal muscle phosphorylation status (ratio of phosphorylated to total protein) of mTOR (Ser2448) (A); p70S6K (Thr389) (B); p70S6K (Thr421/Ser424) (C); rpS6 (Ser235/Ser236) (D); 4E-BP1 (Thr37/Thr46) (E); and ACC (Ser79) (H) and protein content of Beclin (F), LC3b (G), Atg 12, (I), and myostatin (J) were all measured by the western blot technique. (K–X) Skeletal muscle relative mRNA expression (relative to 18S housekeeping gene) of mTOR (K), p70S6K (L), FOXO1 (M), MurF1 (N), MAFBx (O), PGC1-alpha (P), myostatin (Q), Beclin1 (R), cATG12 (S), LC3b (T), LAT1SLC (U), SNAT2 (V), CD98 (W), and PAT1 (X) were all measured by real-time qPCR quantification. (Y) Conceptual framework of the time course of the muscle protein synthetic, whole-body protein synthetic, whole-body protein breakdown, muscle anabolic signaling, and muscle catabolic signaling response to protein ingestion. Real-time qPCR data are n = 8 (0PRO), 9 (25PRO), and 9 (100PRO) biological replicates. Data in box and whiskers include the median (line), mean (cross), interquartile range (box), and minimum and maximum range (tails).
Figure 6
Figure 6
Isotope tracing reveals the dose- and time-dependent metabolic fate of ingested-protein-derived amino acids (A–C) Cumulative amount of ingested protein that is released into the circulation (A), incorporated into plasma protein (B), and incorporated into skeletal muscle (C). (D) Metabolic fate of ingested protein expressed in absolute and relative amounts. (E) Plasma protein synthesis rates based on L-[1-13C]-leucine and the plasma precursor pool. (F–H) Contribution of endogenous and exogenous rates to the total rate of appearance (F), rate of disappearance (G), and muscle protein synthesis rate (H). All values are means ± SD. For all measurements, n = 12 biological replicates.
Figure 7
Figure 7
Illustration of the postprandial protein handling Illustration of study results. Following protein ingestion, exogenous-protein-derived amino acids are released into the circulation, resulting in increased plasma amino acid concentrations. Subsequently, amino acids are taken up by tissues, resulting in an increase in whole-body protein synthesis and net balance, with negligible impact on amino acid oxidation. Protein ingestion does not expand the muscle free amino acid pool but stimulates (de novo) muscle protein synthesis rates. Postprandial myocellular protein signaling and gene expression become dissociated from the sustained postprandial increase in muscle protein synthesis rates. The magnitude and duration of the metabolic responses are proportional to the ingested amount of protein. Arrows are based on the statistical significance of the current study with n = 12 biological replicates for all measurements with the exception of the real-time qPCR data, which were n = 8 or 9.

References

    1. Phillips S.M., Tipton K.D., Aarsland A., Wolf S.E., Wolfe R.R. Mixed muscle protein synthesis and breakdown after resistance exercise in humans. Am. J. Physiol. 1997;273:E99–E107. - PubMed
    1. Biolo G., Tipton K.D., Klein S., Wolfe R.R. An abundant supply of amino acids enhances the metabolic effect of exercise on muscle protein. Am. J. Physiol. 1997;273:E122–E129. - PubMed
    1. Trommelen J., Betz M.W., van Loon L.J.C. The Muscle Protein Synthetic Response to Meal Ingestion Following Resistance-Type Exercise. Sports Med. 2019;49:185–197. - PubMed
    1. Groen B.B.L., Horstman A.M., Hamer H.M., de Haan M., van Kranenburg J., Bierau J., Poeze M., Wodzig W.K.W.H., Rasmussen B.B., van Loon L.J.C. Post-Prandial Protein Handling: You Are What You Just Ate. PLoS One. 2015;10 - PMC - PubMed
    1. Trommelen J., Holwerda A.M., Kouw I.W.K., Langer H., Halson S.L., Rollo I., Verdijk L.B., VAN Loon L.J.C. Resistance Exercise Augments Postprandial Overnight Muscle Protein Synthesis Rates. Med. Sci. Sports Exerc. 2016;48:2517–2525. - PubMed