. 2023 Dec 19;4(12):101328.
doi: 10.1016/j.xcrm.2023.101328.

Pan-viral serology uncovers distinct virome patterns as risk predictors of hepatocellular carcinoma and intrahepatic cholangiocarcinoma

Affiliations

Pan-viral serology uncovers distinct virome patterns as risk predictors of hepatocellular carcinoma and intrahepatic cholangiocarcinoma

Whitney L Do et al. Cell Rep Med. .

Abstract

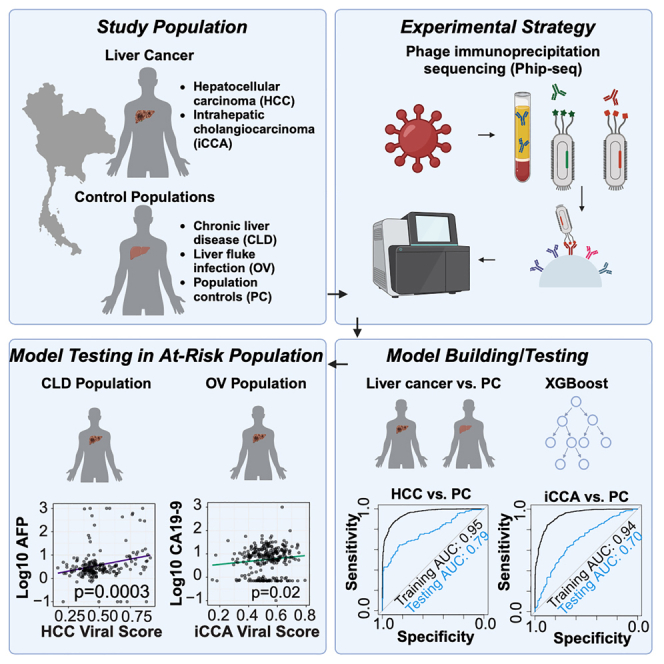
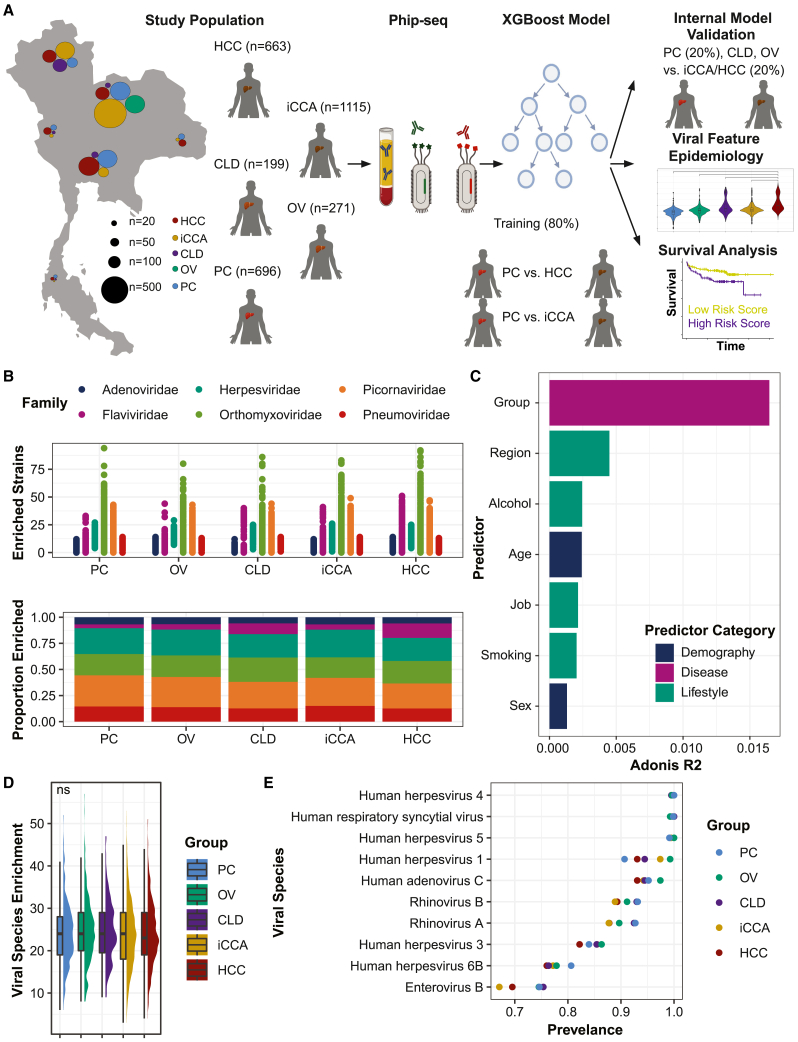
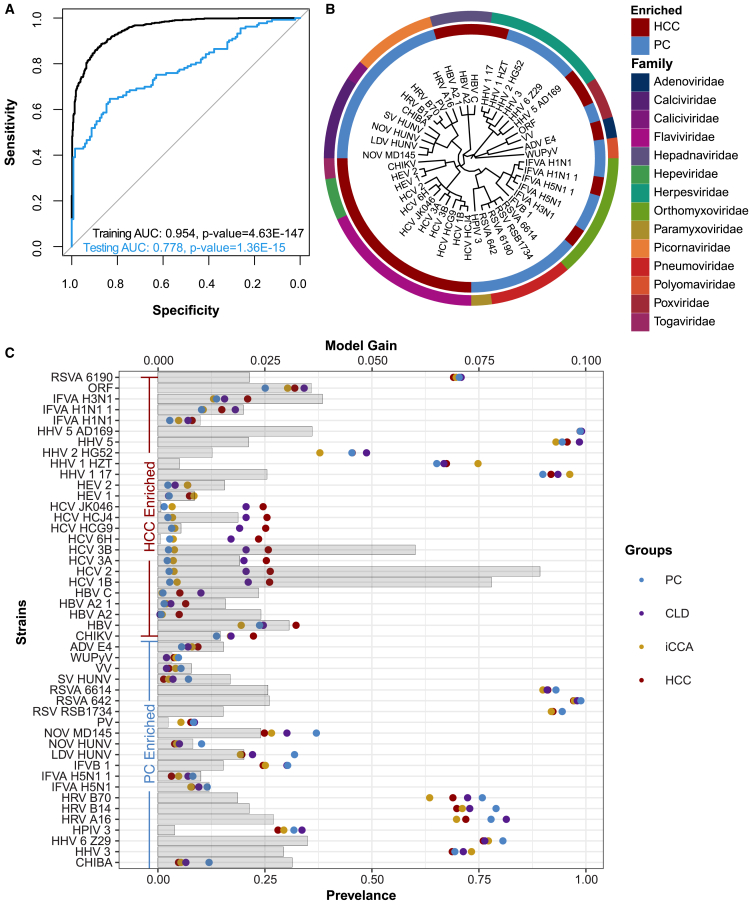
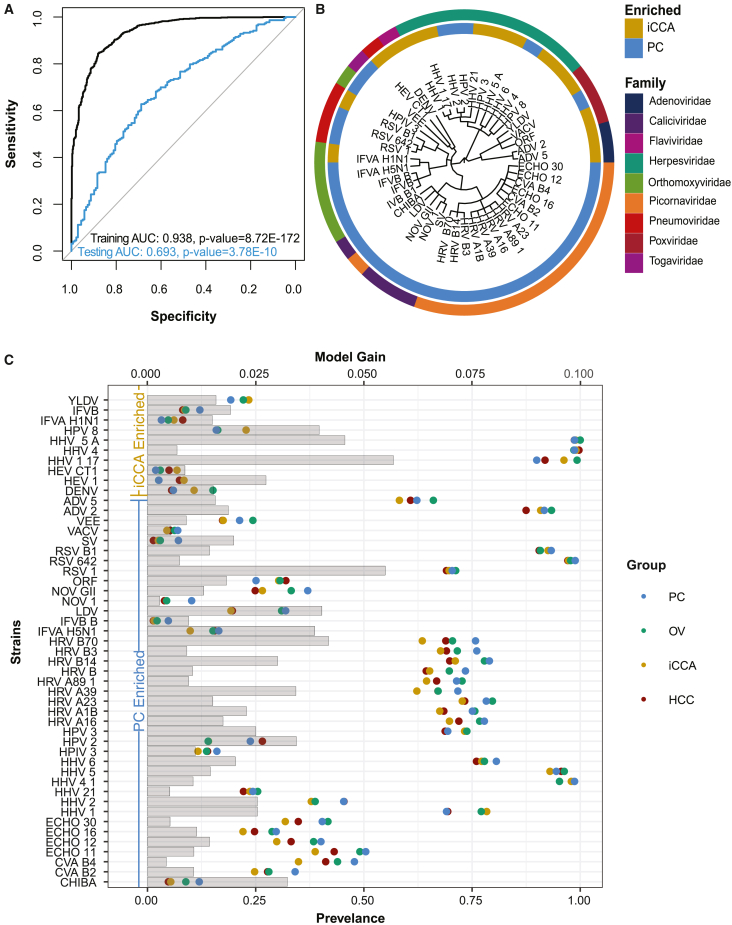
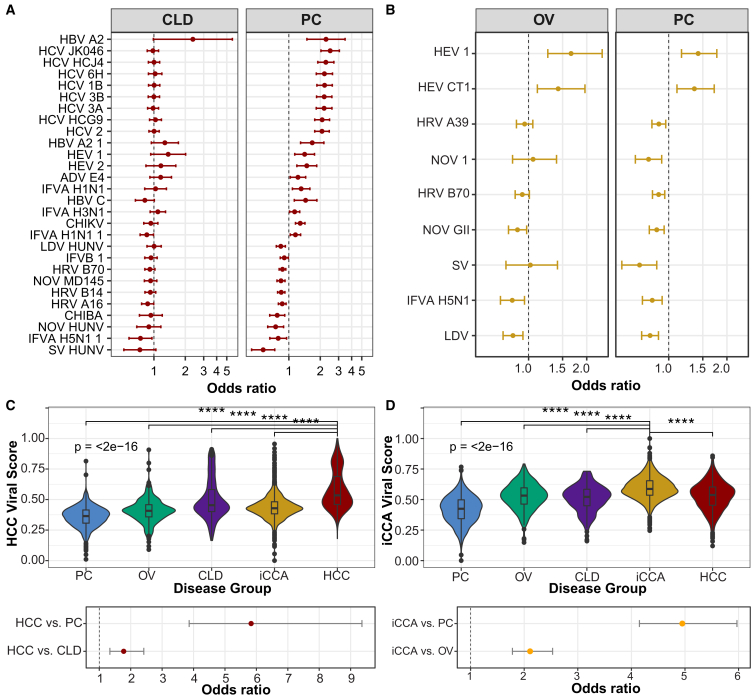
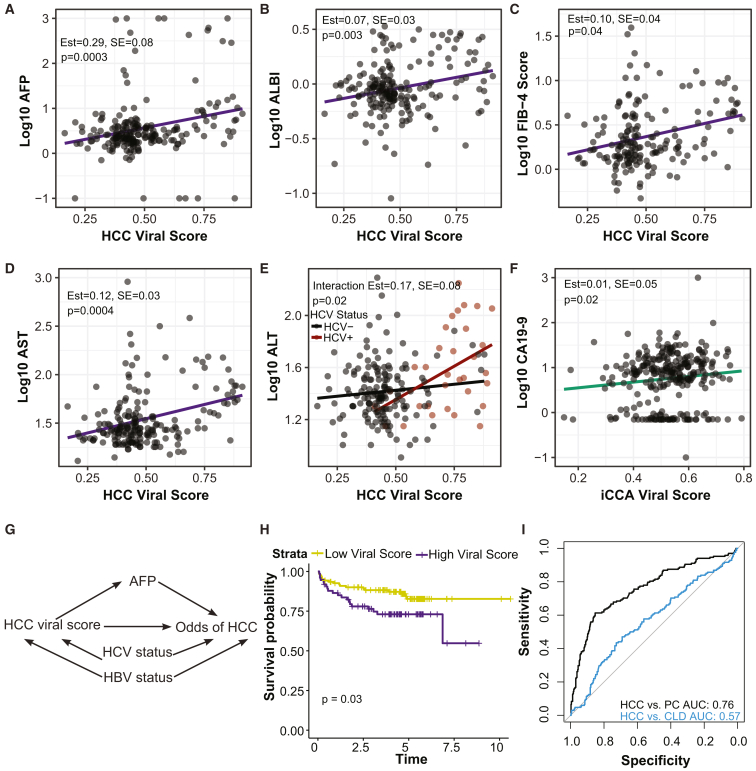
This study evaluates the pan-serological profiles of hepatocellular carcinoma (HCC) and intrahepatic cholangiocarcinoma (iCCA) compared to several diseased and non-diseased control populations to identify risk factors and biomarkers of liver cancer. We used phage immunoprecipitation sequencing, an anti-viral antibody screening method using a synthetic-phage-displayed human virome epitope library, to screen patient serum samples for exposure to over 1,280 strains of pathogenic and non-pathogenic viruses. Using machine learning methods to develop an HCC or iCCA viral score, we discovered that both viral scores were positively associated with several liver function markers in two separate at-risk populations independent of viral hepatitis status. The HCC score predicted all-cause mortality over 8 years in patients with chronic liver disease at risk of HCC, while the viral hepatitis status was not predictive of survival. These results suggest that non-hepatitis viral infections may contribute to HCC and iCCA development and could be biomarkers in at-risk populations.

Keywords: HCC; cholangiocarcinoma; hepatocellular carcinoma; iCCA; liver cancer; phage immunoprecipitation sequencing; phip-seq; serology; viral history; viruses.


Conflict of interest statement

Declaration of interests The authors declare no competing interests.

Figures

None
Graphical abstract
Figure 1
Figure 1
Disease status is the largest predictor of virome (A) Description of the study design. Created with BioRender.com. (B) Number of enriched strains and proportion enriched by group among the top six viral families represented in the cohort. Differential enrichment tested using analysis of variance between enriched strains and proportion enriched by group with adjustment for multiple comparisons using Tukey’s all-pair comparisons. (C) Partition of variation within virome examining lifestyle and biological factors calculated using permutational multivariate analysis of variance and reported by predictor category. Variables had an Adonis R2 FDR <0.05. (D) Average number of enriched species per participant by group. Differential enrichment examined using analysis of variance. (E) Prevalence of the top 10 enriched viral species by disease group. See also Figure S2 and Table S1.
Figure 2
Figure 2
HCC viral signatures can distinguish patients with HCC from control populations (A) Receiver operating characteristic (ROC) curve representing performance of XGBoost model in the training and test sets comparing HCC to PC populations. p value was calculated using methods from Mason and Graham. (B) Phylogenetic tree diagram of identified viral features from HCC model annotated by the group they are more highly enriched in. (C) HCC model viral features represented by prevalence within groups on the bottom x axis. The top x axis is shown by a bar plot of the XGBoost model gain of the viral strains in the HCC XGBoost model. See also Figure S3 and Table S2.
Figure 3
Figure 3
iCCA viral signatures can distinguish patients with iCCA from control populations (A) ROC curve representing performance of XGBoost model in the training and test sets comparing iCCA to PC populations. p value was calculated using methods from Mason and Graham. (B) Phylogenetic tree diagram of identified viral features from iCCA model annotated by the group they are more highly enriched in. (C) iCCA model viral features represented by prevalence within groups on the bottom x axis. The top x axis is shown by a bar plot of the XGBoost model gain of the viral strains in the iCCA XGBoost model. See also Figure S3 and Table S3.
Figure 4
Figure 4
Viral antibodies significantly differ between case and non-case groups (A and B) HCC (A) and iCCA (B) model features that significantly differed between cancer and PC, respectively. Logistic regression models tested differential enrichment of individual model viral features between HCC and iCCA and control populations, respectively, adjusting for biological and lifestyle confounding factors. Significance defined by FDR <0.05. The reference group is represented in the heading. (C and D) Distribution of HCC (C) and iCCA (D) viral scores by group, with differences tested using analysis of variance in top two panels. Logistic regression models individually tested HCC (C) and iCCA (D) viral scores between control populations after adjusting for biological and lifestyle confounders in bottom two panels. See also Tables S4, S5, S6, and S7.
Figure 5
Figure 5
HCC viral score associated with liver function and survival in CLD (A–E) Scatterplot showing association between HCC viral score and alpha-feto protein (AFP; A), albumin-bilirubin (ALBI) ratio (B), fibrosis-4 (FIB-4) score (C), aspartate transaminase (AST; D), and alanine transaminase (ALT; E) on the log10 scale. Linear regression models regressed HCC viral score on liver function markers adjusted for age, gender, smoking, and HBV and HCV status (A–D), with an interaction between HCC viral score and HCV status identified in the ALT model (E). (F) Scatterplot showing the association between the iCCA viral score and CA19-9 on the log10 scale. (G) Example representation of potential mediation identified via mediation analysis between HCC viral score, AFP, and odds of HCC compared to CLD. (H) Survival probability of all-cause mortality in CLD population by low versus high viral score in TIGER-LC population. (I) ROC curve representing performance of TIGER-LC HCC XGBoost model in the NCI-UMD cohort comparing HCC vs. PC and HCC vs. CLD. See also Figure S4 and Tables S8 and S9.

References

    1. Sung H., Ferlay J., Siegel R.L., Laversanne M., Soerjomataram I., Jemal A., Bray F. Global Cancer Statistics 2020: GLOBOCAN Estimates of Incidence and Mortality Worldwide for 36 Cancers in 185 Countries. CA. Cancer J. Clin. 2021;71:209–249. - PubMed
    1. Islami F., Goding Sauer A., Miller K.D., Siegel R.L., Fedewa S.A., Jacobs E.J., McCullough M.L., Patel A.V., Ma J., Soerjomataram I., et al. Proportion and number of cancer cases and deaths attributable to potentially modifiable risk factors in the United States. CA. Cancer J. Clin. 2018;68:31–54. - PubMed
    1. Yang J.D., Hainaut P., Gores G.J., Amadou A., Plymoth A., Roberts L.R. A global view of hepatocellular carcinoma: trends, risk, prevention and management. Nat. Rev. Gastroenterol. Hepatol. 2019;16:589–604. - PMC - PubMed
    1. Kansagara D., Papak J., Pasha A.S., O’Neil M., Freeman M., Relevo R., Quiñones A., Motu’apuaka M., Jou J.H. Screening for Hepatocellular Carcinoma in Chronic Liver Disease. Ann. Intern. Med. 2014;161:261–269. - PubMed
    1. Moon A.M., Weiss N.S., Beste L.A., Su F., Ho S.B., Jin G.Y., Lowy E., Berry K., Ioannou G.N. No Association Between Screening for Hepatocellular Carcinoma and Reduced Cancer-Related Mortality in Patients With Cirrhosis. Gastroenterology. 2018;155:1128–1139.e6. - PMC - PubMed

Publication types

MeSH terms