. 2023 Dec 19;4(12):101341.
doi: 10.1016/j.xcrm.2023.101341.

Potential therapeutic implications of histidine catabolism by the gut microbiota in NAFLD patients with morbid obesity

Affiliations

Potential therapeutic implications of histidine catabolism by the gut microbiota in NAFLD patients with morbid obesity

Sergio Quesada-Vázquez et al. Cell Rep Med. .

Abstract

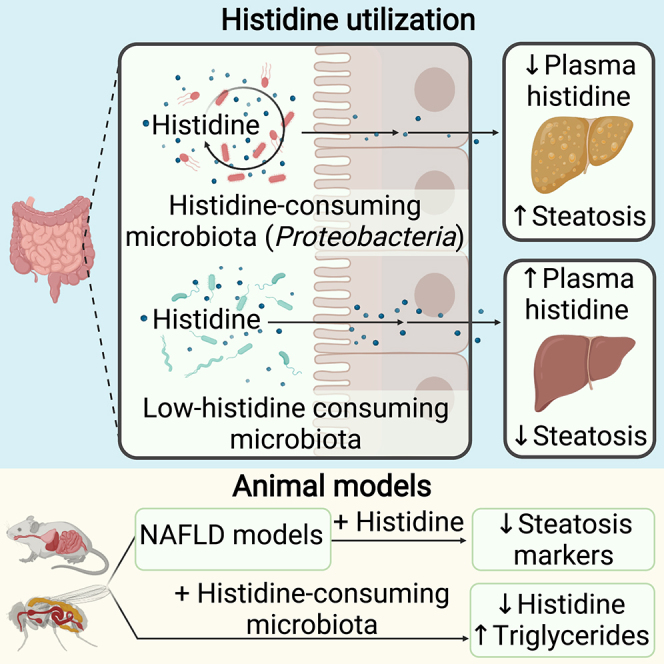
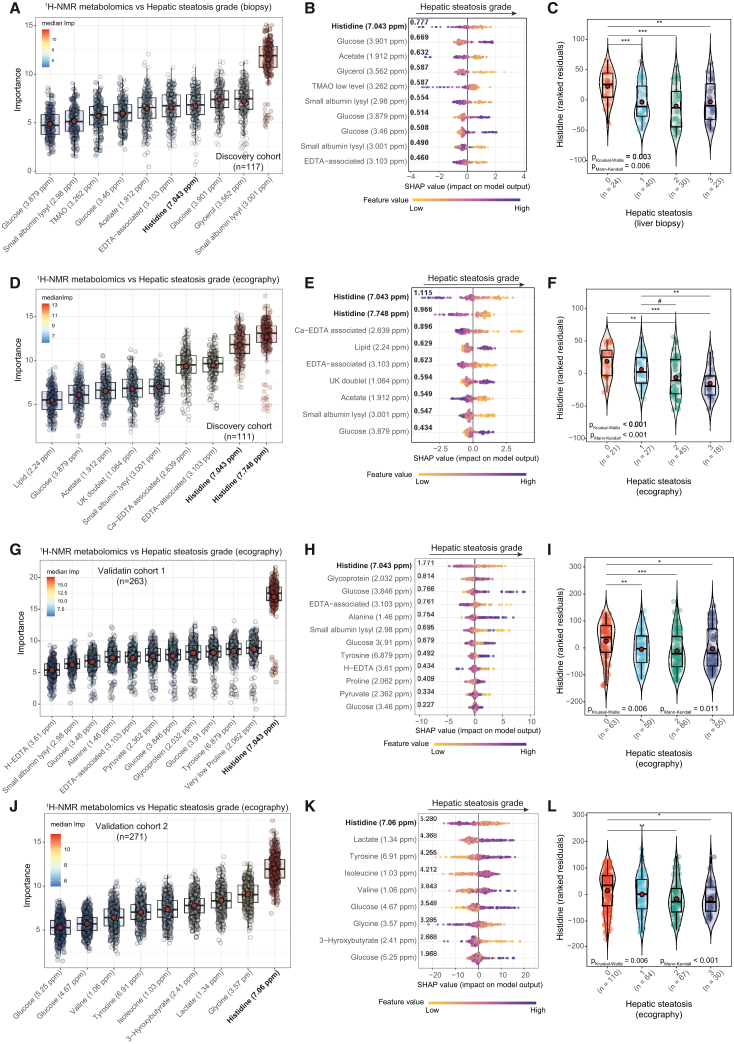
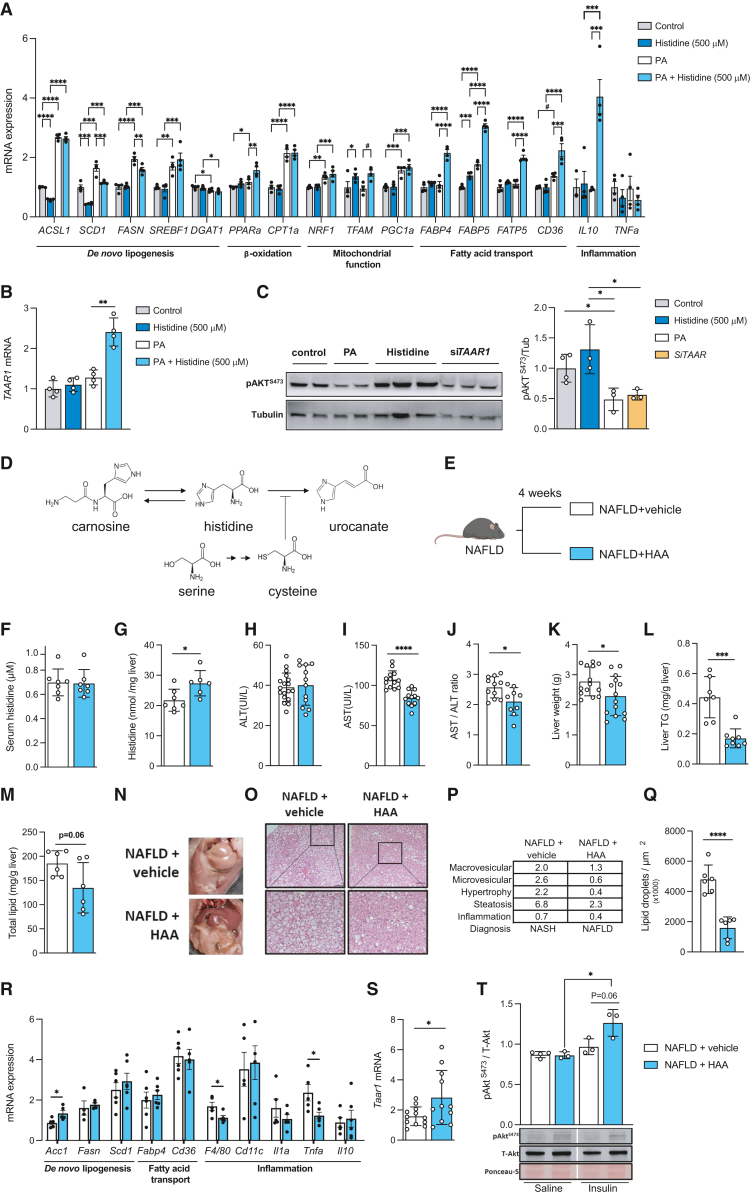
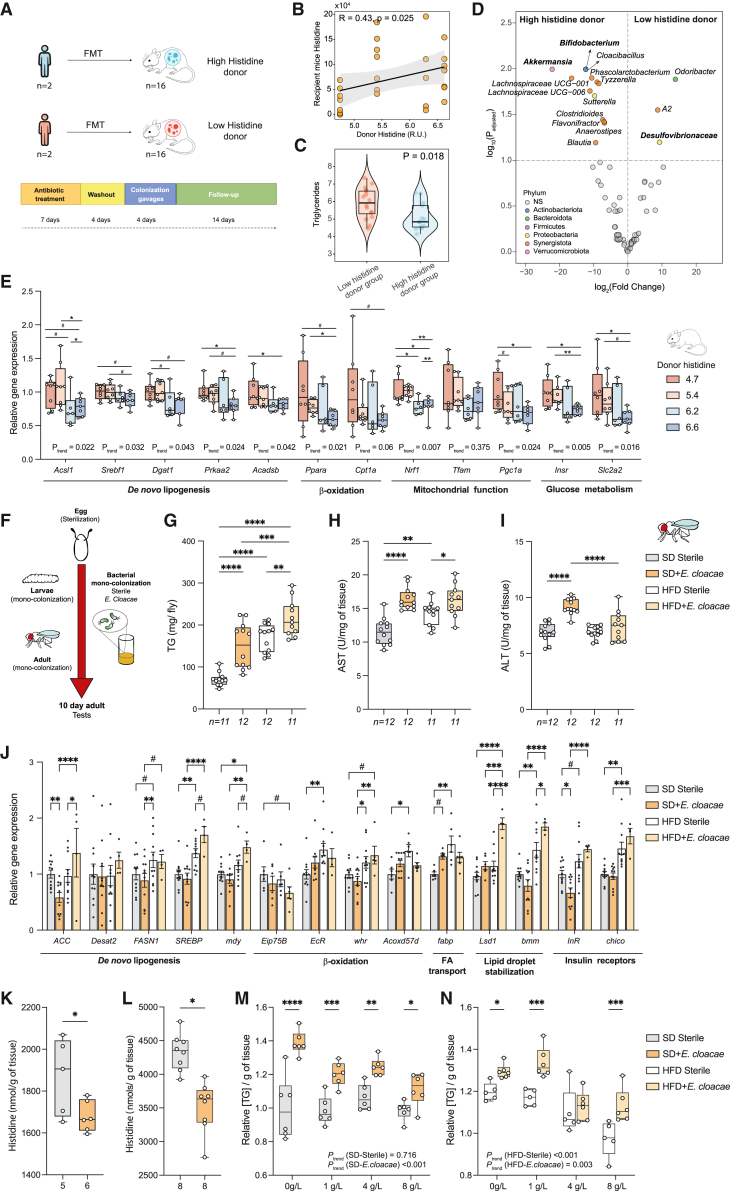
The gut microbiota contributes to the pathophysiology of non-alcoholic fatty liver disease (NAFLD). Histidine is a key energy source for the microbiota, scavenging it from the host. Its role in NAFLD is poorly known. Plasma metabolomics, liver transcriptomics, and fecal metagenomics were performed in three human cohorts coupled with hepatocyte, rodent, and Drosophila models. Machine learning analyses identified plasma histidine as being strongly inversely associated with steatosis and linked to a hepatic transcriptomic signature involved in insulin signaling, inflammation, and trace amine-associated receptor 1. Circulating histidine was inversely associated with Proteobacteria and positively with bacteria lacking the histidine utilization (Hut) system. Histidine supplementation improved NAFLD in different animal models (diet-induced NAFLD in mouse and flies, ob/ob mouse, and ovariectomized rats) and reduced de novo lipogenesis. Fecal microbiota transplantation (FMT) from low-histidine donors and mono-colonization of germ-free flies with Enterobacter cloacae increased triglyceride accumulation and reduced histidine content. The interplay among microbiota, histidine catabolism, and NAFLD opens therapeutic opportunities.

Keywords: Hut operon; NAFLD; Proteobacteria; amino acids; dysbiosis; hepatic disease; histidine; omics.


Conflict of interest statement

Declaration of interests The authors declare no competing interests.

Figures

None
Graphical abstract
Figure 1
Figure 1
Associations of the plasma metabolome with the steatosis grade (A, D, G, and J) Boxplots of the normalized permutated variable importance measure (VIM) for the metabolites associated with the liver steatosis grade after controlling for age, BMI, gender, and country in the discovery cohorts (n = 117, biopsy; n = 111, echography), validation cohort 1 (n = 263, echography), and validation cohort 2 (n = 271, echography), respectively. Metabolites were identified using the random forest-based ML variable selection algorithm Boruta using 2,000 trees, 500 iterations, and pBonferroni < 0.005. (B, E, H, and K) SHAP summary plot of the metabolites associated with the liver steatosis grade selected by the Boruta algorithm in the discovery (biopsy and echography), validation 1 (echography), and validation 2 (echography) cohorts, respectively. Each dot represents an individual sample. The x axis represents the SHAP value: the impact of a specific metabolite on the liver steatosis grade prediction of a specific individual. The overall importance for final prediction (average absolute SHAP values) is shown in bold. Colors represent the values of the metabolite normalized concentrations, ranging from yellow (low concentrations of the specific metabolite) to purple (high concentrations of the specific metabolite). (C, F, I, and L) Violin plots showing the ranked residuals (after adjusting for age, BMI, gender, and country) of plasma histidine levels according to the degree of steatosis assessed by liver biopsy in the discovery cohort (n = 117), liver echography in the discovery cohort (n = 111), liver echography in validation cohort 1 (n = 263), and liver echography in validation cohort 2 (n = 271), respectively. Statistical significance was assessed using both Kruskal-Wallis and Mann-Kendall trend tests, and between-group comparisons were assessed using the Wilcoxon test. #p < 0.1, ∗p < 0.05, ∗∗p < 0.01, ∗∗∗p < 0.001.
Figure 2
Figure 2
Associations of the liver transcriptome gene expression with the circulating histidine levels (A) Volcano plot of differentially expressed gene transcripts associated with the plasma histidine levels in the discovery cohort (n = 88), identified using robust linear regression controlling for age, BMI, gender, and country. The log2(FC) associated with a unit change in the plasma histidine levels and the −log10(p value) adjusted for multiple testing are plotted for each transcript. (B) Dot plot of the results of the Reactome-based over-representation analysis performed on active subnetworks grouped by hierarchical clustering. The x axis represents the fold enrichment defined as the ratio of the frequency of input genes annotated in a pathway to the frequency of all genes annotated to that pathway. The dot size indicates the number of differentially expressed genes in a given pathway. Dots are colored by the −log10(pFDR), with red indicating higher significance. (C) Enrichment map inter-related significant pathways identified using an active subnetwork-oriented approach. Each color displays a cluster of related pathways using a threshold for kappa statistics of 0.35. The size of the nodes corresponds to its −log10(pFDR). The thickness of the edges between nodes corresponds to the kappa statistic between the two nodes. (D) Gene concept network depicting significant genes involved in enriched pathways from selected clusters. The dot size of the pathways represents the −log10(pFDR). Pathways with the same color correspond to the same cluster.
Figure 3
Figure 3
Histidine supplementation modulates NAFLD in human primary hepatocytes and mice (A) mRNA expression of human primary hepatocyte genes treated with or without histidine (500 μM) and PA, involved in de novo lipogenesis (ACSL1, SCD1, FASN, SREBF1, and DGAT1), β-oxidation (PPARa and CPT1a), mitochondrial function (NRF1, TFAM, and PGC1a), fatty acid transport (FABP4, FABP5, FATP5, and CD36), and inflammation (IL10 and TNFa). (B) mRNA expression of TAAR1 in primary human hepatocytes treated with or without histidine (500 μM) and PA. (C) A representative western blot analysis with Akt activation (pAktS473), tubulin levels as housekeeping, and densitometry analysis of phosphorylated AktS473 and tubulin ratio in primary hepatocytes treated with PA or histidine (500 μM) or knockdown of TAAR1 expression. (D) Schematic of the histidine metabolism pathway. (E) Schematic of the animal model 1. after induction of NAFLD, animals were treated for 4- weeks with a combination of HAAs (histidine, serine, carnosine and cysteine). (F–M) Effects of histidine amino acids treatments on the animal model: (F) serum histidine levels; (G) hepatic histidine levels; (H) serum ALT; (I) serum AST; (J) AST/ALT ratio; (K) liver weight; (L) total hepatic TG content; and (M) total hepatic lipid content. (N) Representative macroscopic appearance of livers. (O) Hepatic histopathology with hematoxylin and eosin (H&E) staining (magnified area at the bottom). Scale bar, 100 μm). (P) NAFLD/NASH scoring table. st., steatosis. (Q) Lipid droplet count. (R) Hepatic mRNA expression of genes related to de novo lipogenesis (Acc1, Fasn, and Scd1), lipid transport (Cd36 and Fabp4), and inflammation (F4/80, Cd11c, Il1a, Tnfa, and Il10). (S) Hepatic mRNA expression of Taar1. (T) Top: representative analysis of Akt activation (pAktS473), total Akt protein levels (T-Akt), and protein loading with Ponceau-S membrane staining. Bottom: densitometry of pAktS473and total Akt ratio. Data are mean ± SEM. ∗p < 0.05, ∗∗p < 0.01, ∗∗∗p < 0.001, ∗∗∗∗p < 0.0001.
Figure 4
Figure 4
Histidine supplementation alleviates liver steatosis in different animal models (A‒F) Effects of HAA supplementation in the ob/ob mice model. (A) Representative macroscopic appearance of livers. (B) Representative liver micrographs of H&E staining. Scale bar, 100 μm. (C) Lipid droplet. Count. (D) Lipid droplet surface field. (E) Total hepatic lipid content. (F) Hepatic mRNA expression of genes related to de novo hepatic lipogenesis (Acc1, Fasn, and Scd1), lipid transport (Fabp4), and inflammation (F4/80, Cd11c, Il1a, Tnfa, and Il10). (G‒L) Effects of HAA supplementation in the OVX rat model. (G) Liver weight. (H) Representative liver micrographs of H&E staining. Scale bar, 100 μm. (I) Lipid droplet count. (J) Lipid droplet surface field. (K) Total hepatic lipid content. (L) Hepatic mRNA expression of genes related to de novo hepatic lipogenesis (Acc1, Fasn, and Scd1), lipolysis (Hsl), lipid transport (Fapt1 and Cd36), and inflammation (Mcp1, Il1b, Tnfa, and Il10). (M and N) Effects of histidine supplementation (8 g/L) in the NAFLD fly model. (M) Boxplots represent TG content per fly. TG levels were assessed in 10-day-old flies. (N) RT-qPCR results of genes related to de novo hepatic lipogenesis (ACC, Desat2, FASN1, SREBP, and mdy), β-oxidation (Eip75B, EcR, whr, and Acoxd57d), lipid transport (Fabp), fatty acid mobilization (Lsd1 and bmm), and insulin receptors (InR and chico). For all Drosophila experiments, samples contained a pool of 8 flies. Data are mean ± SEM. The p values were determined using Fisher’s least significant difference (LSD) ANOVA test (#p < 0.1, ∗p < 0.05, ∗∗p < 0.01, ∗∗∗p < 0.001, ∗∗∗∗p < 0.0001).
Figure 5
Figure 5
Associations of plasma histidine and steatosis degree with the gut microbiota and Hut genes (A and B) Volcano plots of differential bacterial families associated with (A) the circulating histidine levels and (B) hepatic steatosis in the discovery cohort (n = 73), identified using the analysis of microbiomes with bias correction (ANCOM-BC), controlling for age, BMI, gender, and country. The log2(FC) associated with a unit change in the plasma histidine levels and the −log10(p value) adjusted for multiple testing are plotted for each family. (C) Histidine utilization pathways. The first three pathways appear to be universal. There are two different degradation pathways for formiminoglutamate depending on the genera: hydrolyzation to formamide and glutamate or hydrolyzation to formylglutamate and subsequent hydrolyzation to formate and glutamate. (D‒G) Violin plots of the centered log ratio-transformed microbial genes involved in histidine utilization (hutH, hutU, hutI, and hutG, respectively) in subjects with a steatosis degree lower or higher than 33%. (H) Volcano plots of differential bacterial families associated with the hepatic steatosis degree (liver biopsy) in the animal supplementation study for the comparison of NAFLD+vehicle vs. NAFLD+HAA, identified using ANCOM-BC. The log2(FC) and the −log10(p value) adjusted for multiple testing are plotted for each taxon. Significantly different taxa are colored according to phylum. (I–K) Genus levels of (I) Roseburia and (J) Akkermansia and (K) qPCR of microbial genes expression involved in histidine utilization (hutH and hutG). ∗p < 0.05, ∗∗∗∗p < 0.0001. (K) Data are mean ± SEM.
Figure 6
Figure 6
Effects of FMT in mice and mono-colonization of flies with E. cloacae on NAFLD features and histidine (A) Schematic of FMT from patients with high and low plasma histidine levels to mice (2 human donors per group, 8 mice per human donor). (B) Spearman correlation between the plasma levels of histidine in the human donor and the recipient mice. (C) Recipient mouse hepatic TG content in the low- and high-histidine donor groups (Wilcoxon test). (D) Volcano plot of the recipient mouse microbiota for the comparison between high-histidine donor vs. low-histidine donor groups, identified using ANCOM-BC. The log2(FC) and the –log10(p value) adjusted for multiple testing are plotted for each taxon. Significantly different taxa are colored according to phylum. (E) Relative gene expression of hepatic genes involved in de novo lipogenesis (Acsl1, Srebf1, Dgat1, Prkaa2, and Acadsb), β-oxidation (Ppara and Cpt1a), mitochondrial function (Nfr1, Tfam, and Pgc1a), and glucose metabolism (Insr and Slc2a2). (F‒N) Effects of mono-colonization with E. cloacae in germ-free D. melanogaster. (F) Experimental scheme followed to generate wild-type Drosophila flies under sterile (germ-free) or mono-colonization conditions. After egg sterilization, these were transferred to fly food supplemented E. cloacae or the vehicle for the flies that were left sterile. All tests were performed on day 10 of adulthood. (G) Boxplots represent TG content per fly. (H and I) Boxplots represent (H) ALT and (I) AST enzymatic activity in 10-day-old Drosophila flies. (J) RT-qPCR results. Bars represent relative gene expression of flies fed an SD and HFD and mono-colonized with E. cloacae or left sterile. Error bars represent SEM. (K and L) Boxplots represent the amount of L-histidine per gram of tissue, measured either by 1H NMR (K) or an ELISA kit (L) of sterile flies or flies mono-colonized with E. cloacae and supplemented with an SD. (M and N) Boxplots represent TG content per gram of tissue of sterile flies or flies mono-colonized with E. cloacae fed (M) an SD and (N) an HFD and supplemented with 0, 1, 4, or 8 g/L L-histidine. For all Drosophila experiments, samples contained a pool of 8 flies. Data are mean ± SEM. The p values were determined using Fisher’s LSD ANOVA test (#p < 0.1, ∗p < 0.05, ∗∗p < 0.01, ∗∗∗p < 0.001). ptrend was calculated using the non-parametric Mann-Kendall trend test.

References

    1. Mayneris-Perxachs J., Cardellini M., Hoyles L., Latorre J., Davato F., Moreno-Navarrete J.M., Arnoriaga-Rodríguez M., Serino M., Abbott J., Barton R.H., et al. Iron status influences non-alcoholic fatty liver disease in obesity through the gut microbiome. Microbiome. 2021;9:104. - PMC - PubMed
    1. Quesada-Vázquez S., Colom-Pellicer M., Navarro-Masip È., Aragonès G., del Bas J.M., Caimari A., Escoté X. Supplementation with a Specific Combination of Metabolic Cofactors Ameliorates Non-Alcoholic Fatty Liver Disease and, Hepatic Fibrosis, and Insulin Resistance in Mice. Nutrients. 2021;13:3532. - PMC - PubMed
    1. Lee D.-Y., Kim E.-H. Therapeutic Effects of Amino Acids in Liver Diseases: Current Studies and Future Perspectives. J. Cancer Prev. 2019;24:72–78. - PMC - PubMed
    1. Kasaoka S., Tsuboyama-Kasaoka N., Kawahara Y., Inoue S., Tsuji M., Ezaki O., Kato H., Tsuchiya T., Okuda H., Nakajima S. Histidine supplementation suppresses food intake and fat accumulation in rats. Nutrition. 2004;20:991–996. - PubMed
    1. Kennedy L., Hargrove L., Demieville J., Bailey J.M., Dar W., Polireddy K., Chen Q., Nevah Rubin M.I., Sybenga A., DeMorrow S., et al. Knockout of l-Histidine Decarboxylase Prevents Cholangiocyte Damage and Hepatic Fibrosis in Mice Subjected to High-Fat Diet Feeding via Disrupted Histamine/Leptin Signaling. Am. J. Pathol. 2018;188:600–615. - PMC - PubMed

Publication types