. 2024 Feb;15(1):306-318.
doi: 10.1002/jcsm.13405. Epub 2023 Dec 20.

Marked irregular myofiber shape is a hallmark of human skeletal muscle ageing and is reversed by heavy resistance training

Affiliations

Marked irregular myofiber shape is a hallmark of human skeletal muscle ageing and is reversed by heavy resistance training

Casper Soendenbroe et al. J Cachexia Sarcopenia Muscle. 2024 Feb.

Abstract

Background: Age-related loss of strength is disproportionally greater than the loss of mass, suggesting maladaptations in the neuro-myo-tendinous system. Myofibers are often misshaped in aged and diseased muscle, but systematic analyses of large sample sets are lacking. Our aim was to investigate myofiber shape in relation to age, exercise, myofiber type, species and sex.

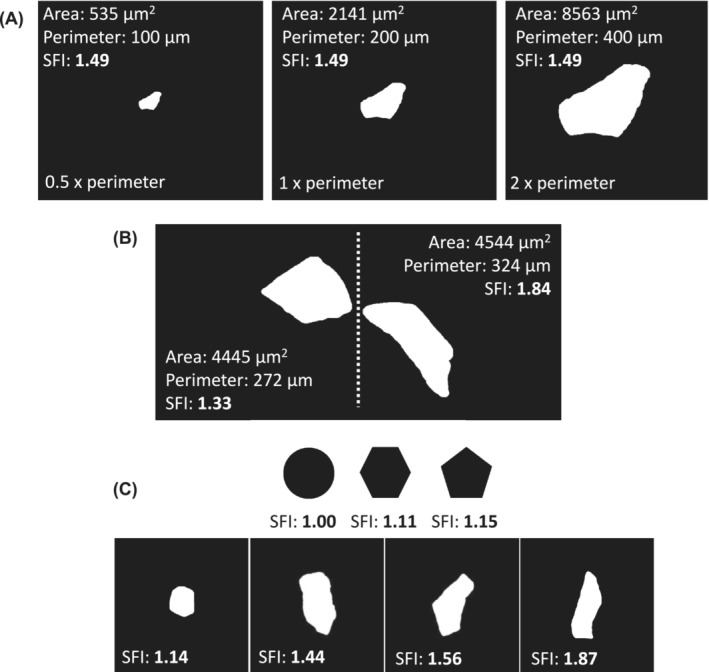
Methods: Vastus lateralis muscle biopsies (n = 265) from 197 males and females, covering an age span of 20-97 years, were examined. The gastrocnemius and soleus muscles of 11 + 22-month-old male C57BL/6 mice were also examined. Immunofluorescence and ATPase stainings of muscle cross-sections were used to measure myofiber cross-sectional area (CSA) and perimeter. From these, a shape factor index (SFI) was calculated in a fibre-type-specific manner (type I/II in humans; type I/IIa/IIx/IIb in mice), with higher values indicating increased deformity. Heavy resistance training (RT) was performed three times per week for 3-4 months by a subgroup (n = 59). Correlation analyses were performed comparing SFI and CSA with age, muscle mass, maximal voluntary contraction (MVC), rate of force development and specific force (MVC/muscle mass).

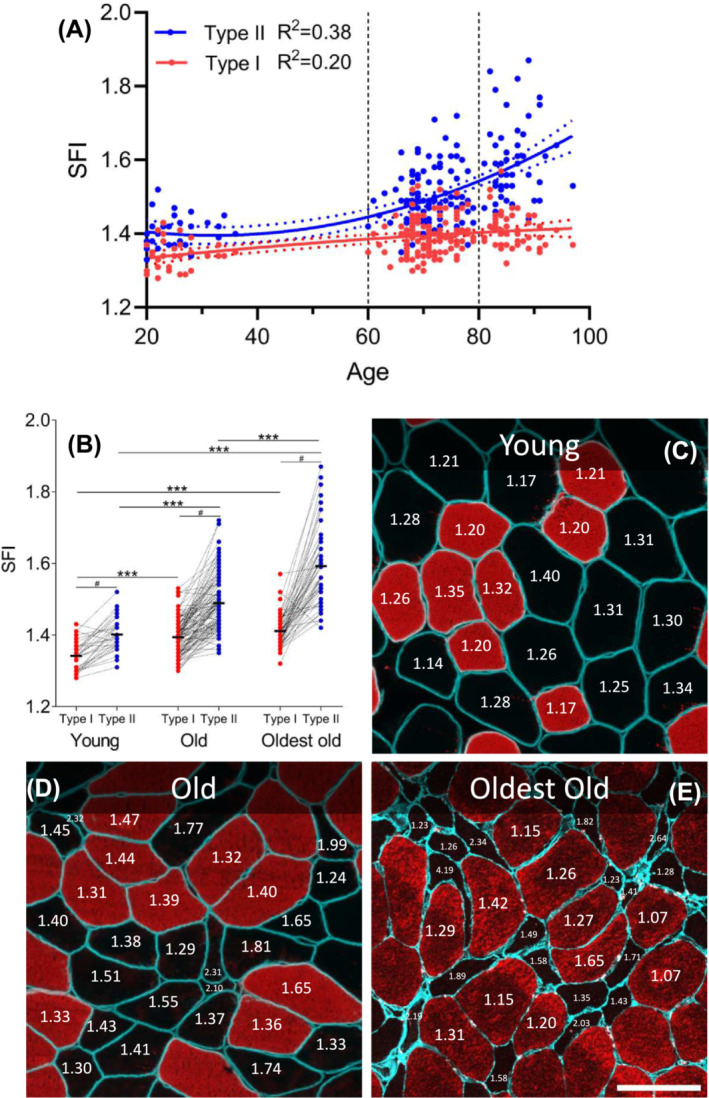
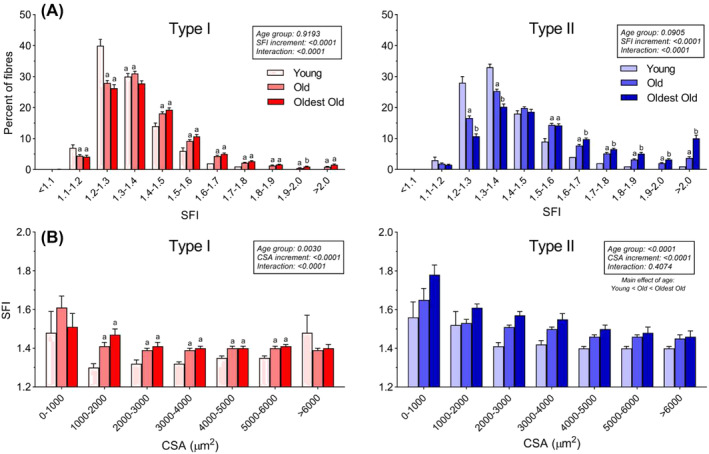
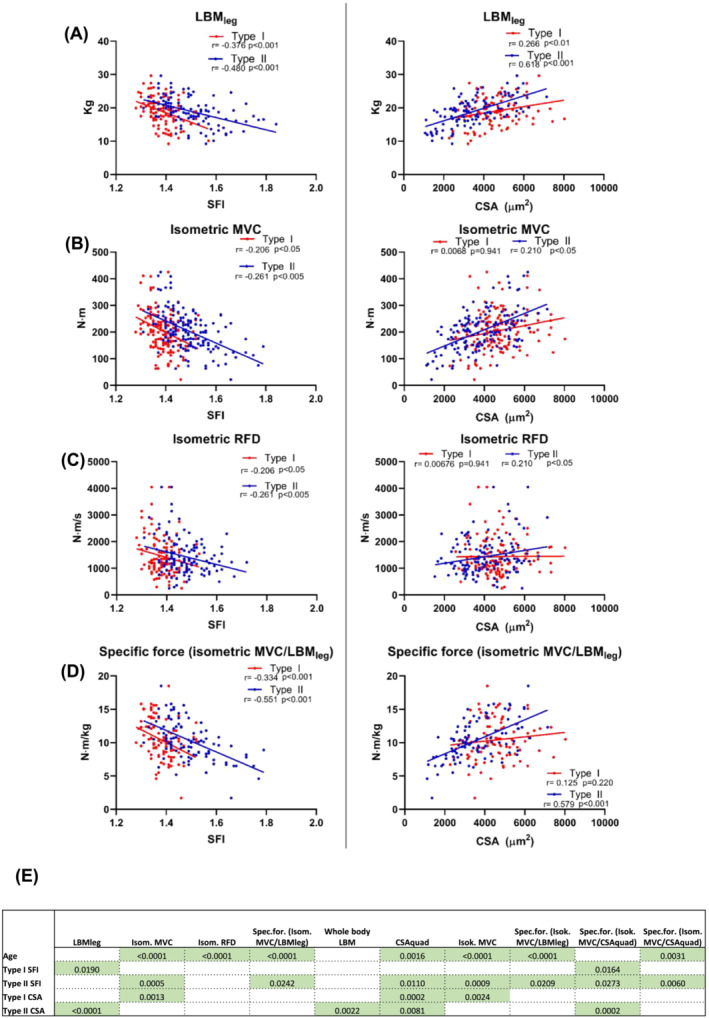
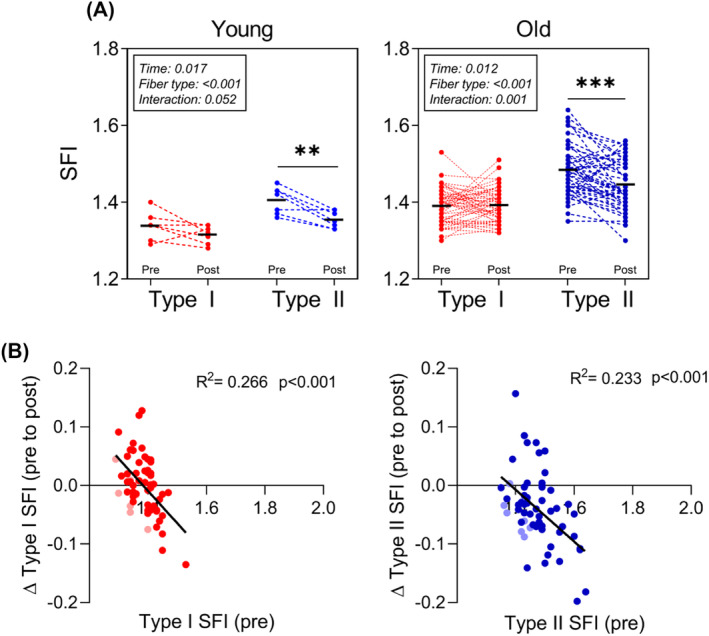
Results: In human muscle, SFI was positively correlated with age for both type I (R2 = 0.20) and II (R2 = 0.38) myofibers. When subjects were separated into age cohorts, SFI was lower for type I (4%, P < 0.001) and II (6%, P < 0.001) myofibers in young (20-36) compared with old (60-80) and higher for type I (5%, P < 0.05) and II (14%, P < 0.001) myofibers in the oldest old (>80) compared with old. The increased SFI in old muscle was observed in myofibers of all sizes. Within all three age cohorts, type II myofiber SFI was higher than that for type I myofiber (4-13%, P < 0.001), which was also the case in mice muscles (8-9%, P < 0.001). Across age cohorts, there was no difference between males and females in SFI for either type I (P = 0.496/0.734) or II (P = 0.176/0.585) myofibers. Multiple linear regression revealed that SFI, after adjusting for age and myofiber CSA, has independent explanatory power for 8/10 indices of muscle mass and function. RT reduced SFI of type II myofibers in both young and old (3-4%, P < 0.001).

Conclusions: Here, we identify type I and II myofiber shape in humans as a hallmark of muscle ageing that independently predicts volumetric and functional assessments of muscle health. RT reverts the shape of type II myofibers, suggesting that a lack of myofiber recruitment might lead to myofiber deformity.

Keywords: myofiber morphology; physiological function; sarcopenia; shape factor; skeletal muscle.


Conflict of interest statement

No conflicts of interest, financial or otherwise, are declared by the authors.

Figures

Figure 1
Figure 1
Shape factor index (SFI) overview. (A) SFI is a dimensionless descriptor of shape, as shown with the same myofiber in three different sizes. (B) High SFI values indicate increased deviation from a circle, as illustrated by two fibres with similar cross‐sectional area but different shapes. (C) SFI values for a circle and four myofibers of different shapes. The area and perimeter values are from actual measurements of myofibers on cryosections.
Figure 2
Figure 2
Myofiber shape factor index (SFI) increases with ageing and in type II fibres. (A) Association between age and type I (red, P < 0.001) and II (blue, P < 0.001) myofiber SFI was determined by second‐order polynomial regression (solid line). Horizontal dashed lines indicate arbitrary separation into three age cohorts: young (n = 34), old (n = 111) and oldest old (n = 52). (B) Type I and II myofiber SFI for young, old and oldest old displayed as means, with connected individual values. Each data point represents one individual. Data were analysed using two‐way repeated measures analysis of variance (age group × fibre type), with significant main effects (P < 0.001) and interactions (P < 0.001). *** indicates effect of age group, P < 0.001. # indicates effect of fibre type, P < 0.001. (C–E) Representative examples of muscle biopsy cross‐sections from young (C), old (D) and oldest old (E), stained for dystrophin (C, D, cyan), laminin (E, cyan) and myosin heavy chain type I (C–E, red). SFI values are provided for selected fibres. Scale bar = 100 μm.
Figure 3
Figure 3
Shape factor index (SFI) distribution. (A) Percentage of type I and II myofibers in 0.1 increments of SFI for young (n = 34), old (n = 111) and oldest old (n = 52). Data were analysed using two‐way repeated measures analysis of variance (age group × cross‐sectional area [CSA] increment), with main effects and interactions indicated in the figure. Results of the post hoc test are indicated by letters; bars that do not have the same letter are significantly different within the respective SFI increment (P < 0.05). (B) SFI of type I and II myofibers binned in 1000 μm2 CSA increments. Data are averages of all subjects within each age group and presented as means ± SEM. Data were analysed using mixed‐effects model (age group × CSA increment), with main effects and interactions indicated in the figure. Results of the post hoc test are indicated by letters; bars that do not have the same letter are significantly different within the respective CSA increment (P < 0.05). See Supporting Information S7 for details on the numbers of participants represented in each increment.
Figure 4
Figure 4
Linear correlation analyses between shape factor index (SFI) (left) and cross‐sectional area (CSA) (right) for type I and II myofibers with in vivo measures of muscle mass and function. Each data point represents one individual, ranging in age from 20 to 94 years, and all in the untrained state. Strength of association is indicated by r and P‐values. Correlations are displayed for (A) leg lean mass (LBMleg) (n = 108), (B) isometric (Isom.) maximal voluntary contraction (MVC) (n = 150), (C) isometric rate of force development (RFD) (n = 123) and (D) specific force (Spec.for.) (MVC/LBMleg) (n = 98). (E) P‐values of the model parameters that were significant independent predictors of 10 indices of muscle mass and function. Refer to Supporting Information S11 for full outline of the multiple linear regression analyses. Additional correlations can be found in Supporting Information S10. Isok., isokinetic.
Figure 5
Figure 5
Shape factor index (SFI) modification with resistance training (RT). (A) SFI for type I (red) and II (blue) myofibers before and after 3 or 4 months of RT. Data are presented for young (n = 7) and old (n = 52) and were analysed using two‐way repeated measures analysis of variance (time × fibre type) within each age group, with main effects and interactions indicated in the figure. **P < 0.01 post versus pre. ***P < 0.001 post versus pre. (B) Linear correlation analysis between SFI at baseline and changes following RT for type I (red) and II (blue) myofibers. Data are pooled young and old participants from A, and young is shown in faded colours. R 2 and P‐values are provided.

References

    1. Tomlinson BE, Walton JN, Rebeiz JJ. The effects of ageing and of cachexia upon skeletal muscle. A histopathological study. J Neurol Sci 1969;9:321–346. - PubMed
    1. Lexell J, Taylor CC, Sjöström M. What is the cause of the ageing atrophy? Total number, size and proportion of different fiber types studied in whole vastus lateralis muscle from 15‐ to 83‐year‐old men. J Neurol Sci 1988;84:275–294. - PubMed
    1. Soendenbroe C, Heisterberg MF, Schjerling P, Karlsen A, Kjaer M, Andersen JL, et al. Molecular indicators of denervation in aging human skeletal muscle. Muscle Nerve 2019;60:453–463. - PubMed
    1. Suetta C, Haddock B, Alcazar J, Noerst T, Hansen OM, Ludvig H, et al. The Copenhagen Sarcopenia Study: lean mass, strength, power, and physical function in a Danish cohort aged 20–93 years. J Cachexia Sarcopenia Muscle 2019;10:1316–1329. - PMC - PubMed
    1. Morley JE, Anker SD, von Haehling S. Prevalence, incidence, and clinical impact of sarcopenia: facts, numbers, and epidemiology—update 2014. J Cachexia Sarcopenia Muscle 2014;5:253–259. - PMC - PubMed

LinkOut - more resources