. 2023 Dec 20;14(1):8479.
doi: 10.1038/s41467-023-44199-7.

Quantitatively assessing early detection strategies for mitigating COVID-19 and future pandemics

Affiliations

Quantitatively assessing early detection strategies for mitigating COVID-19 and future pandemics

Andrew Bo Liu et al. Nat Commun. .

Abstract

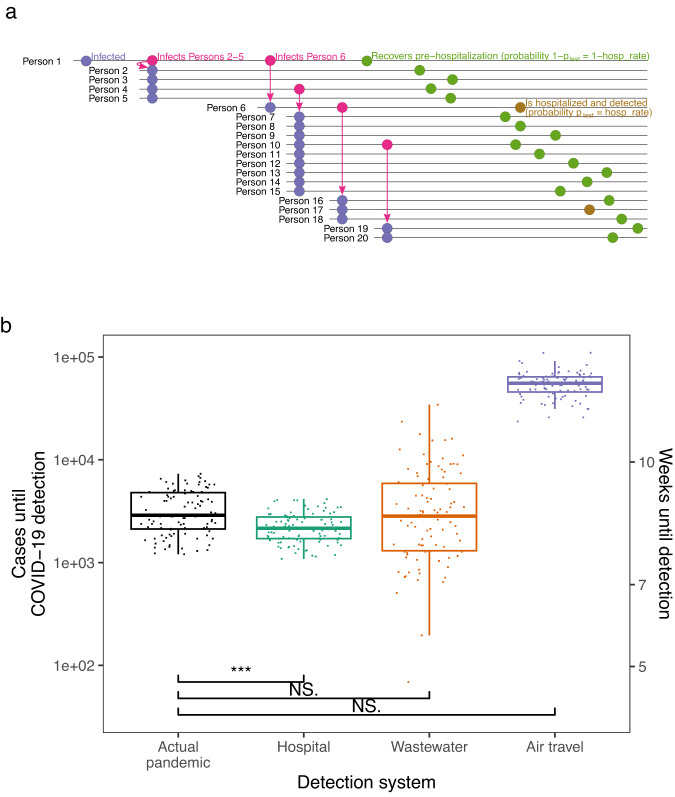
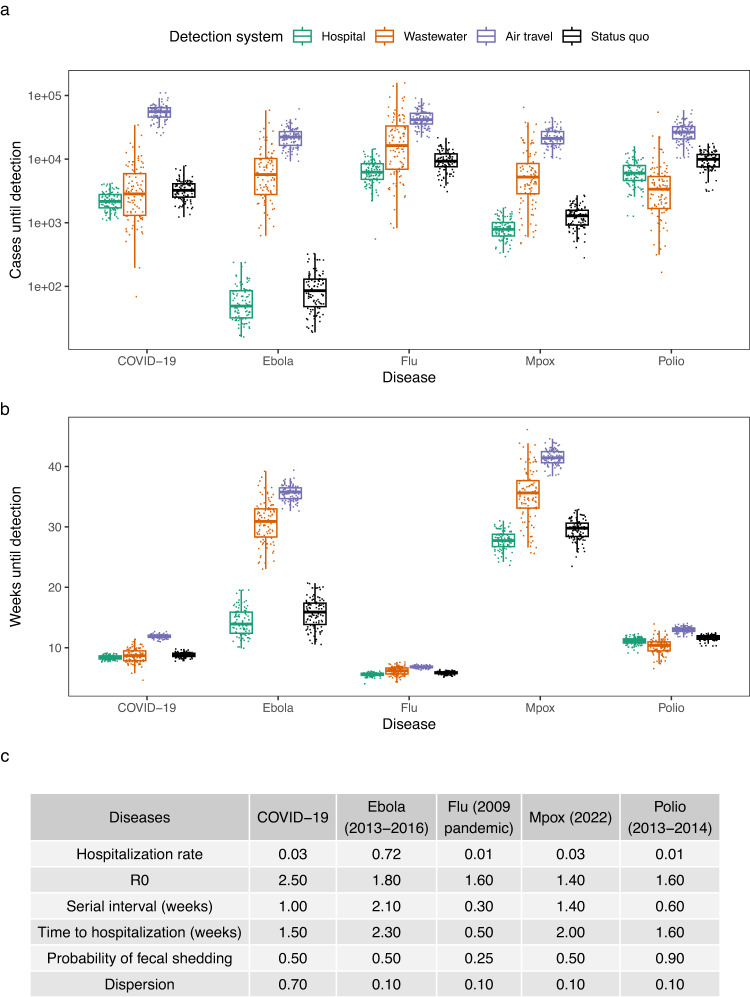
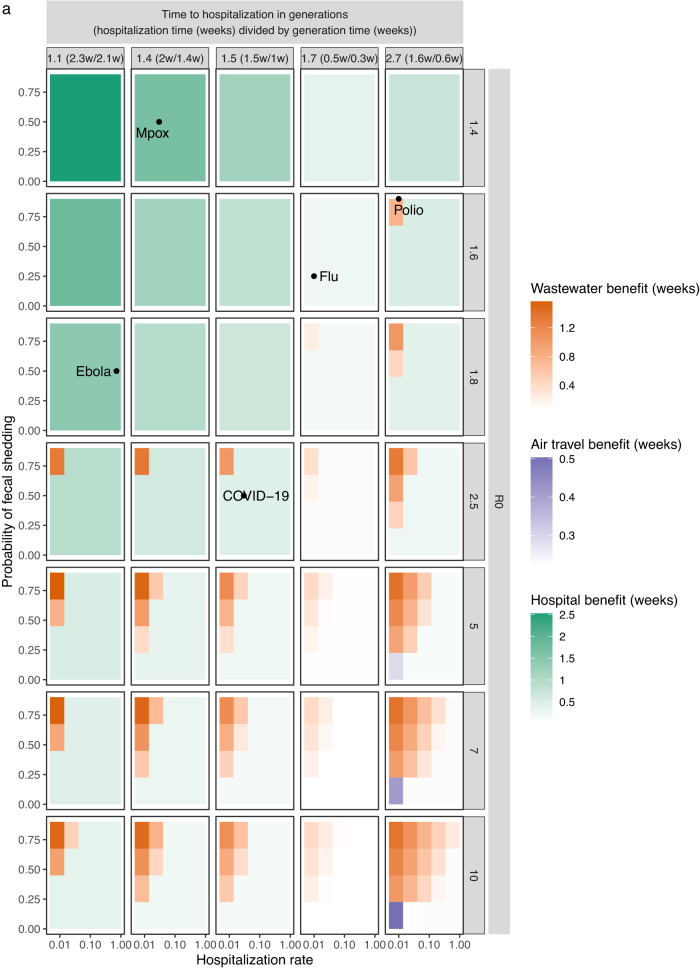
Researchers and policymakers have proposed systems to detect novel pathogens earlier than existing surveillance systems by monitoring samples from hospital patients, wastewater, and air travel, in order to mitigate future pandemics. How much benefit would such systems offer? We developed, empirically validated, and mathematically characterized a quantitative model that simulates disease spread and detection time for any given disease and detection system. We find that hospital monitoring could have detected COVID-19 in Wuhan 0.4 weeks earlier than it was actually discovered, at 2,300 cases (standard error: 76 cases) compared to 3,400 (standard error: 161 cases). Wastewater monitoring would not have accelerated COVID-19 detection in Wuhan, but provides benefit in smaller catchments and for asymptomatic or long-incubation diseases like polio or HIV/AIDS. Air travel monitoring does not accelerate outbreak detection in most scenarios we evaluated. In sum, early detection systems can substantially mitigate some future pandemics, but would not have changed the course of COVID-19.


Conflict of interest statement

W.P.H. is a member of the scientific advisory board and has stock options in BioBot Analytics. M.S. is a cofounder of Rhinostics and consults for the diagnostic consulting company Vectis Solutions LLC. The other authors declare that they have no competing interests.

Figures

Fig. 1
Fig. 1. Early detection’s impact on COVID-19 detection in Wuhan.
a Schematic of first 20 infections in a simulated run of the detection model. In this run, Person 1 seeds an outbreak in a community covered by a hospital detection system. Each person infects a number of individuals determined by a draw from a negative binomial distribution. Each person is then detected by the detection system with probability ptest (gold) or goes undetected (olive); in the hospital system, ptest equals the hospitalization rate. b Estimated cases until COVID-19 detection in the actual pandemic versus model-simulated cases until detection for proposed detection systems (box plots indicate median (middle line), 25th, 75th percentile (box), and points closest to 1.5× interquartile range (whiskers)). Estimates for the actual pandemic are drawn from ref. . Points for proposed detection systems are simulated case counts from the model (actual pandemic (black), hospital (teal), wastewater (orange) and air travel (purple)) assuming a Wuhan-sized catchment (650,000 people). Three, two, and one asterisk(s) signify that the cases upon detection for the detection system are statistically significantly lower than those in the actual pandemic at the 0.001, 0.01, and 0.05 levels, respectively, in one-sided t tests. NS. signifies not statistically significantly lower at p = 0.05. P values for systems detecting earlier than in the actual pandemic are 1.9e-09 (hospital), 0.98 (wastewater) and 1 (air travel). Equivalent weeks until detection are shown on the right y axis. Each boxplot shows 100 simulations (points).
Fig. 2
Fig. 2. Comparison of detection systems for different diseases.
a Earliness of detection for detection systems in cases across infectious diseases (hospital (teal), wastewater (orange), air travel (purple), and status quo (black)) in a 650,000-person catchment (box plots indicate median (middle line), 25th, 75th percentile (box), and points closest to 1.5× interquartile range (whiskers)). Each boxplot shows 100 simulations (points). b Earliness of detection for detection systems in weeks across infectious diseases in a 650,000-person catchment (box plots indicate median (middle line), 25th, 75th percentile (box), and points closest to 1.5× interquartile range (whiskers)). Each boxplot shows 100 simulations (points). c Epidemiological parameters of the studied diseases.
Fig. 3
Fig. 3. Comparison of detection systems across the space of possible diseases of varying epidemiological parameters.
a Average weeks gained over status quo detection by the proposed detection systems across the epidemiological space of possible diseases. Within each panel, each uniformly colored cell corresponds to a specific disease with the hospitalization rate and probability of fecal shedding indicated on the x and y axes, as well as the R0 and time to hospitalization (generations) indicated by the panel row and column. The cell has a hue corresponding to the detection system that detects the disease the earliest (hospital (teal), wastewater (orange) and air travel (purple)) and an intensity corresponding to the number of weeks gained by the earliest system over status quo detection. Times are calculated by the derived mathematical approximation in a 650,000-person catchment.

Update of

References

    1. Kraemer MUG, et al. The effect of human mobility and control measures on the COVID-19 epidemic in China. Science. 2020;368:493–497. doi: 10.1126/science.abb4218. - DOI - PMC - PubMed
    1. Meyerowitz-Katz G, et al. Is the cure really worse than the disease? The health impacts of lockdowns during COVID-19. BMJ Glob. Health. 2021;6:e006653. doi: 10.1136/bmjgh-2021-006653. - DOI - PMC - PubMed
    1. Yamey G, Walensky RP. Covid-19: Re-opening universities is high risk. BMJ. 2020;370:m3365. doi: 10.1136/bmj.m3365. - DOI - PubMed
    1. Brauner JM, et al. Inferring the effectiveness of government interventions against COVID-19. Science. 2021;371:eabd9338. doi: 10.1126/science.abd9338. - DOI - PMC - PubMed
    1. Ferguson, N. M. et al. Report 9 - Impact of non-pharmaceutical interventions (NPIs) to reduce COVID-19 mortality and healthcare demand. https://www.imperial.ac.uk/medicine/departments/school-public-health/inf... (2020). - PMC - PubMed

Publication types