. 2023 Dec 20;14(1):8461.
doi: 10.1038/s41467-023-44312-w.

Reassessing endothelial-to-mesenchymal transition in mouse bone marrow: insights from lineage tracing models

Affiliations

Reassessing endothelial-to-mesenchymal transition in mouse bone marrow: insights from lineage tracing models

Jia Cao et al. Nat Commun. .

Abstract

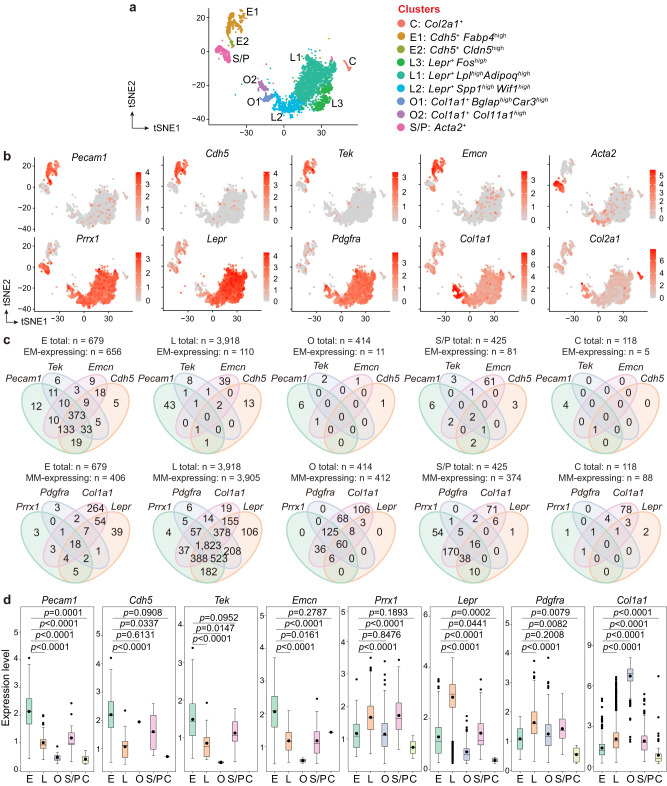
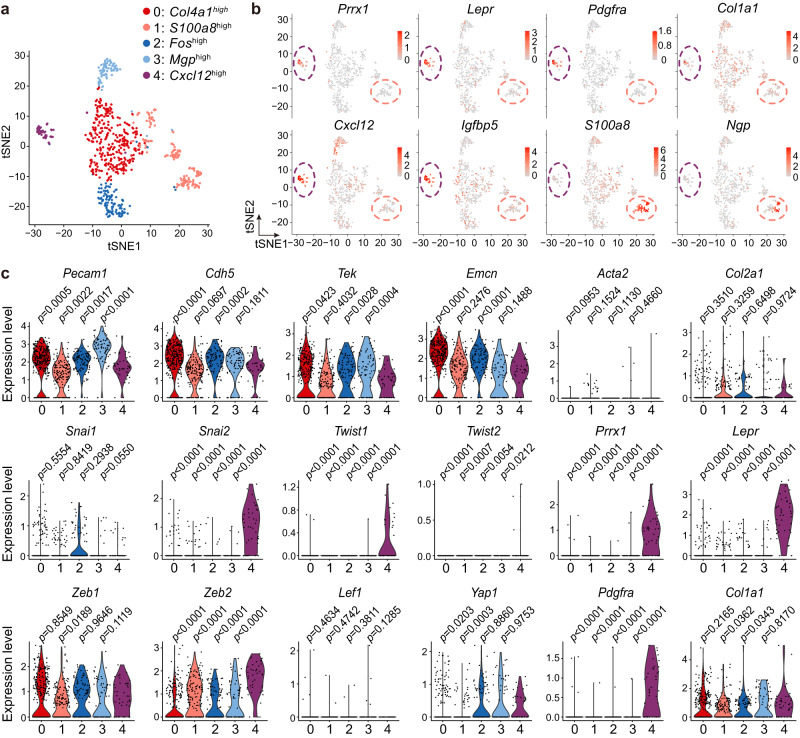
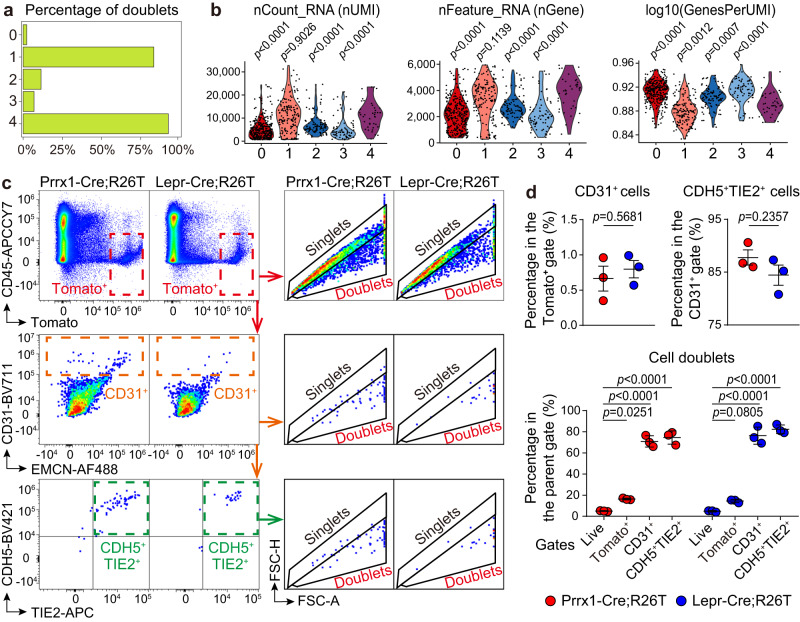
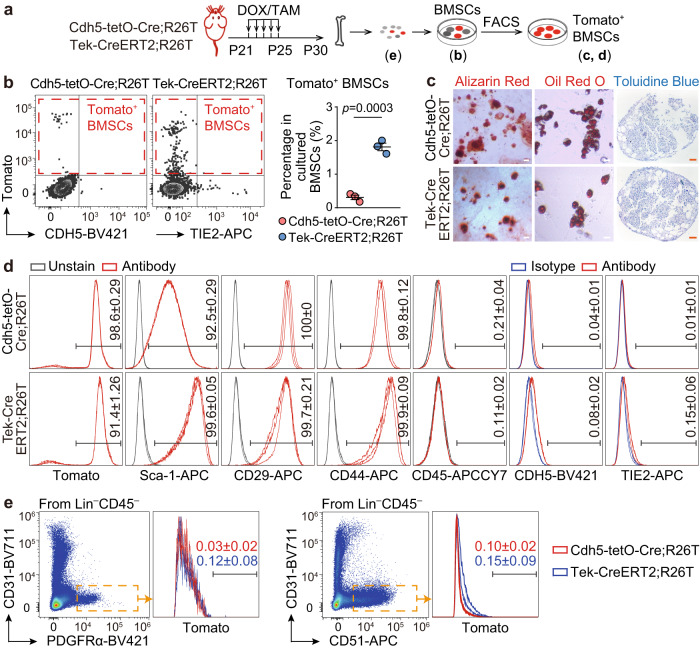
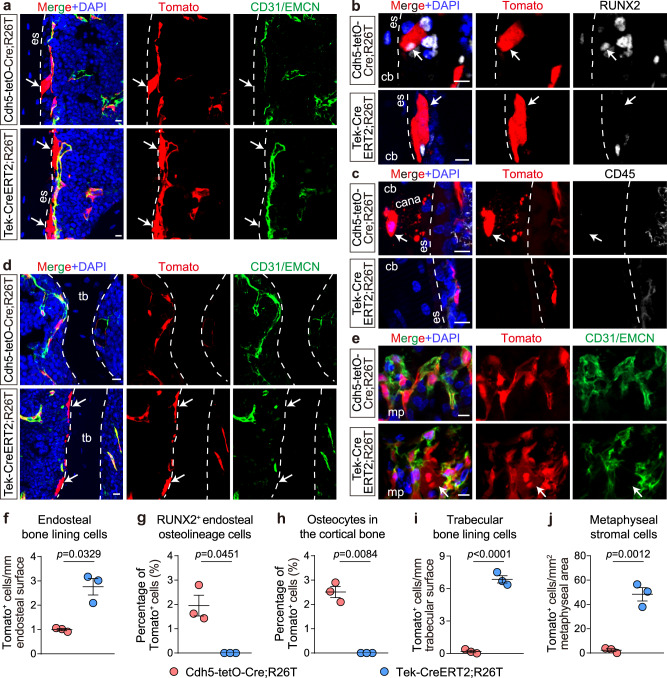
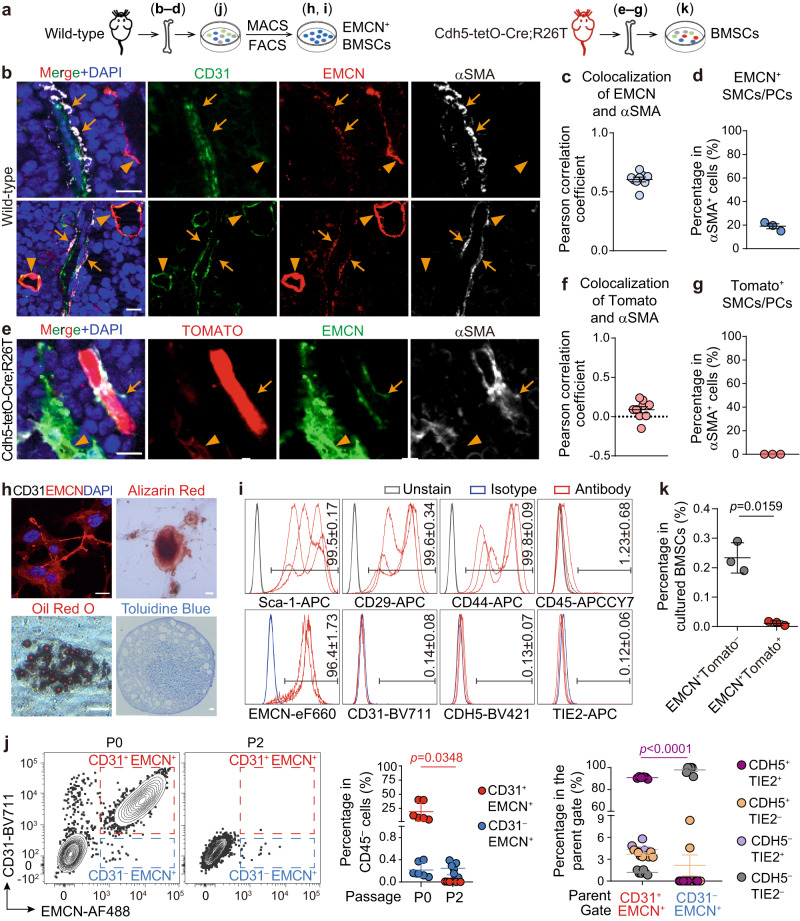
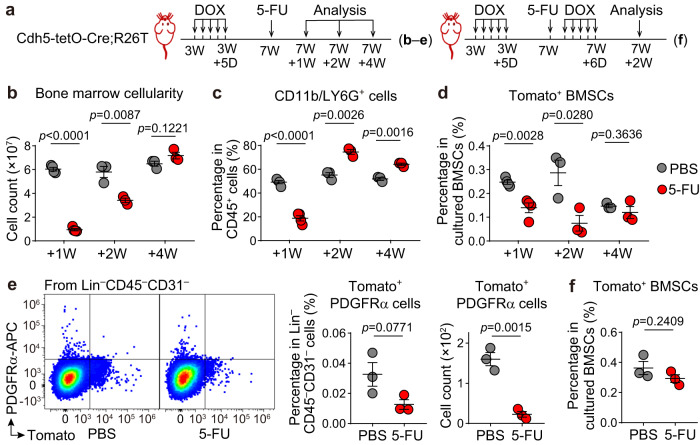
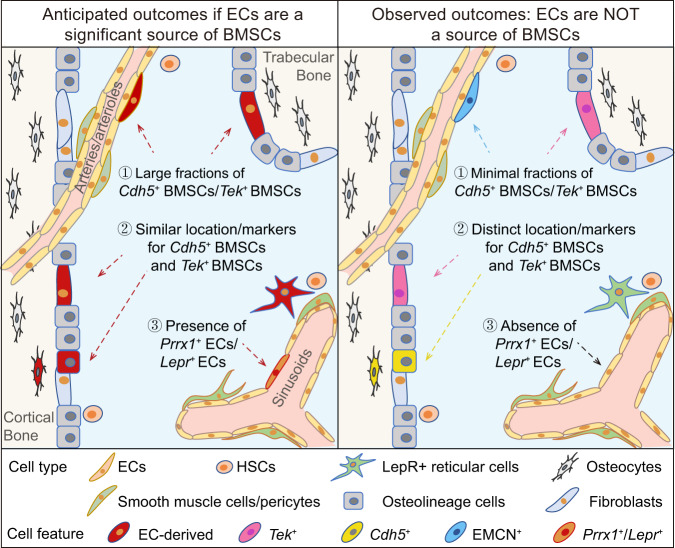
Endothelial cells (ECs) and bone marrow stromal cells (BMSCs) play crucial roles in supporting hematopoiesis and hematopoietic regeneration. However, whether ECs are a source of BMSCs remains unclear. Here, we evaluate the contribution of endothelial-to-mesenchymal transition to BMSC generation in postnatal mice. Single-cell RNA sequencing identifies ECs expressing BMSC markers Prrx1 and Lepr; however, this could not be validated using Prrx1-Cre and Lepr-Cre transgenic mice. Additionally, only a minority of BMSCs are marked by EC lineage tracing models using Cdh5-rtTA-tetO-Cre or Tek-CreERT2. Moreover, Cdh5+ BMSCs and Tek+ BMSCs show distinct spatial distributions and characteristic mesenchymal markers, suggestive of their origination from different progenitors rather than CDH5+ TEK+ ECs. Furthermore, myeloablation induced by 5-fluorouracil treatment does not increase Cdh5+ BMSCs. Our findings indicate that ECs hardly convert to BMSCs during homeostasis and myeloablation-induced hematopoietic regeneration, highlighting the importance of using appropriate genetic models and conducting careful data interpretation in studies concerning endothelial-to-mesenchymal transition.


Conflict of interest statement

The authors declare no competing interests.

Figures

Fig. 1
Fig. 1. Potential intermediates of EndoMT are detected in postnatal bone marrow using scRNA-seq.
a t-SNE visualization of EC and stromal cell clusters (n = 5554 ECs and stromal cells) in the scRNA-seq of collagenase-digested bone and bone marrow cells from 5-week-old wild-type mice (n = 3 mice). E ECs. L LEPR+ BMSCs. O osteolineage cells. C chondrolineage cells. S/P SMCs/PCs. b, c t-SNE diagrams showing the presence of endothelial and mesenchymal markers (b), and the Venn diagrams showing the co-expression of endothelial and mesenchymal markers (c) in ECs and stromal cell subtypes. d Boxplots showing the transcript levels of endothelial and mesenchymal markers in ECs and stromal cell subtypes expressing these markers (number of cells expressing endothelial/mesenchymal markers are shown in c). EM, endothelial marker. MM, mesenchymal markers. Boxplots display the following parameters: the median (middle line), the first and third quartiles (lower and upper edges of the “boxes”), the largest/smallest values no further than 1.5 times the distance between the first and third quartiles (upper/lower whiskers), data beyond the end of the whiskers (individually plotted dots), and the mean (small dots within “boxes”). Statistical significance was determined by two-tailed Wilcox rank-sum test. Source data are provided as a Source Data file.
Fig. 2
Fig. 2. EC subset with EndoMT-related gene expression profiles is identified via scRNA-seq analysis.
a t-SNE visualization of EC subclusters in the scRNA-seq of collagenase-digested bone and bone marrow cells. b, c t-SNE (b) and violin (c) plots showing the expression of endothelial markers, mesenchymal markers, and EndoMT-related transcript factors among the EC subclusters. Statistical significance was determined by two-tailed Wilcox rank-sum test.
Fig. 3
Fig. 3. EC-BMSC heterotypic doublets are the predominant source of ECs expressing mesenchymal markers in scRNA-seq analysis.
a, b Bar graph (a) and violin plots (b) showing the doublet ratios, nUMI, nGene, and log10(GenesPerUMI) among the EC subclusters. c, d Flow cytometry analysis illustrating the gating strategy (c) and quantification (d) of Tomato+ cells, Tomato+CD31+ cells, Tomato+CD31+CDH5+TIE2+ cells, and the doublet ratios of these cell populations in the live, LinCD45 bone marrow cells of Prrx1-Cre;R26T (n = 3 biologically independent animals) and Lepr-Cre;R26T (n = 3 biologically independent animals) mice. Data represent the mean ± S.E.M. Statistical significance was determined by two-tailed Wilcox rank-sum test (b), two-tailed unpaired Student’s t-test or one-way ANOVA with Dunnett’s test (d). Source data are provided as a Source Data file.
Fig. 4
Fig. 4. A small portion of BMSCs are labeled with EC lineage tracing models.
a Diagrams of protocols. Notes on the timeline indicate the age of mice. b Flow cytometry analysis showing the percentage of Tomato+ cells within cultured BMSCs from Cdh5-tetO-Cre;R26T (n = 3 biologically independent animals) and Tek-CreERT2;R26T (n = 3 biologically independent animals) mice. c, d Analysis of osteogenic (Alizarin Red staining), adipogenic (Oil Red O staining), and chondrogenic (Toluidine Blue staining) differentiation capacities (c), repeated independently three times with similar results, as well as expression of mesenchymal, hematopoietic, and endothelial markers (d), numbers in plots indicate the percentage of cells that stained positive for antibodies in FACS-purified Tomato+ BMSCs from Cdh5-tetO-Cre;R26T (n = 3 biologically independent samples) and Tek-CreERT2-R26T (n = 3 biologically independent samples). e Percentage of Tomato+ cells in uncultured BMSCs from Cdh5-tetO-Cre;R26T (n = 3 biologically independent animals) and Tek-CreERT2-R26T (n = 3 biologically independent animals) mice in flow cytometry analysis. Scale bars: 50 µm. Data represent the mean ± S.E.M. Statistical significance was determined by two-tailed unpaired Student’s t-test. Source data are provided as a Source Data file.
Fig. 5
Fig. 5. Different EC lineage tracing models label distinct stromal cell subpopulations in vivo.
ae Representative immunostaining images showing the differential labeling of endosteal bone-lining cells (a), RUNX2+ endosteal osteolineage cells (b), osteocytes in the cortical bone (c), trabecular bone-lining cells (d), and metaphyseal stromal cells (e) (arrows) by Cdh5-tetO-Cre;R26T (n = 3 biologically independent animals) and Tek-CreERT2-R26T (n = 3 biologically independent animals) models. fj Quantification of Tomato+ endosteal bone-lining cells (f), RUNX2+ endosteal osteolineage cells (g), osteocytes in the cortical bone (i), trabecular bone-lining cells (j), and metaphyseal stromal cells (i) traced in the Cdh5-tetO-Cre;R26T and Tek-CreERT2-R26T models. Scale bars: 10 µm. Data represent the mean ± S.E.M. Statistical significance was determined by two-tailed unpaired Student’s t-test (fh adjusted for unequal variances with Welch’s test). Source data are provided as a Source Data file.
Fig. 6
Fig. 6. EMCN+ SMCs/PCs are not labeled by EC lineage tracing models.
a Diagrams of protocols. bd. Immunostaining analysis showing the presence of EMCNlow SMCs/PCs (arrows) surrounding or aligning with CD31+EMCN arteries and arterioles in tibia/femur sections of wild-type mice (n = 3 biologically independent animals). eg Immunostaining analysis showing the absence of Tomato+ SMCs/PCs in tibia/femur sections of Cdh5-tetO-Cre;R26T mice (n = 3 biologically independent animals). h, i Analysis of osteogenic, adipogenic, and chondrogenic differentiation capacities (h, repeated independently three times with similar results), as well as expression of mesenchymal, hematopoietic, and endothelial markers (i) in MACS/FACS-purified EMCN+ BMSCs from wild-type mice (n = 3 biologically independent samples). j Flow cytometry analysis showing the CD31+EMCN+ and CD31EMCN+ populations in passage 0 (P0, n = 6 biologically independent samples) and P2 (n = 6 biologically independent samples) bone marrow cells cultured in endothelial growth medium (EGM) and the percentage of CDH5+TIE2+ cells in the P0 EMCN+ populations. k Flow cytometry analysis of EMCN+ cells in EGM-cultured bone marrow cells from Cdh5-tetO-Cre;R26T mice (n = 3 biologically independent samples). Scale bars: 10 µm. Data represent the mean ± S.E.M. c, f Colocalization was quantified for EMCNlow SMCs/PCs and total SMCs/PCs, respectively (3 randomly chosen EMCNlow SMCs/PCs or total SMCs/PCs per biological replicate). Statistical significance was determined by two-tailed unpaired Student’s t-test adjusted for unequal variances with Welch’s test. Source data are provided as a Source Data file.
Fig. 7
Fig. 7. Endothelial marker-expressing BMSC population does not increase in myeloablation-induced hematopoietic regeneration.
a Diagrams of protocols. Notes on the timeline indicate the age of mice. bd Flow cytometry analysis depicting changes in bone marrow cellularity (b), the percentage of CD11b/LG6G+ myeloid cells in CD45+ hematopoietic cells (c), and the percentage of Tomato+ cells in cultured BMSCs (d) from Cdh5-tetO-Cre;R26T mice treated with PBS (n = 4, 3, 3 biologically independent animals at +1 W, +2 W, and +4 W, respectively) or 5-FU (n = 4, 3, 3 biologically independent animals at +1 W, +2 W, and +4 W, respectively). e Flow cytometry analysis showing the percentage and number of Tomato+PDGFRα+ cells within uncultured LinCD45CD31 cells from Cdh5-tetO-Cre;R26T mice treated with PBS (n = 3 biologically independent animals, at +2 W) or 5-FU (n = 3 biologically independent animals, at +2 W). f Analysis of Tomato+ BMSCs from Cdh5-tetO-Cre;R26T mice that administered an extra round of doxycycline after PBS (n = 3 biologically independent animals) or 5-FU (n = 3 biologically independent animals) treatment. Data represent the mean ± S.E.M. Statistical significance was determined by two-tailed unpaired Student’s t-test. Source data are provided as a Source Data file.
Fig. 8
Fig. 8. Graphical illustration of the anticipated and observed outcomes in bone marrow EndoMT investigations.
The bone marrow cavity surrounding the cortical and trabecular bone is depicted. If ECs are a significant source of BMSCs, then large fractions of BMSCs should be marked by EC lineage tracing models Cdh5-rtTA-tetO-Cre and Tek-CreERT2, both of which effectively trace bone marrow ECs. Additionally, BMSCs derived from ECs should be similarly marked by the two EC lineage tracing models. Moreover, subsets of ECs may express mesenchymal markers such as PRRX1 and LEPR. However, the observed results showed that only a minor fraction of BMSCs were Cdh5+ or Tek+. Additionally, Cdh5+ BMSCs and Tek+ BMSCs displayed different frequencies, spatial distribution and characteristic mesenchymal markers. Furthermore, Prrx1+ ECs and Lepr+ ECs were not present.

References

    1. Aragon JW, Hirschi KK. Endothelial cell differentiation and hemogenic specification. Cold Spring Harb. Perspect. Med. 2022;12:a041164. doi: 10.1101/cshperspect.a041164. - DOI - PMC - PubMed
    1. Kusumbe AP, Ramasamy SK, Adams RH. Coupling of angiogenesis and osteogenesis by a specific vessel subtype in bone. Nature. 2014;507:323–328. doi: 10.1038/nature13145. - DOI - PMC - PubMed
    1. Dejana E, Hirschi KK, Simons M. The molecular basis of endothelial cell plasticity. Nat. Commun. 2017;8:14361. doi: 10.1038/ncomms14361. - DOI - PMC - PubMed
    1. Kasper DM, et al. The N-glycome regulates the endothelial-to-hematopoietic transition. Science. 2020;370:1186–1191. doi: 10.1126/science.aaz2121. - DOI - PMC - PubMed
    1. Azzoni E, et al. Hemogenic endothelium generates mesoangioblasts that contribute to several mesodermal lineages in vivo. Development. 2014;141:1821–1834. doi: 10.1242/dev.103242. - DOI - PubMed

Publication types