. 2023 Dec 20;14(1):8483.
doi: 10.1038/s41467-023-44291-y.

A unique sigma/anti-sigma system in the actinomycete Actinoplanes missouriensis

Affiliations

A unique sigma/anti-sigma system in the actinomycete Actinoplanes missouriensis

Takeaki Tezuka et al. Nat Commun. .

Abstract

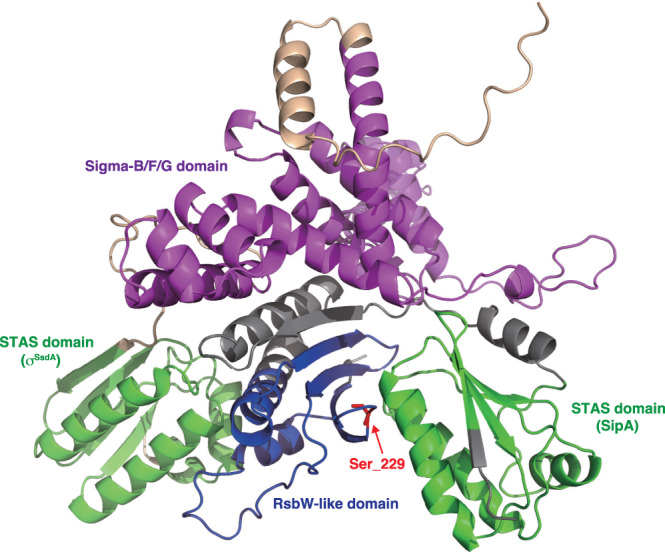
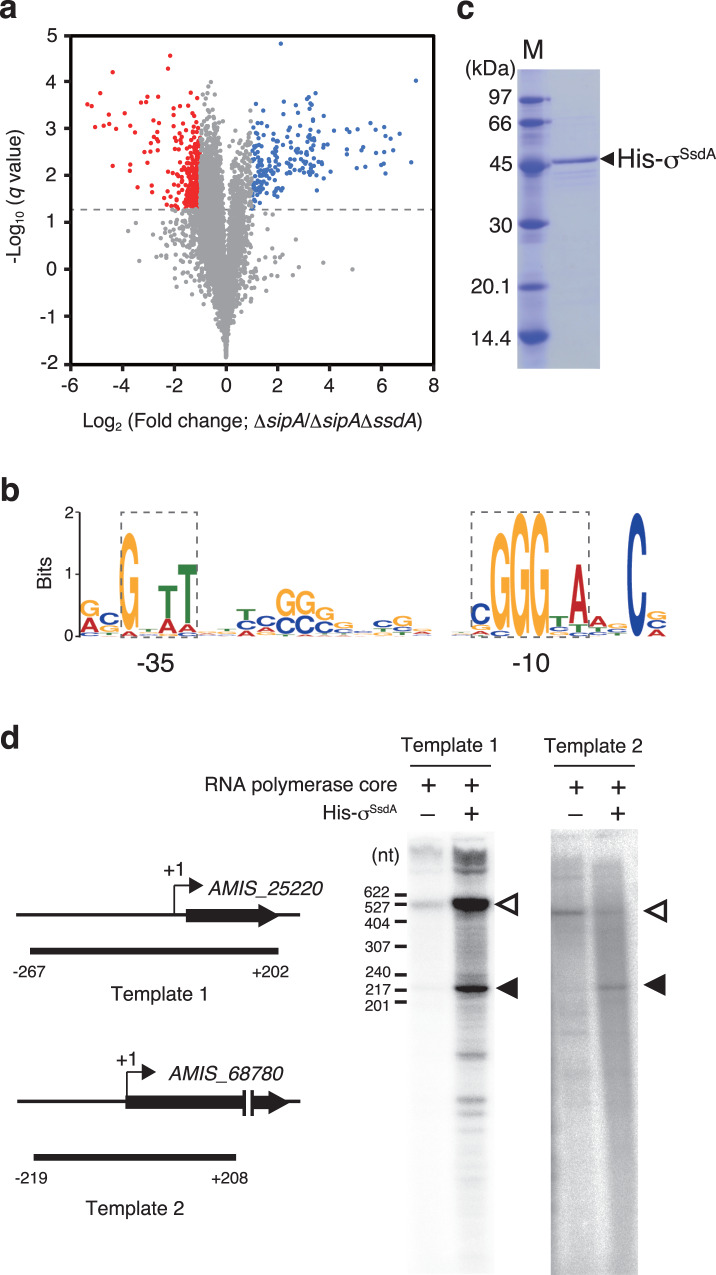
Bacteria of the genus Actinoplanes form sporangia that contain dormant sporangiospores which, upon contact with water, release motile spores (zoospores) through a process called sporangium dehiscence. Here, we set out to study the molecular mechanisms behind sporangium dehiscence in Actinoplanes missouriensis and discover a sigma/anti-sigma system with unique features. Protein σSsdA contains a functional sigma factor domain and an anti-sigma factor antagonist domain, while protein SipA contains an anti-sigma factor domain and an anti-sigma factor antagonist domain. Remarkably, the two proteins interact with each other via the anti-sigma factor antagonist domain of σSsdA and the anti-sigma factor domain of SipA. Although it remains unclear whether the SipA/σSsdA system plays direct roles in sporangium dehiscence, the system seems to modulate oxidative stress responses in zoospores. In addition, we identify a two-component regulatory system (RsdK-RsdR) that represses initiation of sporangium dehiscence.


Conflict of interest statement

The authors declare no conflicts of interest.

Figures

Fig. 1
Fig. 1. Observation of sporangium dehiscence and number of spores released from sporangia.
au Observation of sporangia and zoospores using phase-contrast microscopy. Sporangia produced on HAT agar were harvested and suspended in 25 mM histidine solution to induce sporangium dehiscence. Microscopic images of the wild-type strain (ac), ΔsipA strain (df), ΔsipA strain harbouring sipA complementation plasmid (gi), ΔsipA strain harbouring sipA (S229P)-expressing plasmid (jl), ΔssdA strain (mo), ΔsipAΔssdA strain (pr), and ΔsipAΔssdA strain harbouring ssdA complementation plasmid (su). Images in a, d, g, j, m, p, s were obtained immediately after suspension. Images in b, e, h, k, n, q, t were obtained 15 min after suspension. Images in c, f, i, l, o, r, u were obtained 30 min after suspension. Immediately after suspension, the sporangia appeared phase-bright (a, d, g, j, m, p, s). The sporangium membranes gradually became transparent before spore release (b, h, n, q). Sporangia (including those whose membrane became transparent) and released spores are indicated by arrows and arrowheads, respectively. Scale bars, 5 μm. The entire images of each microscopic field are shown in Fig. S4. v Number of spores released from the sporangia. Each strain was cultivated on HAT agar at 30 °C for 7 days. Zoospores released from the sporangia formed on one HAT agar plate by pouring 25 mM NH4HCO3 solution were counted as colony forming unit (CFU) on YBNM agar. The values represent the mean ± standard error of three biological replicates. Source data are provided as a Source Data file.
Fig. 2
Fig. 2. BACTH assays for SipA and σSsdA.
ac β-Galactosidase activity (Miller unit) of E. coli BTH101 co-transformed with the following two plasmids: plasmids harbouring sipA and ssdA individually (a); plasmids harbouring sipA_C and ssdA_C genes encoding the C-terminal anti-sigma factor domain of SipA and the C-terminal anti-sigma factor antagonist domain of σSsdA, respectively (b); and plasmids harbouring the sipA_N and sipA_C genes encoding the N-terminal anti-sigma factor antagonist and C-terminal anti-sigma factor domains of SipA, respectively (c). In ac, the plasmid for production of the SipA (S229P) variant was also used. Mutated genes are shown with asterisks. Empty vectors expressing only T18 and T25 domains of adenylate cyclase were used as vector controls. Data are means ± standard error. In c, seven, five, and six biologically independent samples were analyzed for the transformants with pKT25-sipA_C and pUT18C-sipA_N, with pKT25-sipA_C and pUT18C, and with pKT25-sipA_C (S229P) and pUT18C, respectively. For the remaining transformants, three biologically independent samples were analyzed. Source data are provided as a Source Data file. d A schematic diagram of domain structures of SipA and σSsdA. Domain combinations whose interactions were detected in the BACTH assays are indicated by double-headed arrows. Location of S229P replacement in SipA is indicated by a red arrowhead.
Fig. 3
Fig. 3. AlphaFold-Multimer-based prediction of the SipA-σSsdA complex structure.
Polypeptides are shown by ribbon representation and coloured green for the STAS domains (SipA and σSsdA), blue for the RsbW-like domain (SipA), and magenta for the sigma-B/F/G domain (σSsdA). The remaining residues of SipA and σSsdA are coloured grey and pale orange, respectively. Ser-229 in SipA is indicated by a red arrow. PDB files for predicted structures are available in Supplementary Data 1. Predicted local distance difference test (pLDDT) and predicted aligned error (PAE) scores are shown in Fig. S7.
Fig. 4
Fig. 4. RNA-Seq analysis and in vitro transcription using recombinant σSsdA.
a Volcano plot of differential expression. Each gene was plotted based on fold-change in the ΔsipA strain versus ΔsipAΔssdA strain and the q value. Genes differentially expressed in ΔsipA strain compared to ΔsipAΔssdA strain are highlighted by colour: blue and red dots indicate up- and down-regulated (>2.0-fold and <0.5-fold) genes, respectively, in the ΔsipA strain. The dotted line indicates the threshold q value (0.05). Source data are provided as a Source Data file. b Sequence logo of the σSsdA-recognizing promoter. The panel is based on 17 promoter sequences among upstream regions of 213 genes upregulated in the ΔsipA strain (Fig. S9). The −10 and −35 elements are indicated by dotted rectangles. c Purification of recombinant His-σSsdA protein. His-σSsdA protein was produced in E. coli, and the purified protein was analyzed by SDS-PAGE. The separating gel was stained with Coomassie Brilliant Blue (CBB). Molecular size standards are shown in the Marker (M) lane. d In vitro transcription assays using the His-σSsdA protein. DNA templates covering the promoter regions of AMIS_25220 (template 1) and AMIS_68780 (template 2) were prepared using PCR, and in vitro transcription assays were performed using the RNA polymerase core complex from E. coli and recombinant His-σSsdA protein. The presence (+) and absence (–) of the protein or protein complex are indicated above the panels. Transcripts from the transcriptional start site and terminus of the template are indicated by closed and open triangles, respectively. Schematic diagrams of the template locations are also shown on the left side of the panels. In (c) and (d), data are representative of similar results obtained in two independent experiments.
Fig. 5
Fig. 5. Involvement of the RsdK-RsdR two-component regulatory system in sporangium dehiscence.
ar Observation of sporangia and zoospores using phase-contrast microscopy. Sporangia produced on HAT agar were harvested and suspended in 25 mM histidine solution to induce sporangium dehiscence. Microscopic images of the wild-type strain (ad), ΔrsdKΔrsdR strain (eg), ΔrsdKΔrsdR strain harbouring the complementation plasmid (hk), ΔsipAΔrsdR strain (ln), and wild-type strain harbouring rsdR-rsdK-expressing plasmid (or). Images in panels a, e, h, l, o were obtained immediately after suspension. Images in panels b, f, i, m, p were obtained 5 min after suspension. Images in panels c, g, j, n, q were obtained 15 min after suspension. Images in panels d, k, r were obtained 30 min after suspension. Sporangia (including those whose membranes became transparent) and released spores are indicated by arrows and arrowheads, respectively. Scale bars, 5 μm. The entire images of each microscopic field are shown in Fig. S11. su Number of spores released from the sporangia. Each strain was cultivated on HAT agar at 30 °C for 7 days, and zoospores released from the sporangia formed on one HAT agar plate by pouring 25 mM NH4HCO3 solution were counted as CFU on YBNM agar. Data are means of three biological replicates ± standard error. Source data are provided as a Source Data file. s Number of spores released from sporangia of wild-type and ΔrsdKΔrsdR strains. Zoospores were collected 20 and 60 min after pouring NH4HCO3 solution. t Number of spores released from sporangia of wild-type and ΔrsdKΔrsdR strains, both of which contained pTYM19-Apra, and ΔrsdKΔrsdR strain harbouring the complementation plasmid. Zoospores were collected 20 min after pouring NH4HCO3 solution. u Number of spores released from the wild-type strain harbouring pTYM19-Apra or rsdR-rsdK-expressing plasmid. Zoospores were collected 60 min after pouring NH4HCO3 solution.
Fig. 6
Fig. 6. Oxidative stress resistance of zoospores.
Zoospores released from sporangia formed on one HAT agar plate of wild-type and ΔssdA strains, both of which contained pTYM19-Apra, and the ΔssdA strain harbouring the complementation plasmid were incubated in the absence or presence of 0.03% hydrogen peroxide for 1 h and cultivated on YBNM agar at 30 °C for 2 days. The number of colonies was counted, and mean values ± standard error from three biological replicates are shown. Source data are provided as a Source Data file.
Fig. 7
Fig. 7. Proposed regulatory model of gene expression by the SipA-σSsdA sigma/anti-sigma system.
The anti-sigma (RsbW-like) and anti-sigma factor antagonist (STAS) domains of SipA constitutively interact with each other. To inactivate σSsdA, the RsbW-like domain of SipA binds to the STAS domain of σSsdA, thereby modulating the expression of the genes under the control of σSsdA. Arrows indicate positive control and a line with a vertical short line indicates negative control. Indirect regulation was indicated by dotted lines. Open arrows indicate involvement of gene products in biological phenomena described in the boxes. The prefix “AMIS” is omitted from the locus tag (gene number)-derived protein names.

References

    1. Hong Y, et al. Cyclic di-GMP mediates Mycobacterium tuberculosis dormancy and pathogenicity. Tuberculosis. 2013;93:625–634. doi: 10.1016/j.tube.2013.09.002. - DOI - PubMed
    1. Taggart MG, et al. Biofilm regulation in Clostridioides difficile: novel systems linked to hypervirulence. PLoS Pathog. 2021;17:e1009817. doi: 10.1371/journal.ppat.1009817. - DOI - PMC - PubMed
    1. Lee CD, et al. Genetic mechanisms governing sporulation initiation in Clostridioides difficile. Curr. Opin. Microbiol. 2021;66:32–38. doi: 10.1016/j.mib.2021.12.001. - DOI - PMC - PubMed
    1. Camilleri E, et al. Properties of aged spores of Bacillus subtilis. J. Bacteriol. 2019;201:e00231–19. doi: 10.1128/JB.00231-19. - DOI - PMC - PubMed
    1. Paredes-Sabja D, Shen A, Sorg JA. Clostridium difficile spore biology: sporulation, germination, and spore structural proteins. Trends Microbiol. 2014;22:406–416. doi: 10.1016/j.tim.2014.04.003. - DOI - PMC - PubMed

Publication types

MeSH terms

Supplementary concepts