. 2023 Dec 20;14(1):8462.
doi: 10.1038/s41467-023-44305-9.

Single-cell multi-omics analysis of human testicular germ cell tumor reveals its molecular features and microenvironment

Affiliations

Single-cell multi-omics analysis of human testicular germ cell tumor reveals its molecular features and microenvironment

Xiaojian Lu et al. Nat Commun. .

Abstract

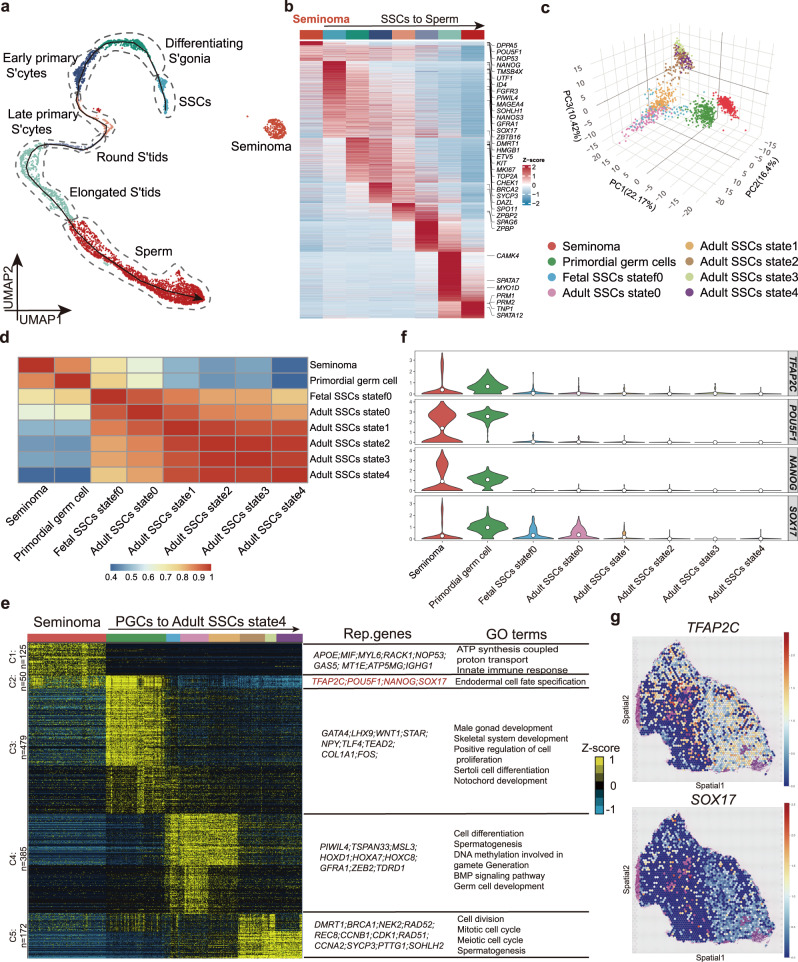
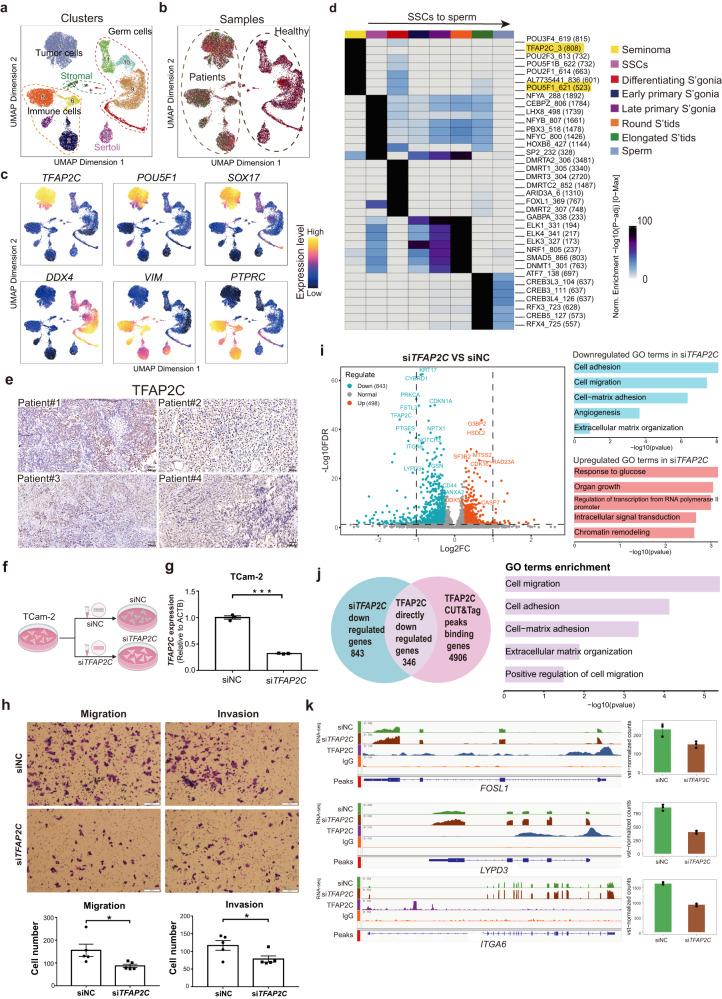
Seminoma is the most common malignant solid tumor in 14 to 44 year-old men. However, its molecular features and tumor microenvironment (TME) is largely unexplored. Here, we perform a series of studies via genomics profiling (single cell multi-omics and spatial transcriptomics) and functional examination using seminoma samples and a seminoma cell line. We identify key gene expression programs share between seminoma and primordial germ cells, and further characterize the functions of TFAP2C in promoting tumor invasion and migration. We also identify 15 immune cell subtypes in TME, and find that subtypes with exhaustion features were located closer to the tumor region through combined spatial transcriptome analysis. Furthermore, we identify key pathways and genes that may facilitate seminoma disseminating beyond the seminiferous tubules. These findings advance our knowledge of seminoma tumorigenesis and produce a multi-omics atlas of in situ human seminoma microenvironment, which could help discover potential therapy targets for seminoma.


Conflict of interest statement

The authors declare no competing interests.

Figures

Fig. 1
Fig. 1. Single-cell transcriptome profiling and analysis of seminoma.
a Schematic illustration of the experimental workflow. This plot created with BioRender.com. b Dimension-reduction presentation of the combined single-cell transcriptome data from seminoma samples (n = 4), Uniform manifold approximation and projection (UMAP) plot showing the major cell types (n = 10,817 cells). Dots represent individual cells, and colors represent different cell populations. c Cell ratio of cell types from (b). Colors represent different cell populations which is consistent with Fig. 1b. Source data are provided as a Source data file. d IHC staining for seminoma and immune cells in seminoma samples (n = 3). Brown color represents positive signal cells. CD45: immune cells; VIM: somatic cells; NANOG and OCT4/POU5F1: seminoma tumor cells. Scale bar, 100 μm. e Expression patterns of selected markers projected on the UMAP plot. f Heatmap of marker genes in each cluster and GO terms enrichment.
Fig. 2
Fig. 2. Seminoma and PGCs shared gene expression programs in pluripotency and germ cell development.
a UMAP plot of normal germ cells (n = 3 samples, data from GEO:GSE120508) combined with tumor cells (n = 5163 cells, 4 samples), curve with arrow represents development trajectory of normal germ cells from SSCs to sperm. b Heatmap showing average gene expression patterns of each cell type in (Fig. 2a). c 3D PCA of seminoma and early germ cells (UMAP shown in Supplementary Fig. 2a) showing that seminoma and PGCs display highest similarity. d Correlation analysis of cell types in (Fig. 2c) calculated using Pearson’s correlation coefficients. Source data are provided as a Source data file. e K-means clustering of genes exhibiting differential and shared expression between seminoma and all early germ cell stages. Curve with arrow represents developmental timeline of male germ cells. Each row represents a gene, and each column represents a single cell. Shared and differential gene expression levels use a Z score as defined by the color key; associated GO terms (using DAVID version 6.8) are given on the right of the corresponding gene clusters. f Expression of TFAP2C, POU5F1, NANOG and SOX17 in cell types in (Fig. 2c). The white dots represent mean expression. g TFAP2C and SOX17 expression patterns in spatial transcriptome data.
Fig. 3
Fig. 3. TFAP2C regulates genes associated with migration and invasion of seminoma.
a Dimension-reduction presentation of clusters and cell types annotation in scATAC-seq data from seminoma samples and healthy testicular control samples (n = 24,005 cells). b Samples origin of data in (Fig. 3b). c Predicted gene expression of selected markers in scATAC-seq data using ArchR. TFAP2C, POU5F1, SOX17: seminoma tumor cell markers; DDX4: germ cells marker; VIM: somatic cells marker; PTPRC: immune cells marker. d TF binding motifs enriched in seminoma tumor cells and adult normal germ cells. Top 7 TFs in each cell types were shown here. e IHC staining of TFAP2C in seminoma samples from four patients (n = 4). Scale bar, 50 μm. f Schematic diagram of knocking down TFAP2C in seminoma cell line TCam-2 using small interfering RNA (siRNA). NC: negative control. This plot created with BioRender.com. g Barplot showing the expression of TFAP2C in siTFAP2C and siNC group in TCam-2 cells (n = 3 experiments replicates). siNC: control group; siTFAP2C: TFAP2C were knocked down. P value was calculated by two-sided Wilcoxon rank-sum test. ***P < 0.001. Data are presented as “mean values ±SEM” as appropriate. h Crystal violet staining showed migration and invasion of TCam-2 cells in siTFAP2C group and siNC group (top). Statistics of migration and invasion cell numbers compared between two groups (below) (n = 5). P value was calculated by two-sided Wilcoxon rank-sum test. *P < 0.05. Data are presented as “mean values ± SEM” as appropriate. Source data are provided as a Source data file. Scale bar, 200 μm. i Volcano plot displays differential gene expression in siTFAP2C compared with siNC. The number represents gene count of downregulated (n = 843) and upregulated (n = 498). GO terms enrichment in downregulated genes and upregulated genes are shown on the right. The length of the bar represents the value of -log10pvalue. Source data are provided as a Source data file. j TFAP2C directly downregulated genes (n = 346) through intersecting downregulated genes in siTFAP2C group (n = 843) with TFAP2C bound genes (n = 4906). Go terms enriched in TFAP2C directly downregulated genes are displayed on the right. The length of the bar represents the value of -log10pvalue. k Coverage plots of representative genes which are directly downregulated by TFAP2C. The green color represents the siNC group and the brown color represents the siTFAP2C group (n = 3). Data are presented as “mean values ±SEM” as appropriate. Source data are provided as a Source data file.
Fig. 4
Fig. 4. T cell subtypes analysis.
a UMAP plot of immune cells subtypes (n = 10,672 cells). Re-clustering of CD8 + T cells (left, n = 2382 cells) and CD4 + T cells (right, n = 2840 cells). The number of samples is 4. b Heatmap of marker genes expressed in CD8+ and CD4 + T cells. The color above the heatmap corresponds to the clusters in UMAP show in (a). c The cell ratio of all CD8+ and CD4 + T cells. Source data are provided as a Source data file. d Trajectories of CD8+ (upper) and CD4+ (below) T cells from pseudotime analysis. e Spatial distribution of tumor cells, partial subgroups of CD8 + T cells and CD4 + T cells. f IHC staining validated the expression of CD3 and PDCD1 in the tumor regions and non-tumor regions in four seminoma samples. The bar plot represented the cell ratio of PDCD1+ cells (dysfunctional cells). The white color represents the PDCD1+/CD3+ cell ratio in non-tumor region and the black color represents the PDCD1+/CD3+ cell ratio in tumor region. P value was calculated by two-sided Wilcoxon rank-sum test. *P < 0.05. Data are presented as “mean values ±SEM” as appropriate. Source data are provided as a Source data file. Scale bar, 50 μm. g Survival analysis showing that FOXP3 and IL21 high expression was associated with worse overall survival (OS) and disease-specific survival in the TCGA cohorts.
Fig. 5
Fig. 5. MMP9 and CTSK facilitated seminoma to break through the tubules.
a Diagram of tumor cells breaking through the seminiferous tubules. This plot created with BioRender.com. b Expression of selected pathway in spatial transcriptome data of three seminoma samples. c scRNA-seq data showed that MMP9 mainly expressed in macrophage. d Correlation analysis of MMP9 and CTSK expression with macrophage location in spatial transcriptomics data using Pearson’s correlation coefficients. Points represent the cells in macrophage. Exact pvalue of MMP9 and macrophage: 2.08E–296; Exact pvalue of CTSK and macrophage: 5.01E–32. Source data are provided as a Source data file. e MMP9 and CTSK expression patterns in immune cells of scATAC-seq data from Fig. 3b. CD68 and LYZ: macrophage markers. f Survival analysis showing that MMP9 and CTSK high expression was associated with worse overall survival (OS) and Disease-specific survival in the TCGA cohorts. g IF staining of MMP9 and CTSK in tissue sections of seminoma patients (n = 3). White arrow represents positive signal. The barplot showed the percentage of MMP9+/CTSK+ cells in CD68+/CD68− cells. The height of the bar represents the cell ratio of MMP9+/CTSK+ cells in CD68+/CD68- cells. P value was calculated by one tailed paired t test. **P < 0.01. Data are presented as “mean values ± SEM” as appropriate. Source data are provided as a Source data file. Scale bar, 50 μm and 20 μm in magnified regions.
Fig. 6
Fig. 6. Tumor cells secreted MIF to affect other cells.
a Interacting ligand-receptor (L-R) pairs from seminoma to immune cells in TME. P value was calculated by Wilcoxon rank sum test. b The interaction network of all cells by MIF-(CD74 + CXCR4) L-R pairs in the microenvironment, with tumor cells being the main output signaling cells. The color of the line represents the signal emitted from the cell with the corresponding color. c Gene expression of MIF pathway in immune cell subtypes. d Spatial expression pattern of ligand (MIF) and receptor (CD74, CD44 and CXCR4) in MIF pathway. e IF staining of MIF and CD74 in seminoma samples (n = 3). White arrow represents positive signal. The barplot indicated the percentage of CD74+ cells in cells with high (in tumor cells) and low (in immune cells) MIF expression. P value was calculated by one tailed paired t test. *P < 0.05. Data are presented as “mean values ± SEM” as appropriate. Source data are provided as a Source data file. Scale bar, 50 μm and 20 μm in magnified regions. f Proportion of activated B cells detected by flow cytometry after co-culture with MIF in vitro. Barplot showing the activated B cell ratio in control group (Veh) and MIF stimulated group (MIF) (n = 6). P value was calculated by two-sided Wilcoxon rank-sum test. **P < 0.01. Data are presented as “mean values ± SEM” as appropriate. Source data are provided as a Source data file. Cell culture schematic (upper left) created with BioRender.com.

References

    1. Batool A, Karimi N, Wu XN, Chen SR, Liu YX. Testicular germ cell tumor: a comprehensive review. Cell Mol. Life Sci. 2019;76:1713–1727. doi: 10.1007/s00018-019-03022-7. - DOI - PMC - PubMed
    1. Ghazarian AA, Kelly SP, Altekruse SF, Rosenberg PS, McGlynn KA. Future of testicular germ cell tumor incidence in the United States: Forecast through 2026. Cancer. 2017;123:2320–2328. doi: 10.1002/cncr.30597. - DOI - PMC - PubMed
    1. Stang A, et al. Survival after a diagnosis of testicular germ cell cancers in Germany and the United States, 2002–2006: a high resolution study by histology and age. Cancer Epidemiol. 2013;37:492–497. doi: 10.1016/j.canep.2013.03.017. - DOI - PMC - PubMed
    1. Cheng L, et al. Testicular cancer. Nat. Rev. Dis. Prim. 2018;4:29. doi: 10.1038/s41572-018-0029-0. - DOI - PubMed
    1. Chung P, Warde P. Testicular cancer: Seminoma. BMJ Clin. Evid. 2011;2011:1807. - PMC - PubMed

Publication types

Supplementary concepts