. 2024 Jan;625(7995):578-584.
doi: 10.1038/s41586-023-06856-1. Epub 2023 Dec 20.

The PfRCR complex bridges malaria parasite and erythrocyte during invasion

Affiliations

The PfRCR complex bridges malaria parasite and erythrocyte during invasion

Brendan Farrell et al. Nature. 2024 Jan.

Abstract

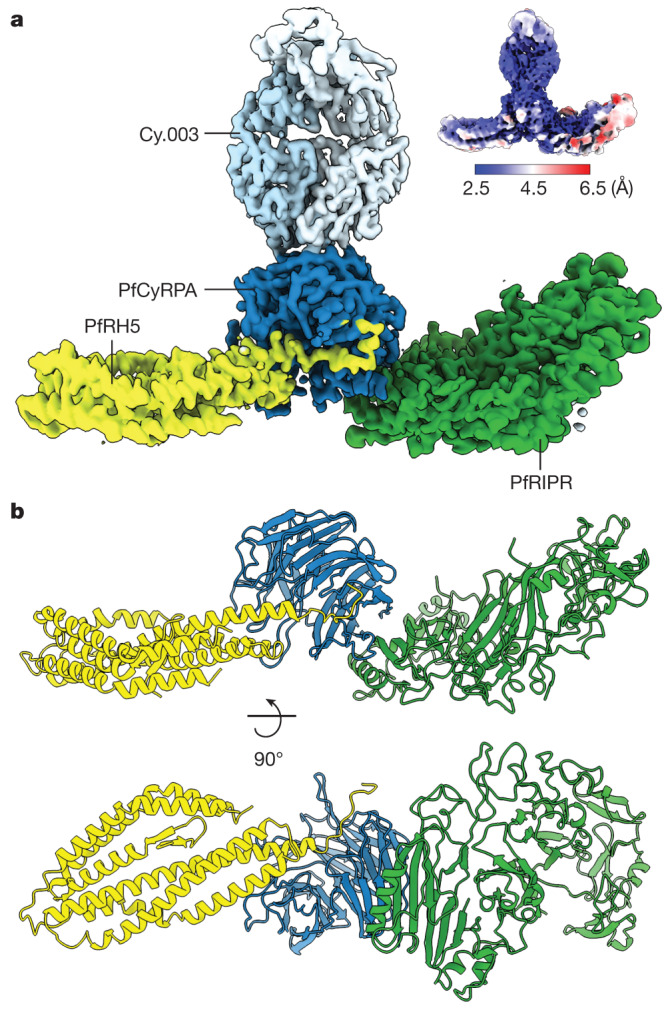
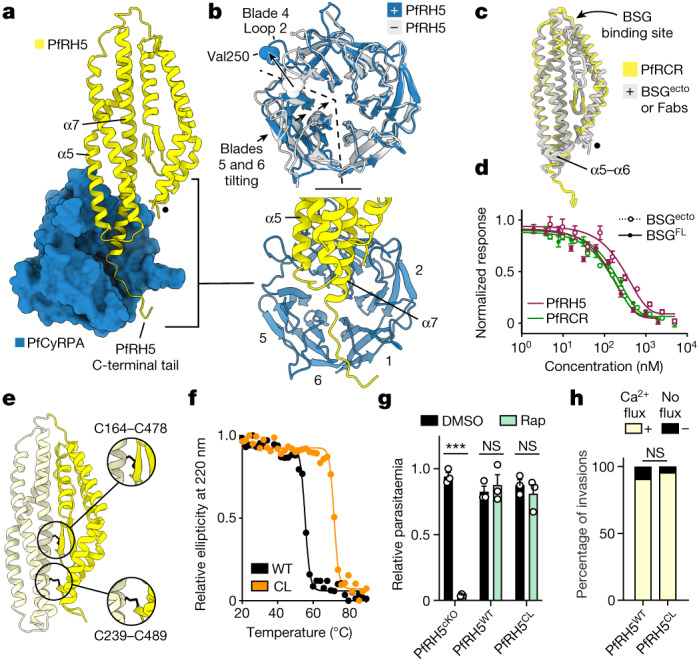
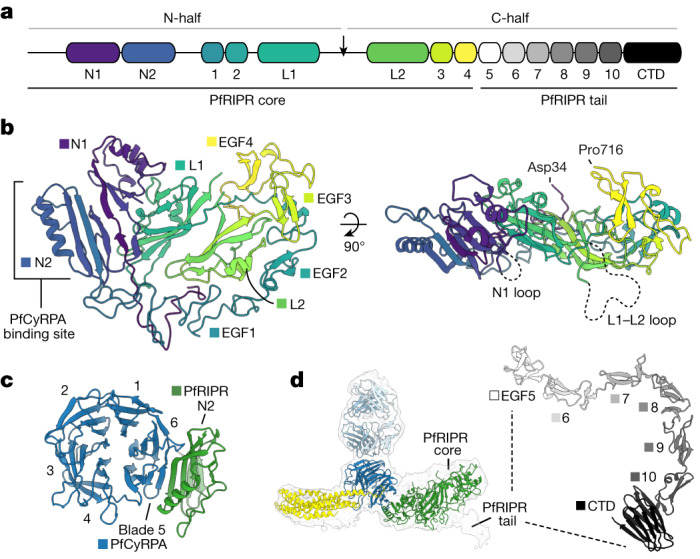
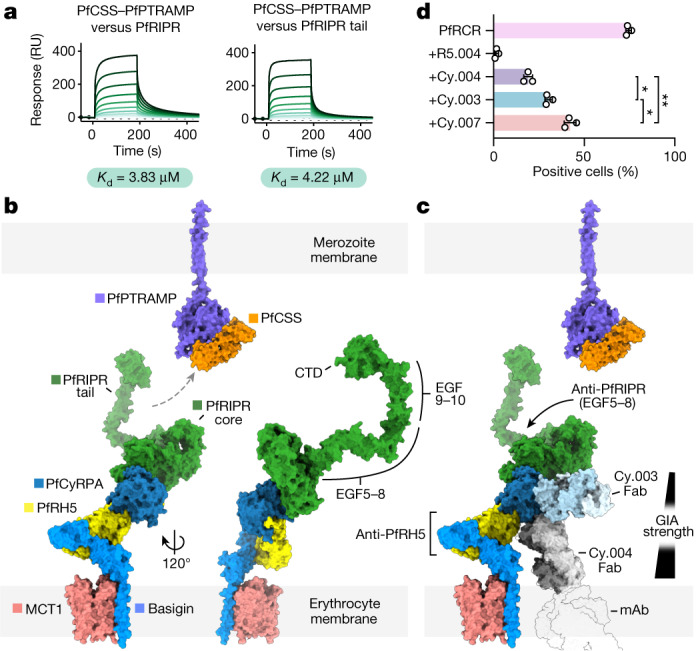
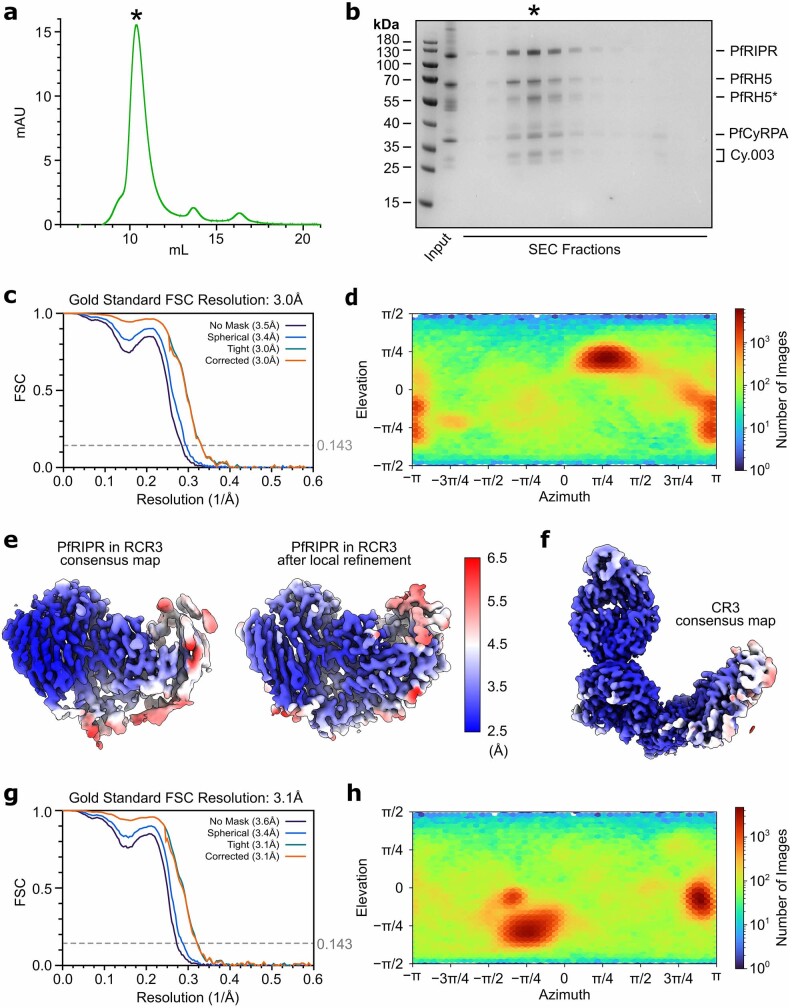
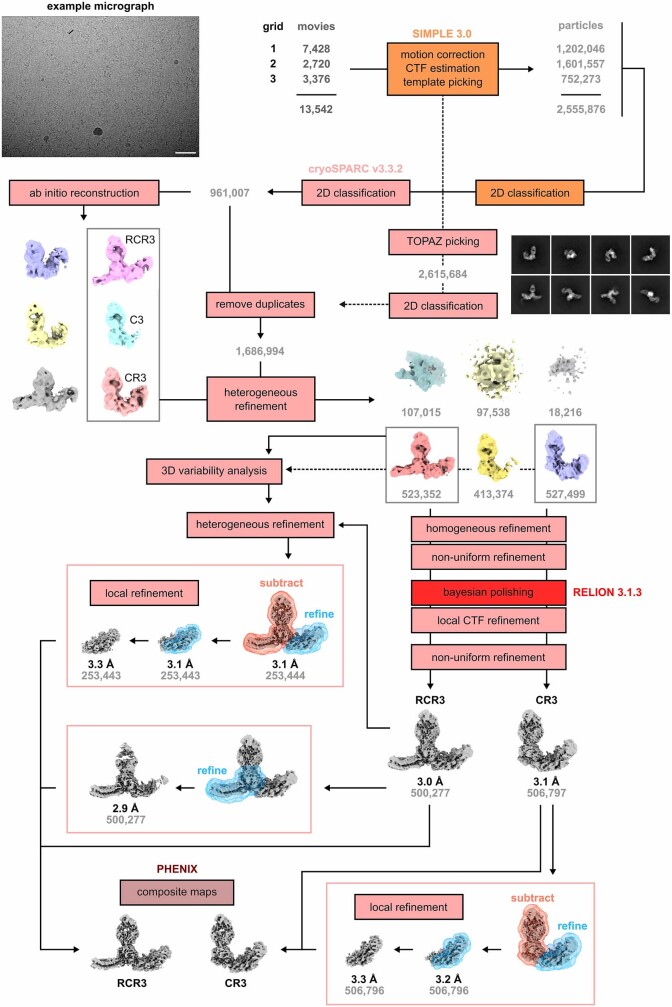
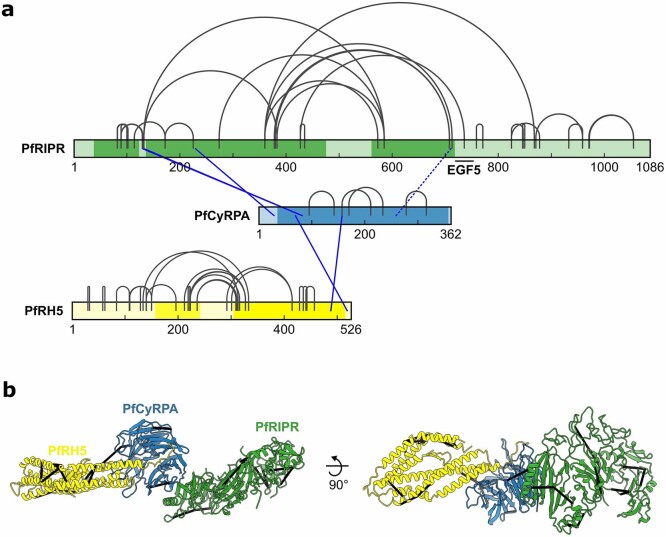
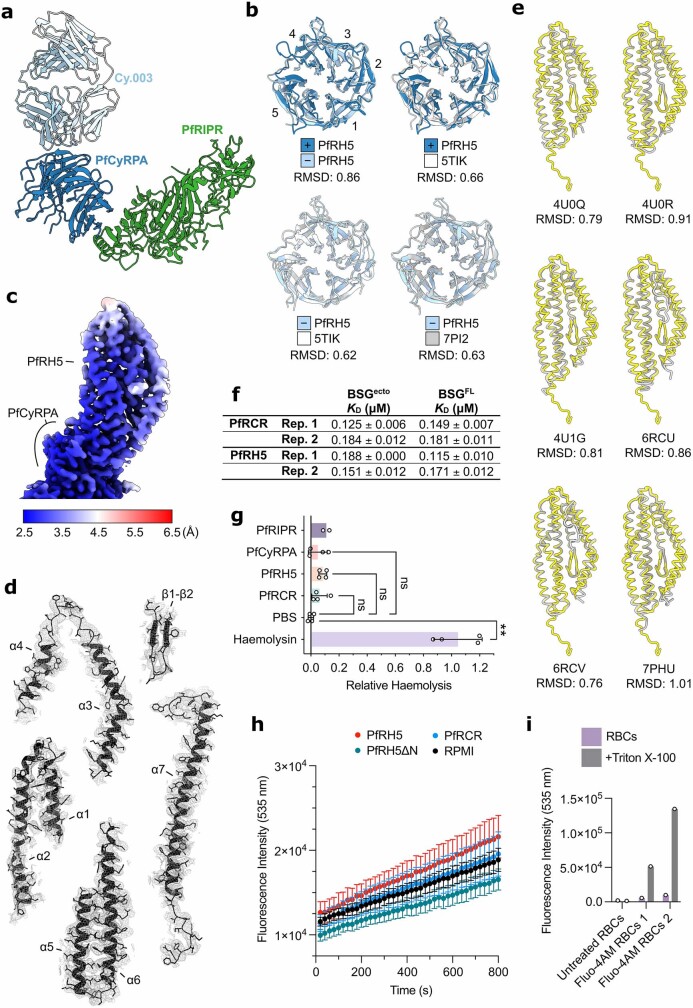
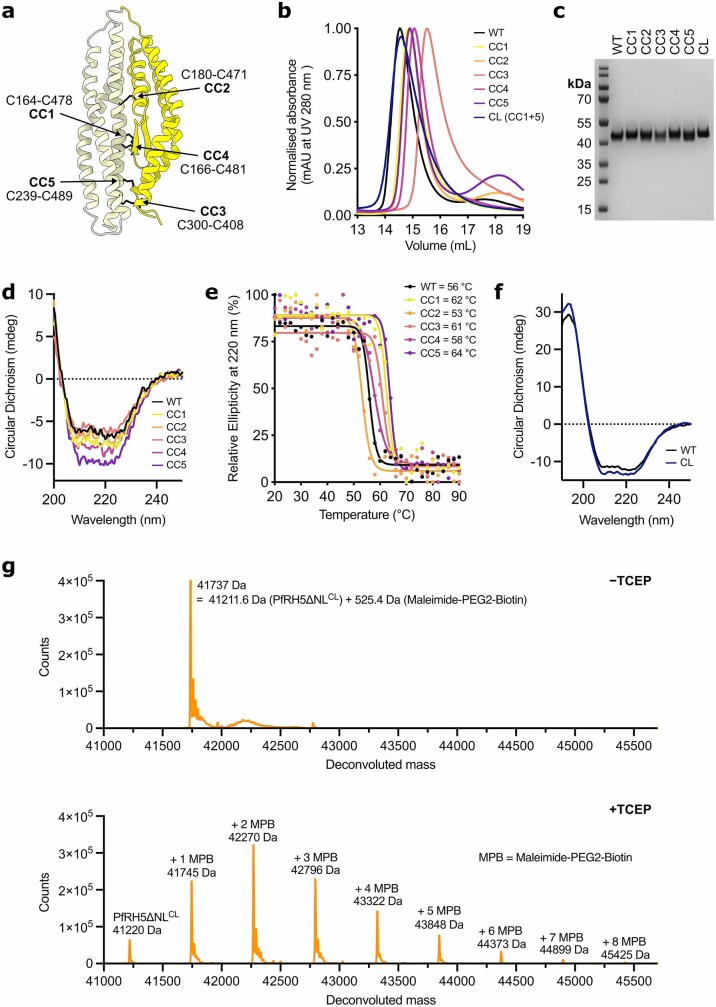
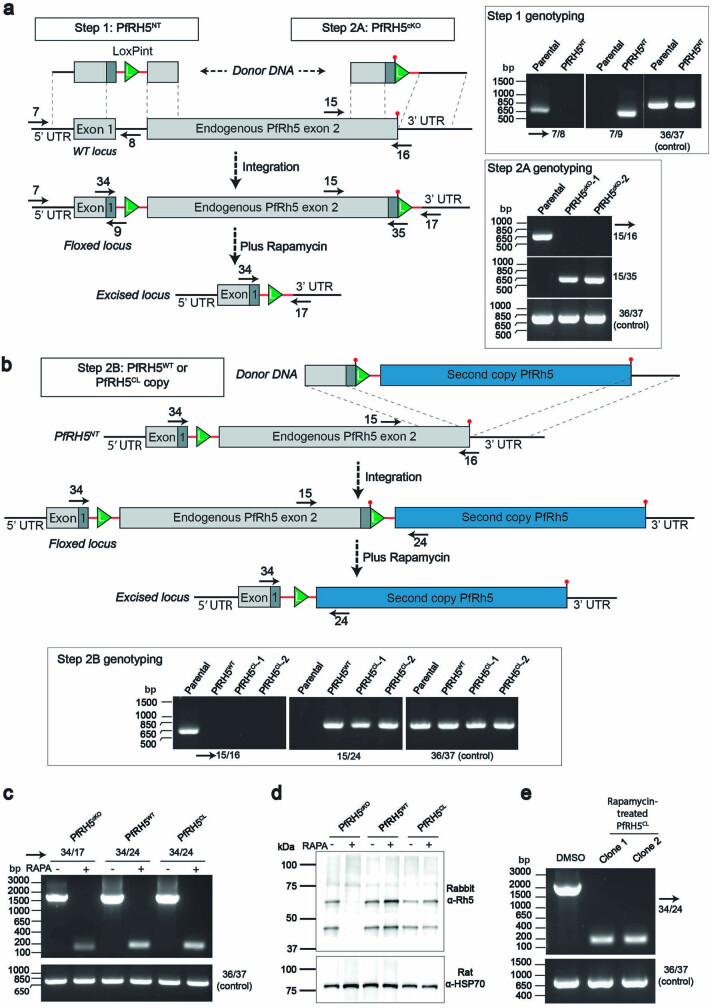
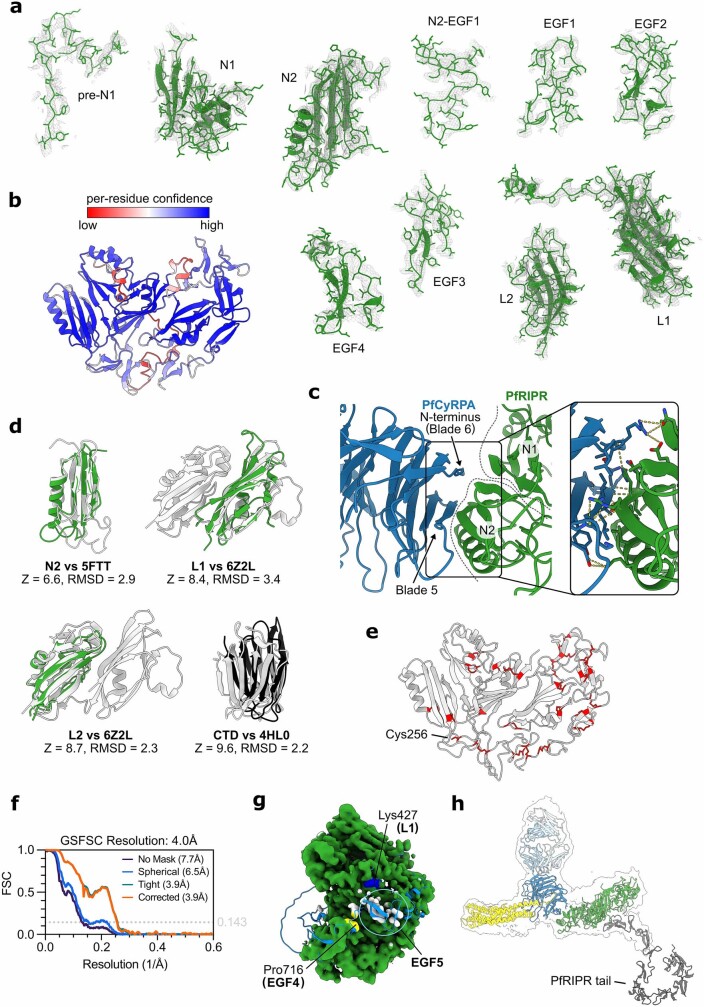
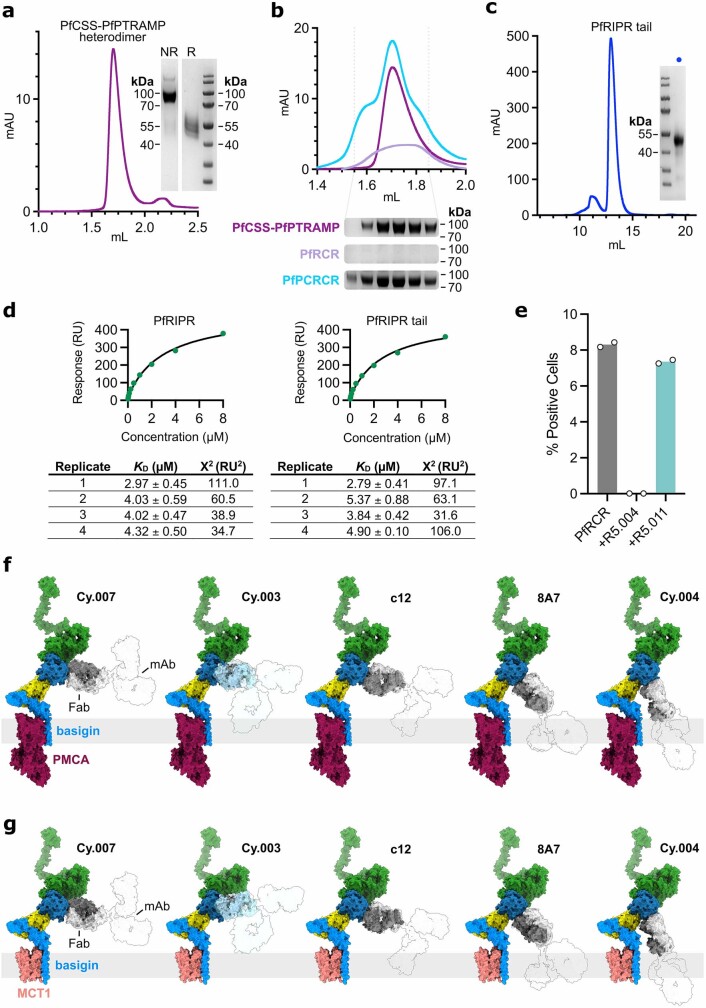
The symptoms of malaria occur during the blood stage of infection, when parasites invade and replicate within human erythrocytes. The PfPCRCR complex1, containing PfRH5 (refs. 2,3), PfCyRPA, PfRIPR, PfCSS and PfPTRAMP, is essential for erythrocyte invasion by the deadliest human malaria parasite, Plasmodium falciparum. Invasion can be prevented by antibodies3-6 or nanobodies1 against each of these conserved proteins, making them the leading blood-stage malaria vaccine candidates. However, little is known about how PfPCRCR functions during invasion. Here we present the structure of the PfRCR complex7,8, containing PfRH5, PfCyRPA and PfRIPR, determined by cryogenic-electron microscopy. We test the hypothesis that PfRH5 opens to insert into the membrane9, instead showing that a rigid, disulfide-locked PfRH5 can mediate efficient erythrocyte invasion. We show, through modelling and an erythrocyte-binding assay, that PfCyRPA-binding antibodies5 neutralize invasion through a steric mechanism. We determine the structure of PfRIPR, showing that it consists of an ordered, multidomain core flexibly linked to an elongated tail. We also show that the elongated tail of PfRIPR, which is the target of growth-neutralizing antibodies6, binds to the PfCSS-PfPTRAMP complex on the parasite membrane. A modular PfRIPR is therefore linked to the merozoite membrane through an elongated tail, and its structured core presents PfCyRPA and PfRH5 to interact with erythrocyte receptors. This provides fresh insight into the molecular mechanism of erythrocyte invasion and opens the way to new approaches in rational vaccine design.


Conflict of interest statement

M.K.H. and S.J.D. are named inventors on patents related to the use of PfRH5 as a vaccine (no. GB2105/052205), to the design of a thermally stabilized version of PfRH5 for use as a vaccine (no. GB2017/052608) and to mABs targeting PfRH5 (no. GB2019/052885). B.F., N.A., M.N.H., A.J., R.J.R., H.W.-M. and E.K. declare no competing interests.

Figures

Fig. 1
Fig. 1. Structure of the PfRCR complex.
a, Composite map of the PfRCR–Cy.003 complex, following local refinement of the consensus map and postprocessing with DeepEMhancer. Densities corresponding to PfRH5 (yellow), PfCyRPA (dark blue), PfRIPR (green) and Cy.003 (light blue) are highlighted. Inset at top right is the unsharpened consensus map before local refinement, coloured by local resolution. b, Structure of the PfRCR complex in cartoon representation, coloured as in a. Cy.003 is omitted for clarity.
Fig. 2
Fig. 2. PfRH5 is a rigid component of PfRCR that does not open during invasion.
a, The interface between PfRH5 (yellow cartoon) and PfCyRPA (blue surface). PfCyRPA blade 1 corresponds to Ile49–Lys95. The internal α2–α3 loop of PfRH5, unresolved in these data, is indicated by a black dot. Inset lower right, the interface between PfRH5 and PfCyRPA, with the blades of PfCyRPA labelled. b, Overlay of PfCyRPA from PfRCR–Cy.003- (blue) and Cy.003-bound PfCyRPA (grey; PDB: 7PI2), showing changes induced by PfRH5 binding. Val250 is shown as spheres. c, Overlay of PfRH5 from PfRCR–Cy.003 (yellow) and previous structures of PfRH5 bound to either BSGecto (PDB: 4U0Q) or anti-PfRH5 Fab fragments (PDBs: 4U0R, 4U1G, 6RCU, 6RCV and 7PHU) (grey). d, Microscale thermophoresis responses showing equivalent binding of BSGecto (dotted lines) and BSGFL (full lines) to PfRH5 (maroon) and PfRCR (green); n = 2 biologically independent samples (one shown), both measured in triplicate. Mean plus or minus s.d. is shown. e, Model of the designed PfRH5CL and its disulfide bonds (black), which lock together N-PfRH5 (dark yellow) and C-PfRH5 (light yellow). f, PfRH5CL (orange) shows improved thermal stability compared with PfRH5WT (black), as measured by circular dichroism. g, Conditional rapamycin (Rap)-induced knockout of PfRH5 (PfRH5cKO) reduced parasitaemia (***P < 0.001) but replacement with PfRH5WT or PfRH5CL did not (P = 0.599 and P = 0.457, respectively, two-tailed unpaired t-test); n = 3 biologically independent samples, each measured in triplicate. Mean plus or minus s.e.m. is shown. h, Percentage of invasion events by WT or PfRH5CL parasites, showing a calcium flux (yellow) or no flux (black). No significant difference was observed (P = 0.68, two-tailed Fisher’s exact test); n = 41 invasion events for both PfRH5WT and PfRH5CL parasites from three biological replicates. NS, not significant. Source Data
Fig. 3
Fig. 3. The structure of PfRIPR.
a, The domain architecture of PfRIPR. The PfRIPR core comprises the N terminus to EGF-like domain 4, and its tail comprises EGF-like domain 5 to the C terminus. In addition to the ten previously known EGF-like domains, PfRIPR contains two N-terminal domains (N1 and N2), two lectin-like domains (L1 and L2) and a CTD. PfRIPR is cleaved at a site in the L1–L2 loop to produce its N- and C-halves, indicated by an arrow. b, Structure of the PfRIPR core (residues Asp34–Pro716) coloured sequentially from its N terminus (blue) to C terminus (yellow), as in a. The location of the PfCyRPA-binding site on domain N2, and the unresolved N1 loop (residues 124–137) and L1–L2 loop (residues 479–557), are shown. c, A view of the interface between PfCyRPA and PfRIPR, illustrating the extended β-sheet between PfCyRPA blade 5 and PfRIPR domain N2, plus some interactions with the helix of N2. Only domain N2 of PfRIPR is shown, for clarity. d, The 4.0 Å unsharpened map of the PfRCR–Cy.003 complex containing additional density for the beginning of the PfRIPR tail. The AlphaFold2 prediction of the PfRIPR tail is shown (right), with EGF-like domains and the CTD labelled and coloured in greyscale as in a. Source Data
Fig. 4
Fig. 4. The PfPCRCR complex bridges the parasite and erythrocyte membranes.
a, The PfCSS–PfPTRAMP complex binds to full-length PfRIPR and its tail with equal affinity, as measured by surface plasmon resonance; n = 4 independent experiments (one shown). RU, response units. The binding affinity given is the mean of those determined by steady-state analysis of each independent measurement (Extended Data Fig. 8d). b, Composite model of the PfRCR complex on the erythrocyte membrane, illustrating how the tail of PfRIPR projects towards the merozoite membrane where PfCSS–PfPTRAMP is located. EGF-like domains 5–8 and 9–10 and the CTD of PfRIPR are highlighted. The composite PfRCR complex model is aligned onto the structure of basigin-bound MCT1 (PDB: 7CKR). For illustrative purposes only, the AlphaFold2-predicted structure of PfPTRAMP (magenta, AlphaFoldDB: Q8I5M8, residues 26–352) and the crystal structure of PfCSS (orange, PDB: 7UNY) are docked together. c, Mapping of growth-inhibitory antibodies targeting PfRCR components in the context of erythrocyte binding. The potency of growth-inhibitory PfCyRPA-targeting antibodies correlates with their proximity to the erythrocyte membrane, illustrated by overlay of Cy.004 Fab-bound PfCyRPA (PDB: 7PHW) onto PfRCR–Cy.003. The approximate location of the Fc portion of the intact monoclonal antibody is shown as a faint silhouette through overlay of the crystal structure of an intact antibody (PDB: 1IGT). Growth-inhibitory PfRIPR-targeting antibodies bind to EGF-like domains 5–8, located distal to the erythrocyte membrane. d, The ability of PfRCR to bind to human erythrocytes, either alone or in the presence of twofold molar excess of antibodies R5.004, Cy.003, Cy.004 and Cy.007, expressed as a percentage of PfRCR-positive cells; n = 3 independent measurements; mean plus or minus s.d. is shown; P = 0.0132 for Cy.003 versus Cy.004, P = 0.0418 for Cy.003 versus Cy.007 and P = 0.0023 for Cy.004 versus Cy.007 (one-way Brown–Forsythe and Welch analysis of variance adjusted for multiple comparisons with Dunnett T3). Source Data
Extended Data Fig. 1
Extended Data Fig. 1. Purification of PfRCR-Cy.003 complex and cryo-EM processing statistics.
a, Size exclusion chromatography profile and b, Reducing SDS-PAGE gel for the reconstituted PfRCR-Cy.003 complex, representative of five independent experiments. The fraction labelled with an asterisk corresponds to the region highlighted on the size exclusion chromatography profile in panel a containing the PfRCR-Cy.003 complex. Both full-length PfRH5 and truncated PfRH5 (PfRH5*) were observed in the purified complex. c, Gold-standard Fourier shell correlation curves of the consensus PfRCR-Cy.003 reconstruction. d, Particle view distribution of the consensus PfRCR-Cy.003 reconstruction. e, Map regions corresponding to PfRIPR in the consensus PfRCR-Cy.003 reconstruction and following local refinement, showing improvement in map quality. Both maps are coloured by local resolution and post-processed with DeepEMhancer. f, Consensus map of the PfCyRPA-PfRIPR-Cy.003 (CR3) complex, post-processed with DeepEMhancer, and coloured by local resolution as in (e). g, Gold-standard Fourier shell correlation curves of the consensus PfCyRPA-PfRIPR-Cy.003 reconstruction. h, Particle view distribution of the consensus PfCyRPA-PfRIPR-Cy.003 reconstruction. Source Data
Extended Data Fig. 2
Extended Data Fig. 2. Workflow for cryo-EM data processing.
Movies from three grids of the same PfRCR-Cy.003 sample were pre-processed separately in SIMPLE 3.0, followed by template-based particle picking in SIMPLE 3.0 and TOPAZ particle picking in cryoSPARC v3.3.2. After 2D classification and removal of duplicate particles, the cleaned particle stack was subject to heterogeneous refinement using maps for PfRCR-Cy.003 (RCR3), PfCyRPA-PfRIPR-Cy.003 (CR3) and PfCyRPA-Cy.003 (C3) complexes from ab initio reconstructions and three decoy volumes. Particle stacks corresponding to RCR3 and CR3 complexes were then separately refined in 3D space, then after Bayesian polishing in RELION 3.1.3 and local CTF refinement in cryoSPARC v3.3.2, subjected to a final non-uniform refinement to obtain consensus maps for each complex. Each map was further locally refined to improve the maps of PfRH5 and PfRIPR respectively using soft masks around the proteins of interest, and with signal subtraction for PfRIPR local refinements. Composite maps were generated using PHENIX. The micrograph shown is representative of 13,542 micrographs. The scale bar corresponds to 50 nm.
Extended Data Fig. 3
Extended Data Fig. 3. Crosslinking mass spectrometry of the PfRCR complex.
a, Crosslinks found between PfRIPR, PfCyRPA and PfRH5 after incubating the reconstituted PfRCR complex with the crosslinker DSSO. Inter-protein crosslinks are blue and intra-protein crosslinks are grey. Crosslinks that are inconsistent with the PfRCR complex structure (with a Cα-Cα distance greater than 35 Å) are indicated by dashed lines. The regions of PfRIPR, PfCyRPA and PfRH5 built in the PfRCR structure are highlighted by a darker tone. The location of EGF5 in PfRIPR is indicated to highlight the intra-PfRIPR crosslink supporting the proposed location of this domain in the PfRIPR structure. Prepared using xiNET. b, Crosslinks with a Cα-Cα distance less than 35 Å mapped on to the PfRCR complex structure.
Extended Data Fig. 4
Extended Data Fig. 4. Comparison of PfRH5 and PfCyRPA structures and assessment of PfRH5 function.
a, Structure of the PfCyRPA-PfRIPR-Cy.003 complex in cartoon representation, with PfRIPR (green), PfCyRPA (blue) and Cy.003 Fab (light blue) highlighted. b, Structural alignments of PfCyRPA from PfRCR-Cy.003 (dark blue), PfCyRPA-PfRIPR-Cy.003 (light blue), Cy.003-bound PfCyRPA (grey, PDB ID: 7PI2), and unbound PfCyRPA (white, PDB ID: 5TIK), with backbone RMSDs to each pair given below. Blades 1 through 5 are labelled. c, Cryo-EM map of PfRH5 following local refinement, post-processed by DeepEMhancer and coloured by local resolution. d, PfRH5 split into secondary structure elements, shown with their corresponding cryo-EM densities using the composite PfRCR-Cy.003 map post-processed with DeepEMhancer. e, Structural alignment of PfRH5 from PfRCR-Cy.003 (yellow) with crystal structures (grey) of basigin-bound (PDB ID: 4U0Q) or Fab-bound PfRH5 (PDB IDs: 4U0R, 4U1G, 6RCU, 6RCV, 7PHU),. Backbone RMSDs between PfRCR-Cy.003 and each crystal structure are given below. f, Binding affinity measurements for PfRCR and PfRH5 binding to basigin ectodomain (BSGecto) and full-length basigin (BSGFL) determined by microscale thermophoresis. Values determined from two independently prepared samples are provided. Each of these was measured three times. g, Relative haemolysis following the incubation of red blood cells with 2 µM of either PfPIPR, PfCyRPA, PfRH5, PfRCR or alpha-haemolysin, or with PBS alone. Only haemolysis induced by alpha-haemolysin is significantly greater than observed with PBS alone (p = 0.0016 for PBS vs Haemolysin, whereas p = 0.3207 for PBS vs PfRH5, p = 0.8673 for PBS vs PfRCR, and p > 0.9999 for PBS vs PfCyRPA, determined using a Kruskal-Wallis one-way ANOVA adjusted for multiple comparisons using Dunn’s test. N = 2 for PfRIPR (and therefore no statistical analysis has been performed) and n = 4 for all others. Individual data points, the mean +/− SD are shown. h, Raw fluorescence intensity measured at 535 nm after incubation of Fluo-4 loaded red blood cells (RBCs) with PfRH5, PfRH5ΔN, PfRCR, or RPMI alone. The mean +/− SEM for a technical triplicate are shown. i, Raw fluorescence intensity measured at 535 nm of untreated and Fluo-4AM treated RBCs, alone or following addition of 0.1% v/v Triton X-100, demonstrating successful loading of Fluo-4 (N = 1 for untreated RBCs and n = 2 for Fluo-4AM treated RBCs). Source Data
Extended Data Fig. 5
Extended Data Fig. 5. Design, expression and characterisation of cysteine-locked PfRH5.
a, PfRH5 in cartoon showing the location of the five designed disulphide bonds (CC1 to CC5, black sticks), joining the N-terminal (dark yellow) and C-terminal (light yellow) halves of PfRH5. b, Gel filtration traces of purified wild-type PfRH5ΔNL (a construct lacking the unstructured N-terminus and α2-α3 loop of PfRH5) and the cysteine-locked PfRH5 designs (CC1 to CC5) following expression in Drosophila S2 cells. c, SDS-PAGE gel of purified wild-type and single cysteine-locked variants (CC1 to CC5) and the double cysteine-locked (PfRH5CL, which combines crosslinks CC1 and CC5) version of PfRH5ΔNL. CC1 to CC5 were each expressed and purified once, while PfRH5CL is representative of 3 independent samples. d, Single circular dichroism traces of wild-type and cysteine-locked variants of PfRH5ΔNL at 20 °C from their respective temperature ramps. e, Relative ellipticity at 220 nm versus temperature, and the calculated melting temperature of wild-type and cysteine-locked variants of PfRH5ΔNL. f, Circular dichroism traces of purified wild-type and the double cysteine-locked PfRH5ΔNL (PfRH5ΔNLCL). g, Intact mass spectrometry analysis of PfRH5ΔNLCL following maleimide-PEG-biotin labelling in the absence (top) and the presence of TCEP (bottom). Unlabelled PfRH5ΔNLCL has a theoretical mass of 41211.6 Da and +526 Da mass differences correspond to a maleimide-PEG2-biotin addition to cysteine residues. Source Data
Extended Data Fig. 6
Extended Data Fig. 6. Generation of PfRH5 conditional knockout and complemented parasites.
a, Schematic illustrating generation of transgenic rapamycin-inducible PfRH5cKO line through the successive introduction of 5’ LoxPint (Step 1, generating line PfRH5NT) followed by 3’ LoxPint site (Step 2 A), resulting in floxed exon 2 of PfRh5 (line PfRH5cKO). Genotyping PCRs are shown (inset on right). One clone of PfRH5NT and two clones of PfRH5cKO parasites were generated. Solid black arrows indicate position of primers used to screen by PCR for integration of LoxP sites, which was done once. Primers are numbered as in Supplementary Table 1. b, Schematic illustrating the introduction of a second, complementary copy of PfRH5 (either PfRH5WT or PfRH5CL) 3’ to endogenous PfRH5. The donor DNA included 548 bp of 3’ end of endogenous PfRH5 followed by a small recodonised sequence, part of LoxPint, the second copy, and finally, 591 bp of endogenous 3’UTR. This design allowed for inducible complementation such that after rapamycin induced excision, only the complementary copy of PfRH5 was expressed. PCR genotyping of Step 2B is shown in inset. One clone of PfRH5WT and two clones of PfRH5CL parasites were generated. For schematics in both a and b, green triangles represent LoxP DNA sequence; red lines represent sera2 intron sequence; dark grey shaded boxes represent recodonised pieces of DNA. c, Genotyping PCR demonstrating that rapamycin induced excision of endogenous PfRH5 exon 2. Data shown is representative of two biological repeats. d, Anti-PfRH5 western blotting demonstrating ablation of PfRH5 expression for rapamycin treated PfRH5cKO parasites or expression of a complementary copy of PfRH5 for PfRH5WT and PfRH5CL lines. Hsp70 was used as a loading control. Data shown is representative of three biological repeats. e, Rapamcyin treated PfRH5CL parasites could be cloned by limiting dilution and maintained in culture. Primers used in PCR genotyping are listed in Supplementary Table 1 and the expected PCR product sizes in Supplementary Table 2. This was done once. For each set of PCR reactions, control primers 36/37 were used to amplify a 737 bp product from the PfRON2 locus.
Extended Data Fig. 7
Extended Data Fig. 7. The PfRIPR core and generating a composite model of full-length PfRIPR.
a, Domains of PfRIPR with their corresponding cryo-EM density using the PfRCR-Cy.003 composite map post-processed with DeepEMhancer. b, AlphaFold2 prediction of PfRIPR residues 19–716 (except 484–548) coloured by pLDDT score. The regions of low confidence in this model correlate with those that required de novo building guided by the AlphaFold2 prediction. c, The interface between PfRIPR and PfCyRPA comprises backbone and side chain interactions between residues of domains N1 and N2 of PfRIPR (green) and blades 5 and 6 of PfCyRPA (blue). Each are shown as cartoons with side chains of interacting residues (detailed in Extended Data Table 4) shown as sticks in the expanded section. Hydrogen bonds between residues are shown in yellow. d, Structural alignment of PfRIPR domains and their structural homologues with their DALI Z scores and RMSD scores. Structural homologues are identified by their PDB codes: 5FTT (lectin domain of Lactrophilin 3), 6Z2L (PfP113) and 4HL0 (Galectin). e, The PfRIPR core contains 23 disulphide bonds and one free cysteine (Cys256). Cysteine residues are shown as red sticks. f, Gold standard Fourier shell correlation (GSFSC) curves for the PfRCR-Cy.003 map containing additional density for the start of the PfRIPR tail. g, The PfRIPR portion of the composite PfRCR-Cy.003 map coloured green where a model of the PfRIPR core has been built. Uninterpretable density (coloured white) is observed in this map beyond domain EGF4 at Pro716 (yellow). An AlphaFold2 model of PfRIPR truncated after EGF5 (residues 20–769, light blue cartoon) predicts that this likely corresponds to EGF5. This is further supported by a chemical crosslink found between Lys736 of domain EGF5 and Lys427 of domain L1 (dark blue) in XL-MS analysis of the PfRCR complex (Extended Data Fig. 3). h, To generate a composite model of full-length PfRIPR, the AlphaFold 2 prediction of the PfRIPR tail (residues 717–1086) was docked onto the PfRIPR core using the 4.0 Å PfRCR-Cy.003 map containing additional PfRIPR density as a guide. Source Data
Extended Data Fig. 8
Extended Data Fig. 8. PfRIPR tail interacts with the PfCSS-PfPTRAMP complex, and the mapping of anti-PfCyRPA antibodies.
a, Gel filtration trace of the PfCSS-PfPTRAMP heterodimer with an SDS-PAGE gel inset right. SDS-PAGE fractions are shown for non-reduced (NR) and reduced (R) samples of the disulphide-linked heterodimer. Representative of three independent experiments. b, Gel filtration traces for PfCSS-PTRAMP complex (dark purple), PfRCR (light purple) and the mixture of the two complexes (blue). Underneath non-reducing SDS-PAGE gels show the corresponding fractions for the location of PfCSS-PfPTRAMP from the three experiments. Traces and gels are representative of two independent analyses. c, Gel filtration trace of recombinantly expressed PfRIPR tail with reducing SDS-PAGE gel of isolated PfRIPR tail shown inset right, representative of three independent samples. d, Representative steady state fit analysis of PfCSS-PfPTRAMP complex binding to full-length PfRIPR and PfRIPR tail by SPR. Binding analysis was completed four times. Inset below are the estimated binding affinity (KD) and the Chi fit for each repeat. e, FACS-based analysis of the binding of PfRCR complex to human erythrocytes in the presence of PfRH5-targeting antibodies R5.004 and R5.011. In each case, PfRCR was detected using an anti-C-tag nanobody targeting the affinity tag of the complex. Binding of the PfRCR complex is unaffected by the presence of R5.011. N = 2, individual data points, the mean +/- SD are shown. f, Composite model showing structural alignment of anti-PfCyRPA antibodies on to the PfRCR complex when bound to PMCA-bound basigin on the erythrocyte surface, with the rest of the antibodies modelled as faint silhouettes. Generated through alignment of the PfRCR-Cy.003 complex, Fab-PfCyRPA crystal structures (PDB IDs: 7PHV, 5EZO, 5TIH and 7PHW),,, an intact IgG crystal structure (PDB ID: 1IGT), and PMCA-bound basigin (PDB ID: 6A69). g, As in (f) except when PfRCR is bound to MCT1-bound basigin (PDB ID: 7CKR). Source Data

References

    1. Scally SW, et al. PCRCR complex is essential for invasion of human erythrocytes by Plasmodium falciparum. Nat. Microbiol. 2022;7:2039–2053. doi: 10.1038/s41564-022-01261-2. - DOI - PMC - PubMed
    1. Baum J, et al. Reticulocyte-binding protein homologue 5 – an essential adhesin involved in invasion of human erythrocytes by Plasmodium falciparum. Int. J. Parasitol. 2009;39:371–380. doi: 10.1016/j.ijpara.2008.10.006. - DOI - PubMed
    1. Wright KE, et al. Structure of malaria invasion protein RH5 with erythrocyte basigin and blocking antibodies. Nature. 2014;515:427–430. doi: 10.1038/nature13715. - DOI - PMC - PubMed
    1. Alanine DGW, et al. Human antibodies that slow erythrocyte invasion potentiate malaria-neutralizing antibodies. Cell. 2019;178:216–228. doi: 10.1016/j.cell.2019.05.025. - DOI - PMC - PubMed
    1. Ragotte RJ, et al. Heterotypic interactions drive antibody synergy against a malaria vaccine candidate. Nat. Commun. 2022;13:933. doi: 10.1038/s41467-022-28601-4. - DOI - PMC - PubMed

MeSH terms