. 2024 Jan;625(7994):401-409.
doi: 10.1038/s41586-023-06872-1. Epub 2023 Dec 20.

Emergence of replication timing during early mammalian development

Affiliations

Emergence of replication timing during early mammalian development

Tsunetoshi Nakatani et al. Nature. 2024 Jan.

Abstract

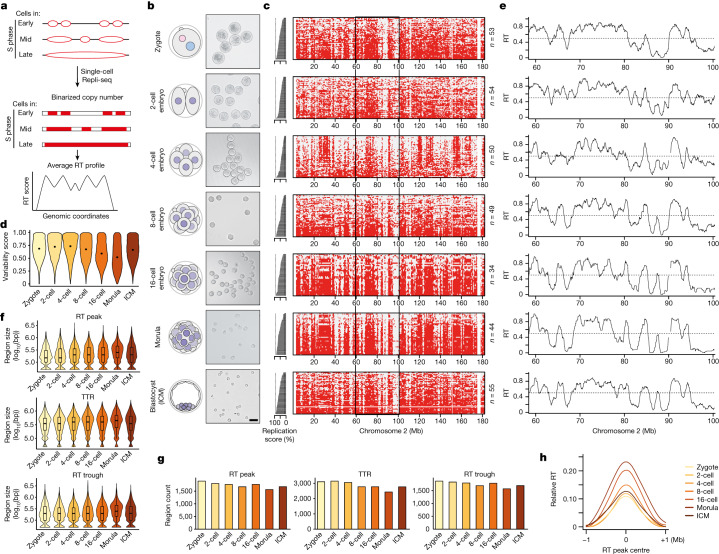
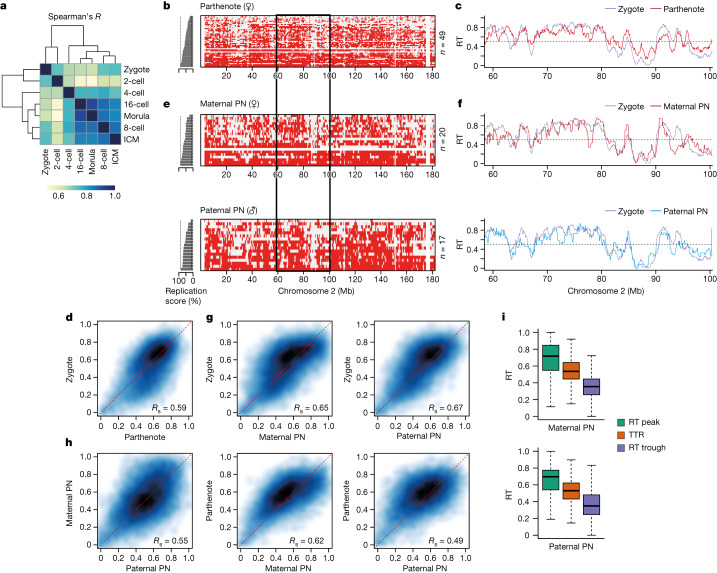
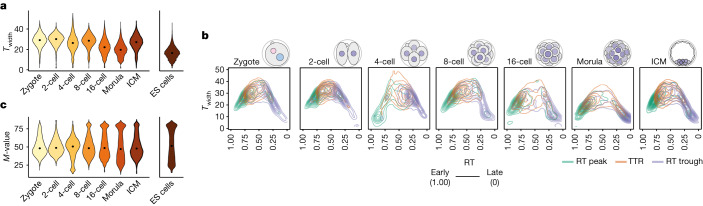
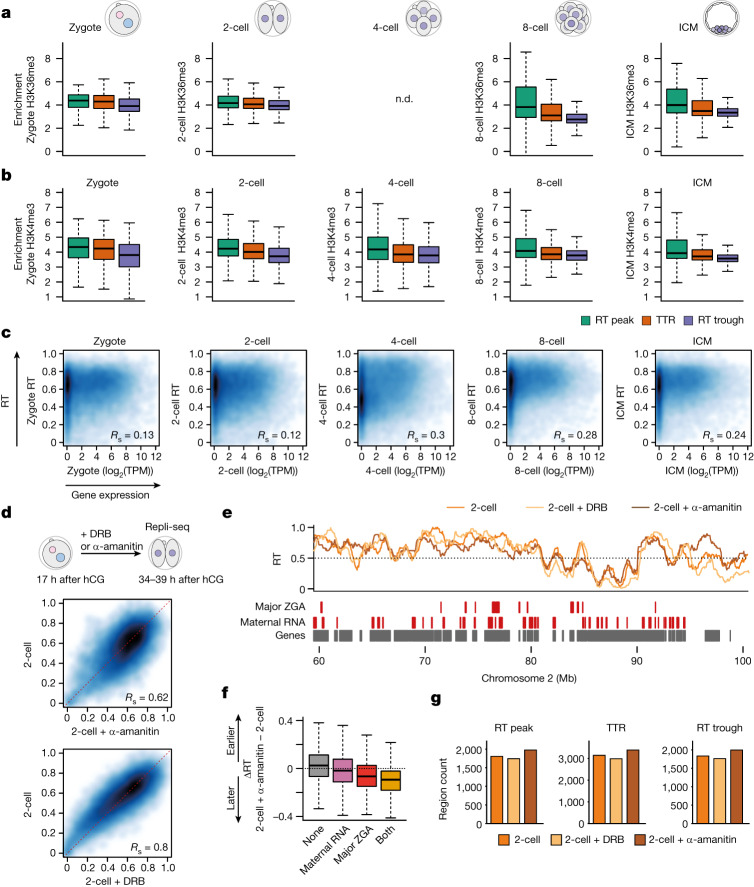
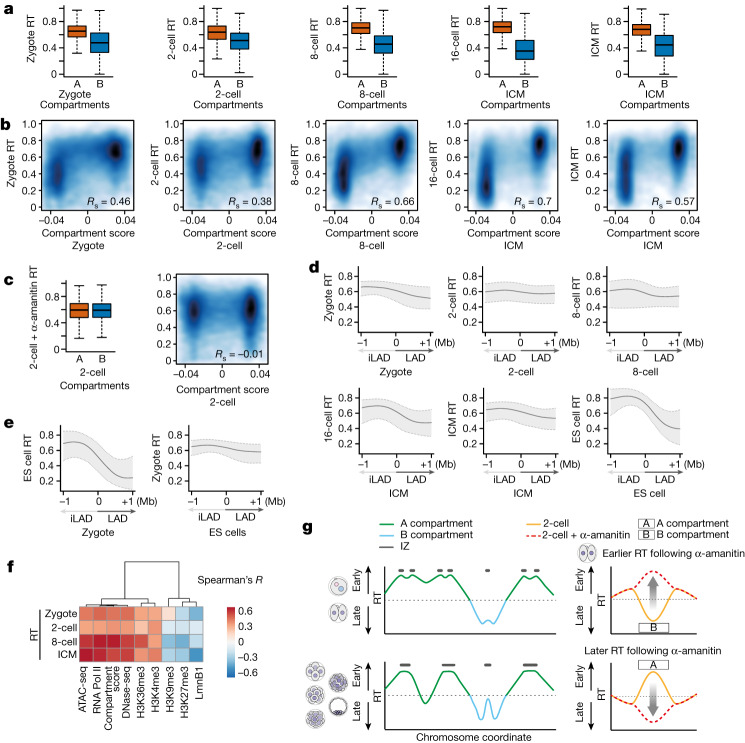
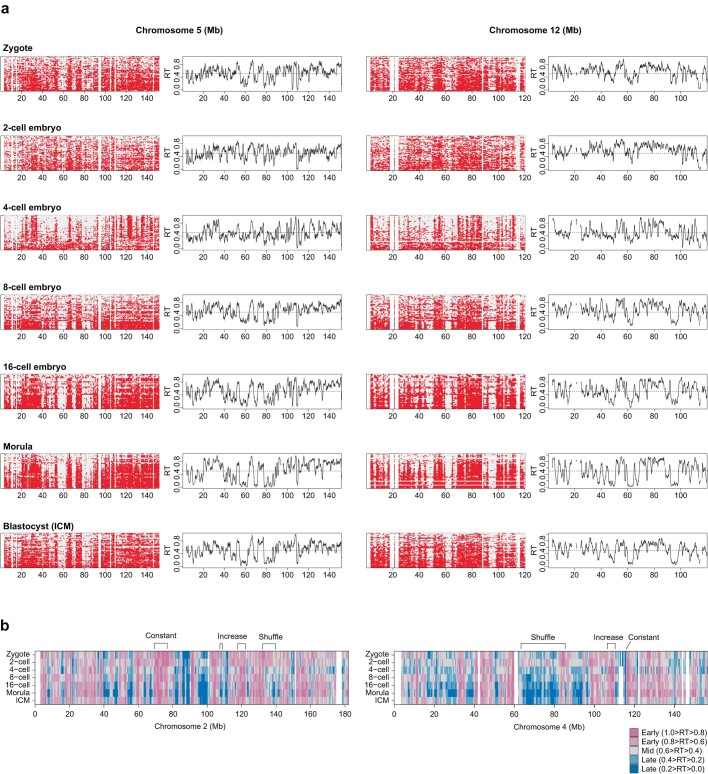
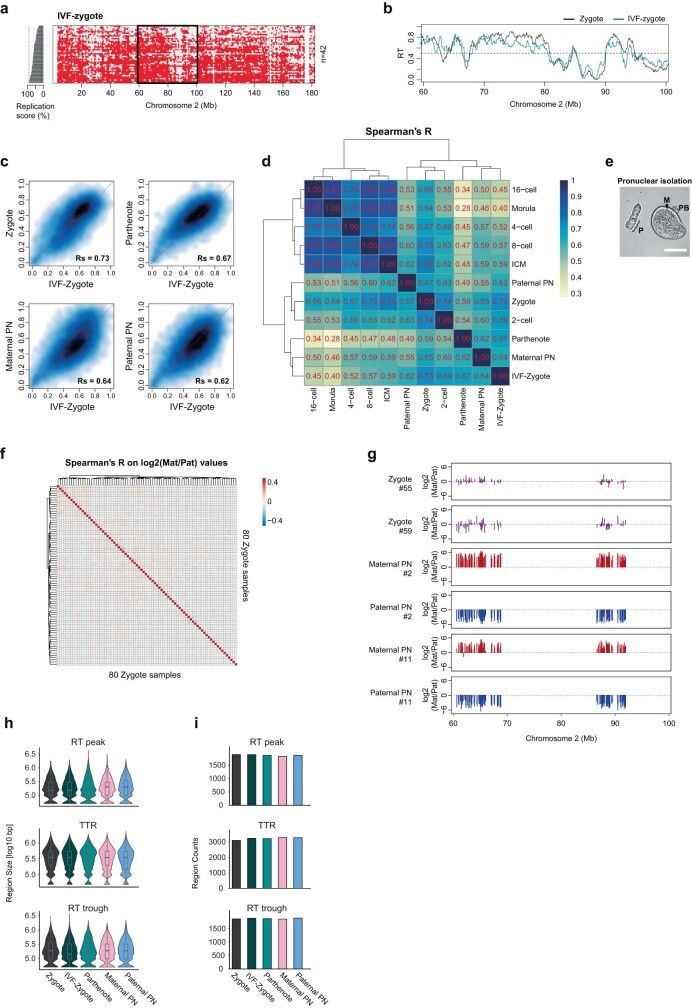
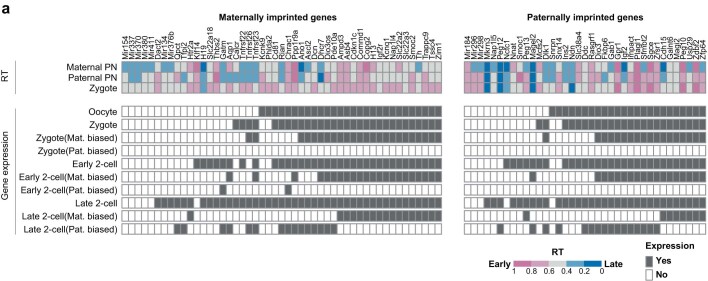
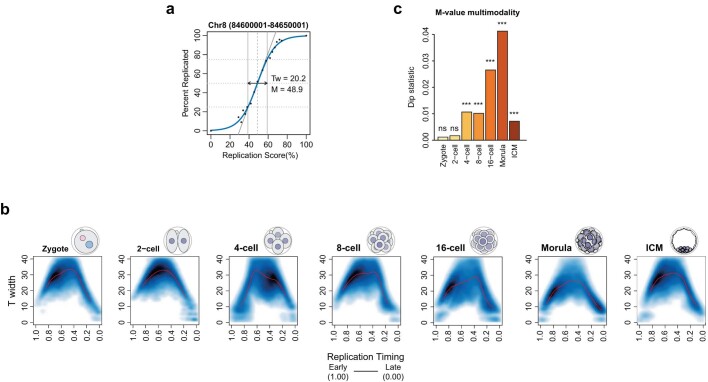
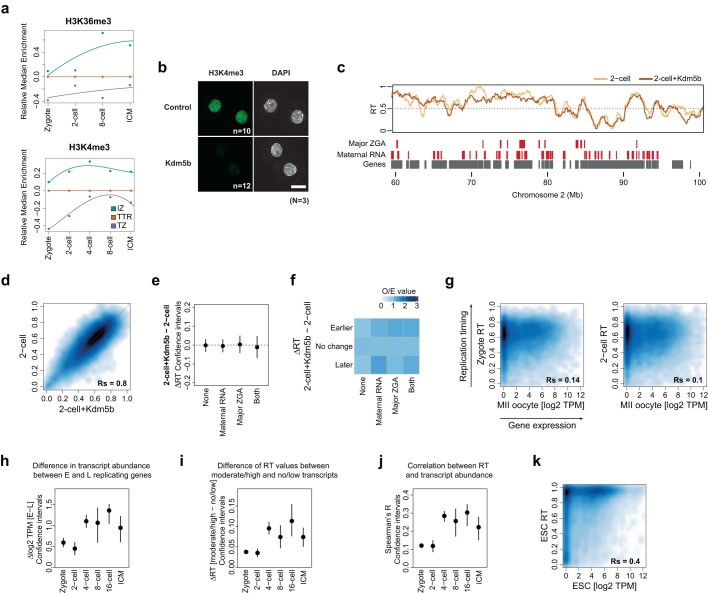
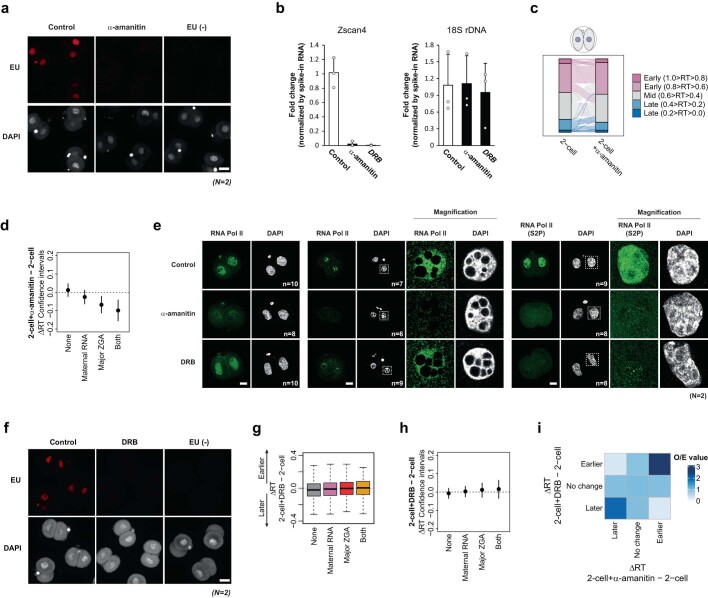
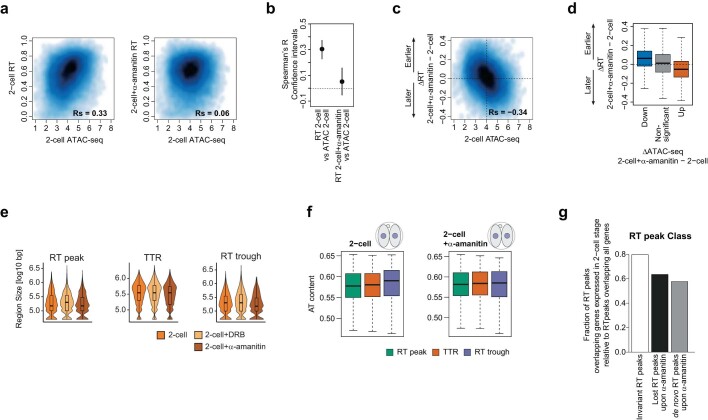
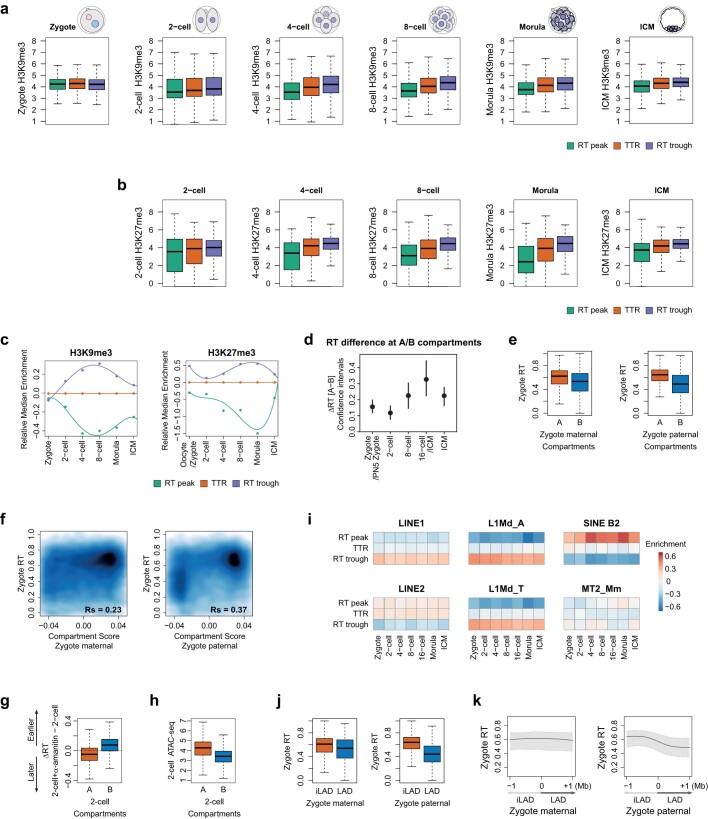
DNA replication enables genetic inheritance across the kingdoms of life. Replication occurs with a defined temporal order known as the replication timing (RT) programme, leading to organization of the genome into early- or late-replicating regions. RT is cell-type specific, is tightly linked to the three-dimensional nuclear organization of the genome1,2 and is considered an epigenetic fingerprint3. In spite of its importance in maintaining the epigenome4, the developmental regulation of RT in mammals in vivo has not been explored. Here, using single-cell Repli-seq5, we generated genome-wide RT maps of mouse embryos from the zygote to the blastocyst stage. Our data show that RT is initially not well defined but becomes defined progressively from the 4-cell stage, coinciding with strengthening of the A and B compartments. We show that transcription contributes to the precision of the RT programme and that the difference in RT between the A and B compartments depends on RNA polymerase II at zygotic genome activation. Our data indicate that the establishment of nuclear organization precedes the acquisition of defined RT features and primes the partitioning of the genome into early- and late-replicating domains. Our work sheds light on the establishment of the epigenome at the beginning of mammalian development and reveals the organizing principles of genome organization.


Conflict of interest statement

M.-E.T.-P. is a member of the ethics advisory panel of MERCK. The other authors declare no competing interests.

Figures

Fig. 1
Fig. 1. RT emerges gradually during mouse preimplantation development.
a, Overview of single-cell Repli-seq used to generate RT profiles from single cells in mouse preimplantation embryos based on copy number variation. b, Schematic of sampling of embryos and corresponding images of dissociated blastomeres at each stage. The numbers of independent blastomere collections for each stage with similar results are as follows: zygote (3), 2-cell (4), 4-cell (3), 8-cell (3), 16-cell (3), morula (2), ICM (4). Scale bar, 50 μm. c, Heatmaps of single cells indicating replication status based on binarized copy number during preimplantation embryogenesis (red, replicated; grey, not replicated). Cells are ranked by their percentage of replicated genome (replication score), which indicates progress in S phase and is plotted as a bar plot on the left. d, Variability score during embryonic development; the score is 1 when 50% of cells replicated the genomic bin and 0 when all cells are either replicated (100%) or non-replicated (0%). Each violin plot shows the distribution of scores for all genomic bins. e, RT profiles of preimplantation embryos over a representative region on chromosome 2, denoted by black rectangle in c. Black line indicates RT profiles, calculated as the average of overlapping intervals defined by genome-wide replication score. f,g, Size (f) and number (g) of replication features RT peaks (also known as initiation zones), and RT troughs (also known as termination zones) during preimplantation development. Box plots show median and interquartile range (IQR), and whiskers depict the lowest and highest values within 1.5× IQR. bp, base pair. h, Relative RT values centred at RT peaks during embryonic development compared with their neighbouring regions. Note that curves for the 2- and 4-cell stages overlap considerably and, to some extent, with that of zygotes.
Fig. 2
Fig. 2. RT in zygotes is less well defined compared with that in later embryonic stages and does not exhibit global allelic differences.
a, Correlation of genome-wide RT values between the indicated stages of preimplantation embryos using Spearman’s R. b,c, Characterization of RT in parthenogenetic zygotes. Heatmaps show replication states in parthenogenetic embryos (b) and corresponding average RT profiles (c). d, Smoothed scatterplot of RT values in normal versus parthenogenetic zygotes. Spearman’s correlation (Rs) is indicated. e,f, Characterization of RT in physically isolated maternal and paternal pronuclei (PN). Heatmaps show replication states in each pronucleus (e) and corresponding average RT profiles (f) of the chromosome 2 region, indicated by the black rectangle. g, Smoothed scatterplot of RT values in zygotes compared with isolated maternal and paternal pronuclei. Spearman’s correlation is indicated. h, Smoothed scatterplot of RT values comparing maternal or paternal pronucleus and parthenogenetic zygotes, as indicated. Spearman’s correlation is indicated. i, RT values of RT peaks, TTRs and RT troughs in isolated maternal and paternal pronuclei. Box plots show median and IQR, whiskers depict the lowest and highest values within 1.5× IQR.
Fig. 3
Fig. 3. RT heterogeneity decreases with developmental progression, and segregation between early and late RT values increases.
a, Violin plots showing relative RT heterogeneity (Twidth), which is the replication score difference between 25 and 75% of cells replicating the 50 kb bin, in embryonic development and in mouse embryonic stem (ES) cells. Dots indicate median. b, Contour plot showing Twidth along progression of RT in mouse embryos. RT peaks, TTRs and RT troughs are indicated. c, Violin plots showing RT mid-point value (M-value), which is the replication score at which 50% of cells replicated the 50 kb bin during embryonic development and in mouse ES cells. Dots indicate median.
Fig. 4
Fig. 4. Consolidation of RT is characterized by specific changes in histone modifications at RT troughs and RT peaks and is influenced by ZGA.
a, H3K36me3 coverage at the indicated replication features at different embryonic stages. b, H3K4me3 coverage at replication zones at each embryonic stage. c, Smoothed scatterplots showing correlation between RT values and transcript abundance (log2(TPM)) at the indicated embryonic stages. Spearman’s correlation is indicated. Note that Spearman’s R measures not only linear, but also monotonic, relationships and is robust to outliers. d, Smoothed scatterplots showing correlation of RT values between control 2-cell embryos and those treated with α-amanitin (top) or DRB (bottom). DRB or α-amanitin was applied continuously from the zygote stage (17 h after human chorionic gonadotropin (hCG)) until collection at the 2-cell stage, to block both minor and major ZGA, as indicated in the schematic. Spearman’s correlation is indicated. e, RT profiles of 2-cell embryos overlayed with those from α-amanitin- and DRB-treated 2-cell embryos. Genomic positions of indicated gene classes according to DBTMEE are shown as rectangles. f, Box plots showing the difference in RT values (ΔRT) between α-amanitin-treated and untreated 2-cell embryos at genomic bins overlapping only major ZGA genes, only maternal RNA genes or both gene classes compared with non-overlapping bins. g, Number of replication features in control 2-cell embryos and in embryos treated with α-amanitin or DRB. Box plots show median and IQR, whiskers depict the lowest and highest values within 1.5× IQR. n.d., not determined (data not available).
Fig. 5
Fig. 5. The distinctive RT between A and B compartments is dependent on ZGA, and three-dimensional genome organization precedes partitioning of early- and late-replication dynamics.
a, Box plots showing RT values in A and B compartments at the indicated stages. Note that, because HiC (high-throughput chromosome conformation capture) data for the 16-cell stage were unavailable, we used the closest developmental stage (ICM) for this comparison. b, Smoothed scatterplots showing correlation between RT values and compartment score at the indicated stages. Spearman’s correlation is indicated. c, Box plots showing RT values in A and B compartments (left) and correlation between RT values and compartment score (right) in α-amanitin-treated, 2-cell-stage embryos. d, Composite plots depicting RT values computed against LADs and iLADs at their corresponding developmental stage. Zero indicates the position of LAD–iLAD boundaries. Because DamID data for the 16-cell stage were not available, we used the closest developmental stage (ICM) for this comparison. e, Composite plots depicting RT values of mouse ES cells plotted against zygotic LADs (left) and RT values of zygotes against LADs in ES cells (right). Zero indicates the position of LAD–iLAD boundaries. d,e, Shading and lines indicate IQR and median, respectively. f, Correlation (Spearman’s R) heatmap between RT and distinctive chromatin features. When data for the same stage as RT are not available, those of the closest stage are used for analysis. g, Model summarizing our findings indicating progressive resolution of RT following the 2-cell stage. Left, RT peaks merge over time, resulting in changes in both number and size. Right, the effect of ZGA inhibition on RT and its relationship to A and B compartments. a,c, Box plots show median and IQR, whiskers depict the lowest and highest values within 1.5× IQR.
Extended Data Fig. 1
Extended Data Fig. 1. Quality control of scRepli-seq samples.
a. Scatter plots comparing the coefficient of variation calculated on the average read counts per chromosomes and the number of reads for each cell at the indicated embryonic stages. Horizontal and vertical lines indicate cutoffs for filtering cells. b. High concordance of replication state between with or without normalization by cells in G1. c. Comparison between two computational methods to calculate RT profiles. Shown are representative RT profiles derived from either raw or interval averaged replication timing values in the morula stage. d., e. Analysis of DNA replication in zygotes by EdU incorporation (d). Representative images of incorporated EdU and the corresponding quantifications are shown in e. Female and male pronuclei are indicated; the white dotted line depicts the nuclear periphery; note the EdU incorporation at the characteristic ring-shaped heterochromatic regions surrounding the nucleoli precursors between the 24 h and 26 h time. Approximate early, mid, and late S-phase times are indicated based on earlier work. Box plots show median of maximum intensity value and the interquartile range (IQR), whiskers depict the smallest and largest values within 1.5 ×IQR. n, and N, number of analysed embryos and number of independent biological replicates, respectively. Scale bar, 10 μm.
Extended Data Fig. 2
Extended Data Fig. 2. Heatmaps of replication status and RT profiles of preimplantation embryos over a representative region on Chromosome 5 and 12.
a. Cells are ranked by their replication score. The black line indicates RT profiles calculated as the average of overlapping intervals defined by the genome-wide replication score. b. Comparison of RT values in bins of 50 kb across embryonic stages. Representative changes in the RT (increase, shuffle, and constant) are indicated. White regions are regions of no coverage in the corresponding sample.
Extended Data Fig. 3
Extended Data Fig. 3. Dynamics of RT peaks, TTRs, and RT troughs during preimplantation development.
a. Alluvial plot showing the changes of RT phases. RT values were categorised in 5 groups from the earliest (1.0 ≥ RT > 0.8) to latest RT (0.2 > RT ≥ 0.0) across the genome. b. Representative replication timing profile in the morula stage depicting RT peaks, TTRs, and RT troughs. Grey shading represents 15 clusters of the RT values that were used to call local maxima (RT peaks or IZs) or local minima (RT troughs or TZs). Regions in transition between RT peaks and RT troughs were called as TTRs. The line indicates RT values. c. Fraction of A + T nucleotides in RT peaks, TTRs, and RT troughs during preimplantation development. Box plots show median and the interquartile range (IQR), whiskers depict the smallest and largest values within 1.5 ×IQR. d. Alluvial plot showing the relative changes of RT peaks, TTRs, and RT troughs at each cell division during preimplantation development. Box plots show median and the interquartile range (IQR), whiskers depict the smallest and largest values within 1.5 ×IQR.
Extended Data Fig. 4
Extended Data Fig. 4. Unique pattern of RT in zygote is not due to differences in replication between maternal and paternal alleles.
a. Representative heatmap depicting binarized replication status of all single cells in zygotes produced by IVF. Cells are ranked by their percentage of replicated genome (replication score), which is plotted as a bar plot on the left. b. Average RT profile of IVF-derived zygotes at the chromosome 2 region indicated by a black rectangle in a. The lines indicate RT profiles calculated as the average of overlapping intervals defined by the genome-wide replication score. c. Smoothed scatterplot comparing the RT values in zygotes, parthenogenetic zygotes, and isolated pronuclei (PN) compared to that of IVF-derived zygote. Rs indicate Spearman’s R. d. Correlation of genome-wide RT values between normal zygotes, zygotes produced by IVF, parthenogenetic zygotes and isolated maternal and paternal pronucleus (PN) embryos and later developmental stages using Spearman’s R. e. Representative brightfield image of isolated paternal pronucleus and remaining maternal pronucleus in the ooplasm. M, P, and PB indicate maternal pronucleus, paternal pronucleus, and polar body, respectively. Pronuclear isolation was repeated twice independently with similar results. Scale bar, 50 μm. f. Correlation heatmap of log2 maternal to paternal ratios between individual zygotes after discrimination of parental origins of sequencing reads using SNPs. Allele-specific bias was calculated by computing correlation coefficients of the maternal to paternal ratios across all genomic bins in which SNPs enabled identification of parent-of-origin allele. g. Representative genomic tracks of the log2 maternal to paternal ratio in zygotes (magenta) and in physically isolated maternal (red) or paternal pronucleus (blue) samples after assigning parental origin based on SNPs. Regions in which there are no reads (e.g. ~65–85 Mb) correspond to regions with no SNPs. h., i. Analysis of the size (h) and number (i) of the replication features in normal zygotes compared to zygotes produced by IVF, parthenogenetic zygotes and isolated maternal and paternal pronucleus (PN). Box plots show median and the interquartile range (IQR), whiskers depict the smallest and largest values within 1.5 ×IQR.
Extended Data Fig. 5
Extended Data Fig. 5. Analysis of imprinted genes indicated no replication asynchrony.
a. Analysis of RT at maternally (left) or paternally (right) imprinted genes in zygotes and in mechanically isolated paternal and maternal pronuclei (PN). RT values are shown on the top and expression data as ‘yes’ (detected) or ‘no’ (undetectable) is shown on the bottom. Expression data derives from GSE45719 and indicates expression in the indicated stage or maternal and paternal expression bias detected (grey) or undetected/absent (white).
Extended Data Fig. 6
Extended Data Fig. 6. Early and late replicating regions have less heterogeneity than that of mid replicating region.
a. Representative genomic bin on chromosome 8 depicting the parameters of sigmoid curve fitting. M-value (M) represents the replication score at which 50% of the cells replicated the bin. T width (Tw) was calculated based on replication score difference between 25% and 75% of cells replicated the bin. b. Smoothed scatter plots of T width along progression of replication timing for the indicated developmental stages. c. Measure for multimodality of M-values during embryonic development by Hartigans’ dip test. A greater dip value suggests a greater deviation from unimodal distribution (at least bimodal). Asterisks indicate significance levels (***, p-value < 0.001; ns, non-significant, as follows: for zygotes 9.8e − 01; for 2-cell 5.7e − 01; for 4-cell <2.2e − 16; for 8-cell <2.2e − 16; for morula <2.2e − 16; for ICM < 2.2e − 16).
Extended Data Fig. 7
Extended Data Fig. 7. Correlation between RT values in zygotes and maternal transcripts and analysis of histone modifications in RT peaks, TTRs and RT troughs.
a. Kinetics of the relative changes in the enrichment of H3K36me3 and H3K4me3 at RT peaks and RT troughs normalised to TTRs from the zygote to the morula stage. b. Immunostaining of histone H3 lysine 4 trimethylation (H3K4me3) after overexpression of Kdm5b. Representative maximal projection images are shown. Total number of embryos (n) analysed in each condition from three independent experiments (N) are shown. Scale bar, 25 μm. c. RT profiles of 2-cell stage embryos overlayed with those from Kdm5b-overexpressed 2-cell embryos. Genomic positions of indicated gene classes according to DBTMEE are shown as rectangles. d. Smoothed scatterplot of RT values in normal 2-cell embryos versus Kdm5b-overexpressed 2-cell embryo. Spearman’s correlation (Rs) is indicated. e. Confidence intervals for the changes of RT (ΔRT) between Kdm5b-overexpressed and untreated 2-cell embryos of genomic bins containing maternally expressed genes or Major ZGA genes. ‘Both’ refers to bins containing ZGA genes and maternally expressed genes, whereas ‘None’ does not overlap with any of the two categories. f. Enrichment of genomic regions displaying a significant change in RT upon Kdm5b expression in bins containing maternally expressed genes or Major ZGA genes. ‘Both’ refers to bins containing ZGA genes and maternally expressed genes, whereas ‘None’ does not overlap with any of the two categories. Observed over expected number of bins is shown (O/E). g. Smoothed scatterplots showing correlations between transcript levels (log2 TPM) of Metaphase II (MII) stage oocytes with the RT values of zygote and 2-cell stage embryos. Rs indicates Spearman’s R. h. Confidence intervals for the difference of transcript levels (Δlog2 TPM) between early (E) vs. late (L) replicating genes. Genomic bins with an RT value greater than 0.5 were considered as Early and with RT value lower than 0.5 as Late. i. Confidence intervals for the difference of replication timing (ΔRT) between genes with moderate/high vs. no/low transcript levels. Genes with a transcript level (log2 TPM) greater than 1 were considered moderate/high and with a value lower than 1 as no/low expressed. j. Confidence intervals for the Spearman’s correlation between RT and transcript abundance. k. Smoothed scatterplot showing correlation between transcript levels (log2 TPM) and RT values in mouse ES cells. Rs indicates Spearman’s R. In e, h-j the dot represents the mean of 1000 bootstrapped values. Error bars indicate the 95% bootstrap confidence interval.
Extended Data Fig. 8
Extended Data Fig. 8. Effect of RNA Pol II inhibition by α-amanitin and DRB on the embryonic RT programme.
a. Visualisation of global transcription during minor and major ZGA by EU click chemistry and efficient inhibition of ZGA using α-amanitin. Representative embryos of a total of 24 (control), 19 (α-amanitin treated) or 19 non-EU treated embryos (EU-) are shown. Scale bar, 50 μm. b. Taqman RT-qPCR analysis for Zscan4 cluster and rDNA after α-amanitin and DRB treatment. Barplots show mean ± s.d and dots indicate the values of independent biological replicates. c. Alluvial plot indicating the RT values categorised in 5 groups from the earliest (1.0 ≥ RT > 0.8) to latest RT (0.2 > RT ≥ 0.0) across the genome in control 2-cell embryos and their changes upon α-amanitin treatment. d. Confidence intervals for the changes in RT (ΔRT) upon α-amanitin treatment of genomic bins containing maternally expressed genes or major ZGA genes. ‘Both’ refers to bins containing ZGA genes and maternally expressed genes, whereas ‘None’ does not overlap with any of the two categories. e. Immunostaining of RNA Pol II using an antibody recognizing all forms of RNA Pol II or an antibody against its CTD Serine 2 phosphorylated form (S2P) after α-amanitin or DRB treatment with (right) and without (left) Triton pre-extraction. Representative single confocal sections are shown. Total number of embryos (n) analysed in each conditions from two independent experiments (N) are shown. Scale bars, 25 μm. We note that α-amanitin leads to degradation of RNA PolII in our experimental conditions. f. Visualisation of global transcription during minor and major ZGA by EU click chemistry and efficient inhibition of ZGA upon DRB treatment. Representative embryos from two independent experimetns (N) are shown. Scale bar, 50 μm. g. Difference of RT values (ΔRT) between DRB-treated and untreated 2-cell embryos at genomic bins overlapping only major ZGA genes, only maternal RNA genes, or both genes compared to non-overlapping bins (None). Box plots show median and the interquartile range (IQR), whiskers depict the smallest and largest values within 1.5 ×IQR. h. Confidence intervals for the changes in RT (ΔRT) upon DRB treatment of genomic bins containing maternally expressed genes or Major ZGA genes. ‘Both’ refers to bins containing ZGA genes and maternally expressed genes, ‘None’ does not overlap with any of the two categories. i. Enrichment of genomic regions displaying significant changes in RT upon α-amanitin treatment with bins that display changes in RT upon DRB treatment in 2-cell stage embryos. Observed over expected number of bins is shown (O/E). In d and h, the dot represents the mean of 1000 bootstrapped values. Error bars indicate the 95% bootstrap confidence interval.
Extended Data Fig. 9
Extended Data Fig. 9. Relationship between ATAC-seq and RT changes upon transcriptional inhibition.
a. Smoothed scatterplot showing correlation between ATAC-seq signal and RT values in 2-cell stage embryos (left) and in α-amanitin treated 2-cell stage embryos (right). Rs indicates Spearman’s R. b. Pairwise Spearman´s correlation coefficients (R) between RT and ATAC-seq signal in untreated and in α-amanitin treated 2-cell stage embryos. Error bars indicate the 95% bootstrap confidence interval. Dot represents the mean of 1000 bootstrapped values. c. Smoothed scatterplot depicting the difference of RT values (ΔRT) between α-amanitin treated and untreated 2-cell embryos against ATAC-seq signal in control 2-cell stage embryos. d. Difference of RT values (ΔRT) at genomic bins that significantly lose accessibility (down), gain accessibility (up) or remain unchanged (non-significant) upon α-amanitin treatment in 2-cell stage embryos. Box plots show median and the interquartile range (IQR), whiskers depict the smallest and largest values within 1.5 ×IQR. e. Size of RT peaks, TTRs and RT troughs in control versus α-amanitin or DRB treated 2-cell embryos. f. A + T content in RT peaks, TTRs, and RT troughs in 2-cell and α-amanitin treated 2-cell embryos. Box plots show median and the interquartile range (IQR), whiskers depict the smallest and largest values within 1.5 ×IQR. g. Fraction of RT peaks containing genes expressed at the 2-cell stage relative to all genes in RT peaks specific to 2-cell stage embryos upon α-amanitin treatment (de novo), in RT peaks specific to control 2-cell stage embryos (lost) and RT peaks present in both 2-cell control and α -amanitin treated embryos.
Extended Data Fig. 10
Extended Data Fig. 10. Characterisation of silent chromatin features of the embryonic replication programme and of the parental RT differences of LADs and compartments.
a., b. Box plots depicting H3K9me3 (a) or H3K27me3 (b) coverage at the indicated replication features at different embryonic stages. c. Kinetics of the relative changes in the enrichment of histone modifications at RT peaks and RT troughs normalised to TTRs from the zygote to the blastocyst stage ICM. The ‘oocyte/zygote’ time point indicates H3K27me3 data from oocytes, before fertilisation, and RT from zygotes (after fertilisation). d. Analysis to determine statistical significance on the RT differences between A and B compartments based on confidence intervals. Confidence intervals for the difference of replication timing (ΔRT) between A and B compartments. Error bars indicate the 95% bootstrap confidence interval. Dot represents the mean of 1000 bootstrapped values. e. Box plots of zygote RT values in maternal (left) and paternal (right) A and B compartments. f. Smoothed scatterplots showing the correlation between zygote RT values and maternal and paternal compartment scores. g. Box plot depicting the difference of RT values (ΔRT) between α-amanitin treated and untreated 2-cell embryos in A- and B-compartments. h. Box plot depicting the ATAC-seq signal in A- and B-compartments in untreated 2-cell stage embryos. i. Enrichment of the main families of transposable elements across replication features during early development. Color key indicates the number of overlapping TEs relative to randomly shuffled. j. Box plots showing RT values of zygotes within the corresponding zygotic maternal (left) and paternal (right) iLADs and LADs. k. Composite plot showing RT values of zygotes plotted against maternal and paternal zygotic LADs. The zero indicates the position of the LAD/iLAD boundaries. Shading shows IQR and the line indicates the median. In a, b, e, g, h, j the box plots show median and the interquartile range (IQR), whiskers depict the smallest and largest values within 1.5 ×IQR.

References

    1. Emerson DJ, et al. Cohesin-mediated loop anchors confine the locations of human replication origins. Nature. 2022;606:812–819. doi: 10.1038/s41586-022-04803-0. - DOI - PMC - PubMed
    1. Pope BD, et al. Topologically associating domains are stable units of replication-timing regulation. Nature. 2014;515:402–405. doi: 10.1038/nature13986. - DOI - PMC - PubMed
    1. Ryba T, et al. Replication timing: a fingerprint for cell identity and pluripotency. PLoS Comput. Biol. 2011;7:e1002225. doi: 10.1371/journal.pcbi.1002225. - DOI - PMC - PubMed
    1. Klein KN, et al. Replication timing maintains the global epigenetic state in human cells. Science. 2021;372:371–378. doi: 10.1126/science.aba5545. - DOI - PMC - PubMed
    1. Dileep V, Gilbert DM. Single-cell replication profiling to measure stochastic variation in mammalian replication timing. Nat. Commun. 2018;9:427. doi: 10.1038/s41467-017-02800-w. - DOI - PMC - PubMed