. 2024 Jan;625(7994):385-392.
doi: 10.1038/s41586-023-06857-0. Epub 2023 Dec 20.

Mitochondrial dysfunction abrogates dietary lipid processing in enterocytes

Affiliations

Mitochondrial dysfunction abrogates dietary lipid processing in enterocytes

Chrysanthi Moschandrea et al. Nature. 2024 Jan.

Abstract

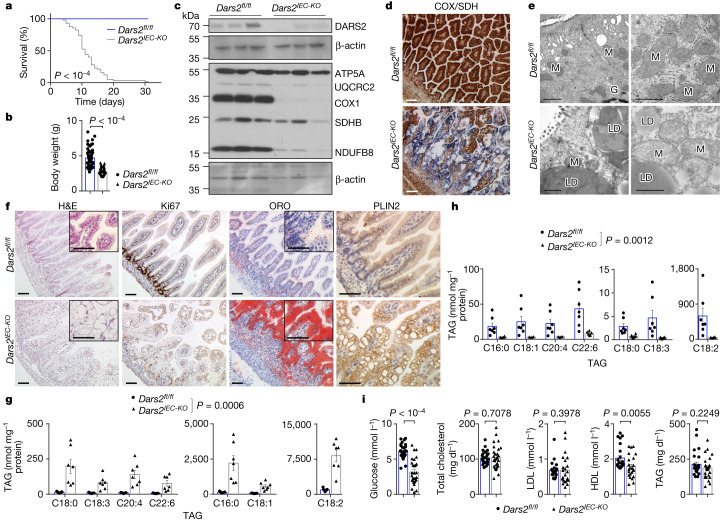
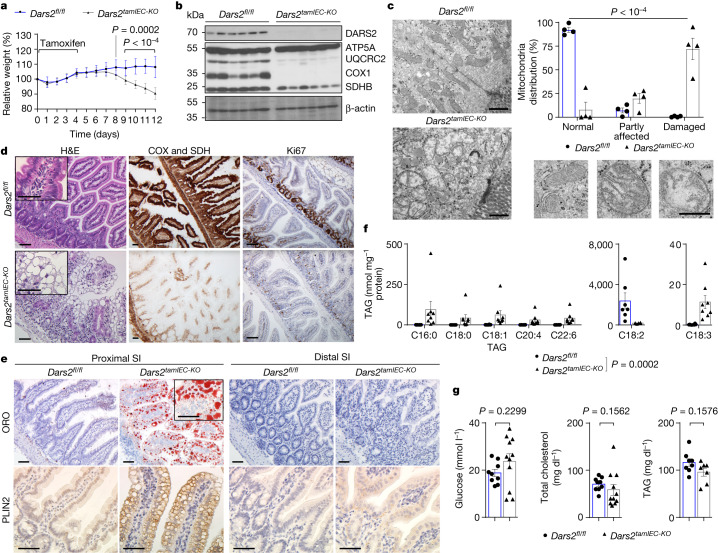
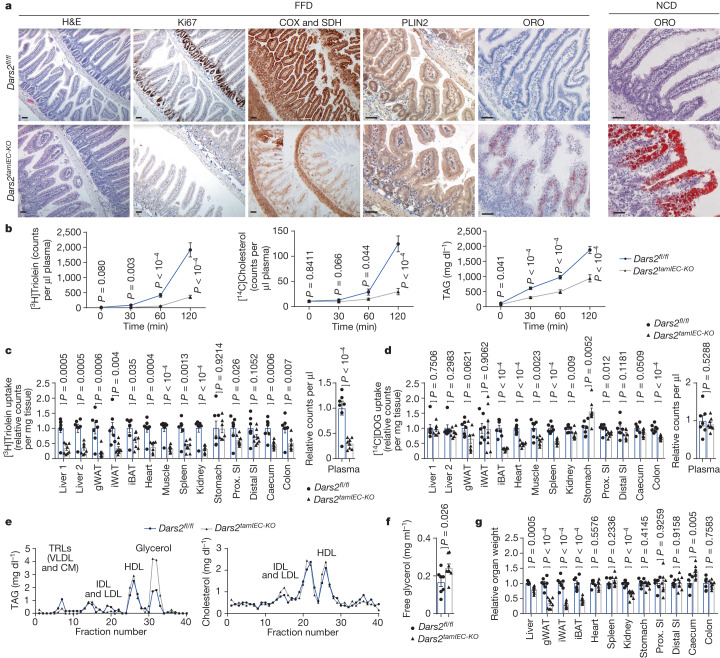
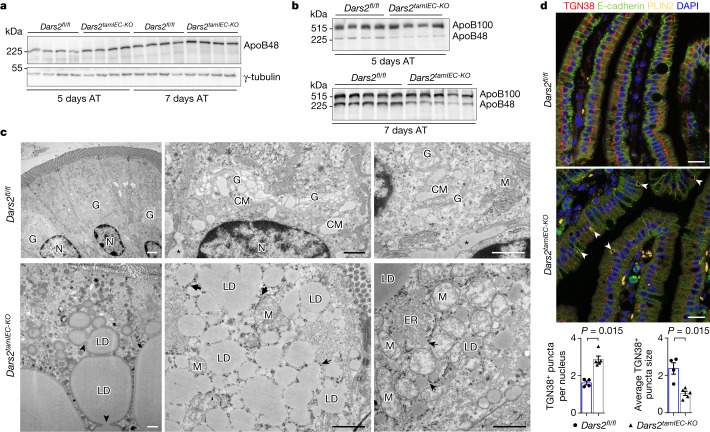
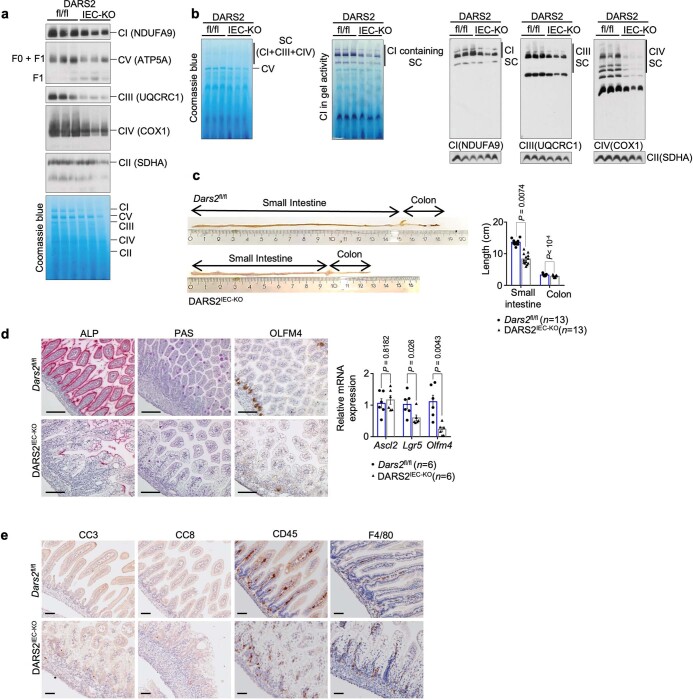
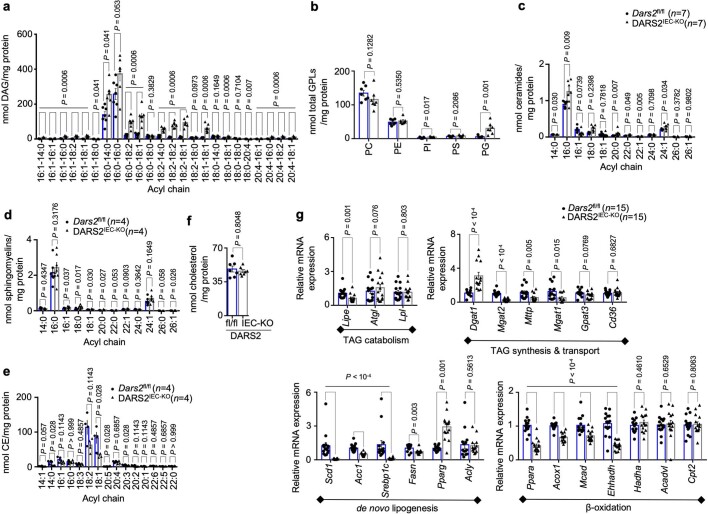
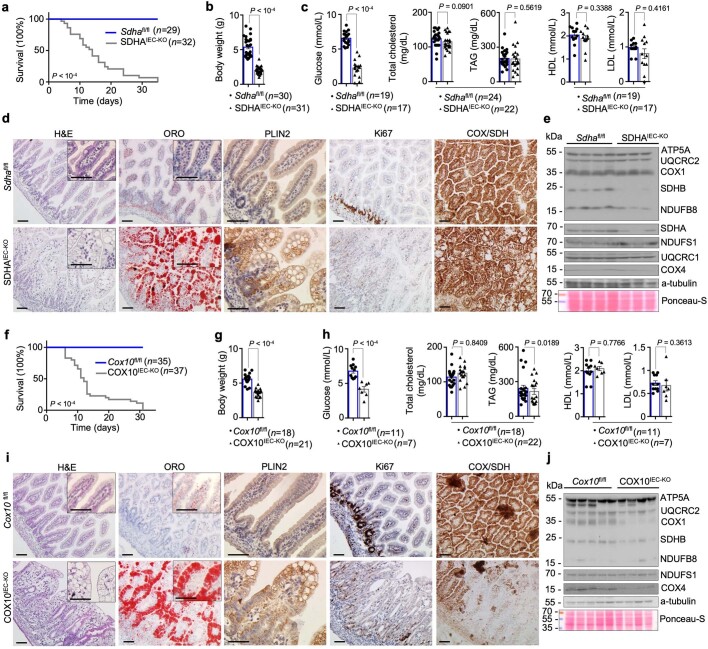
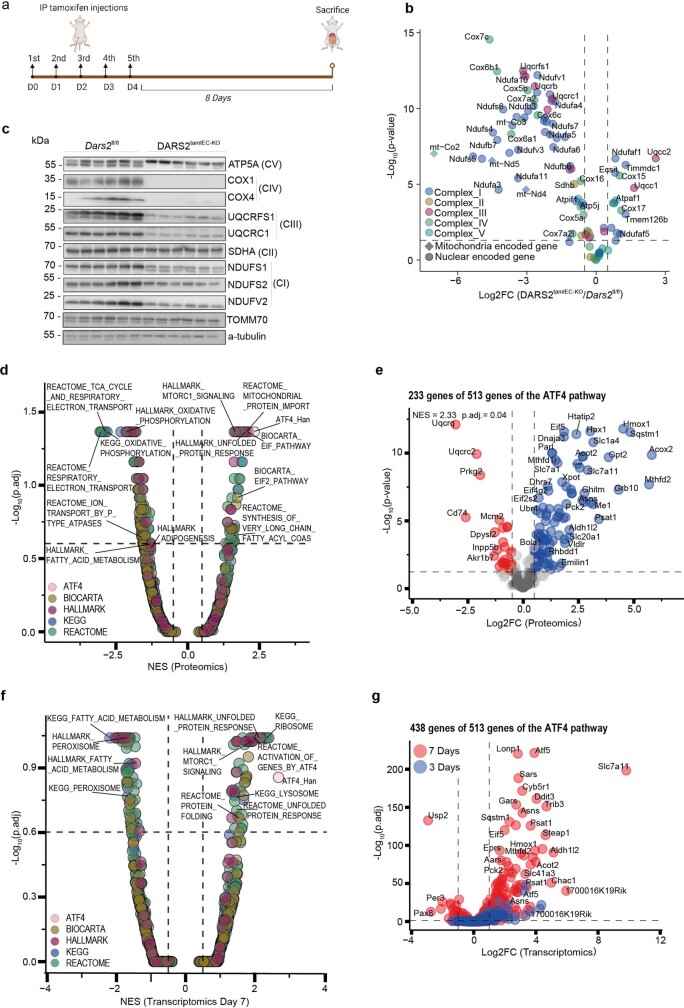
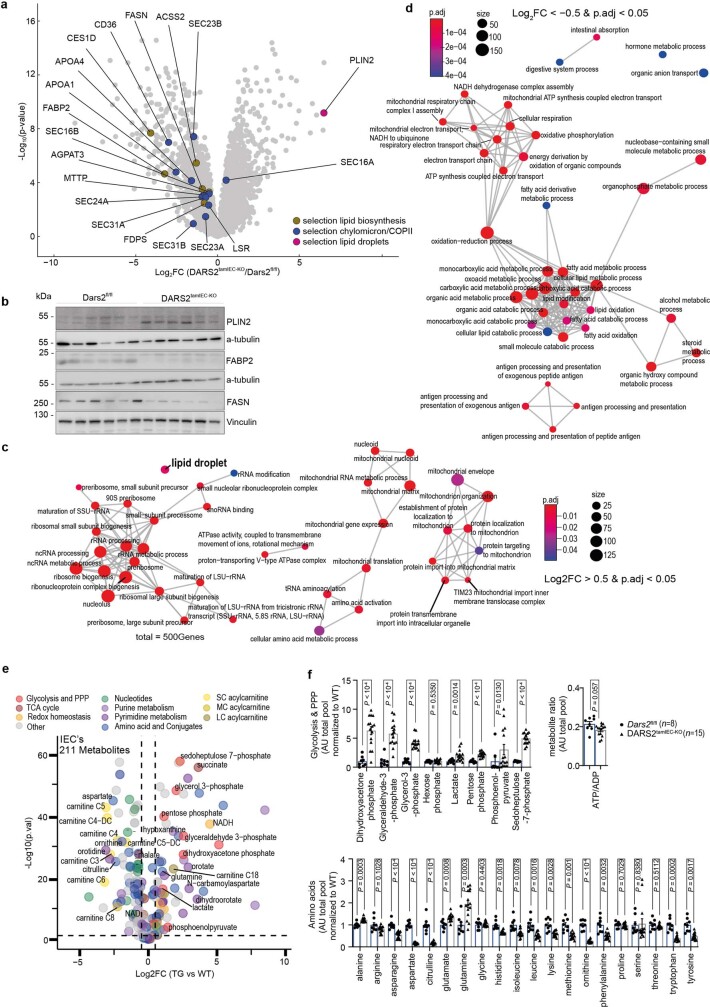
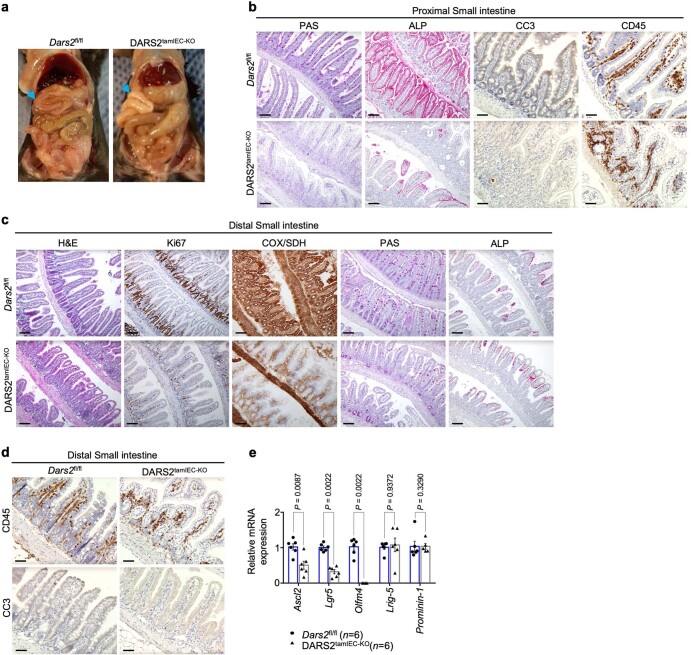
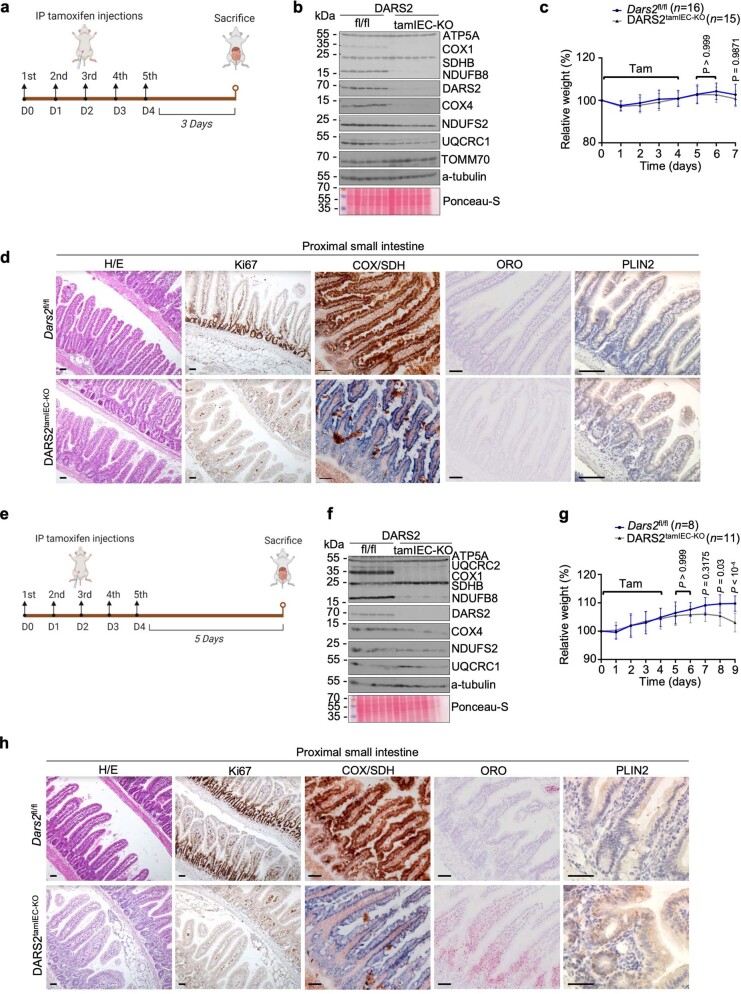
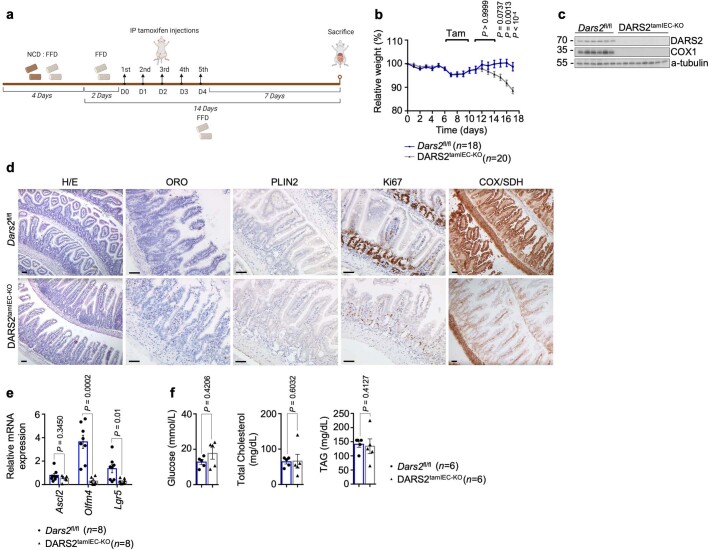
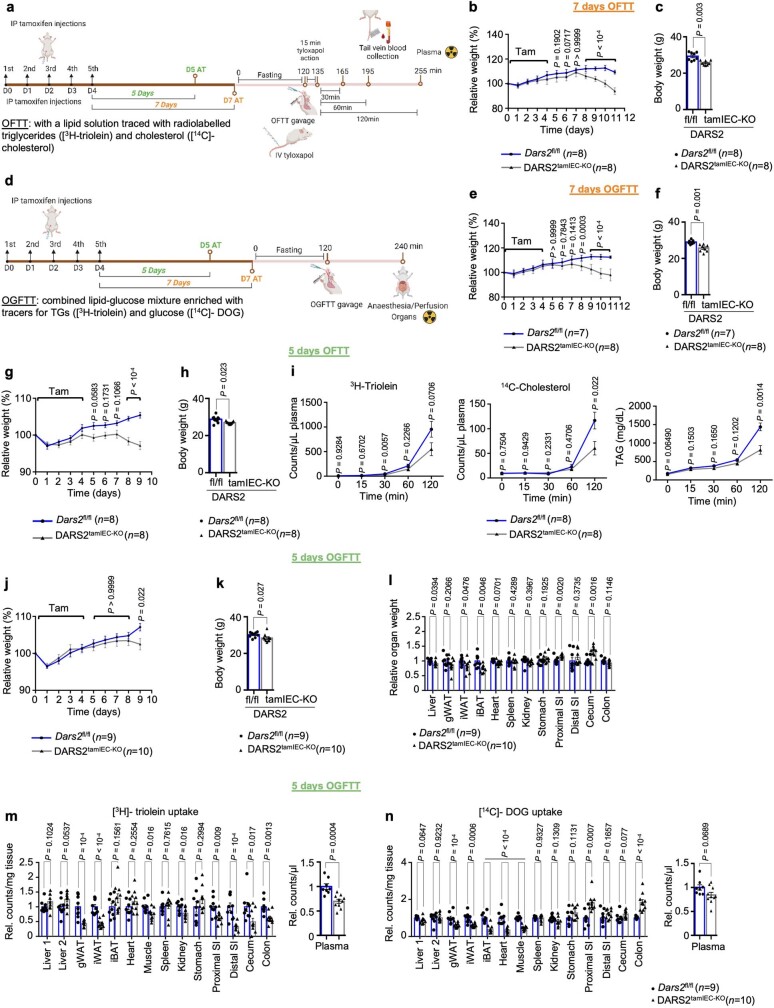
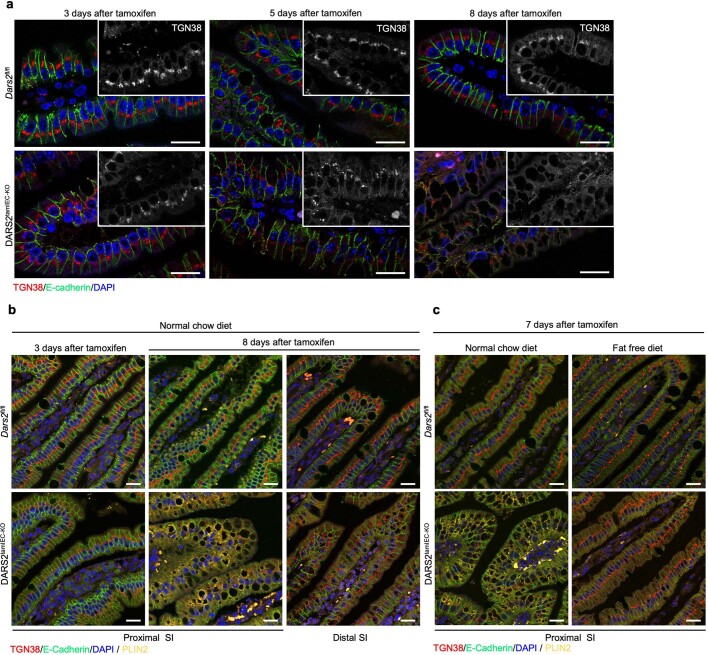
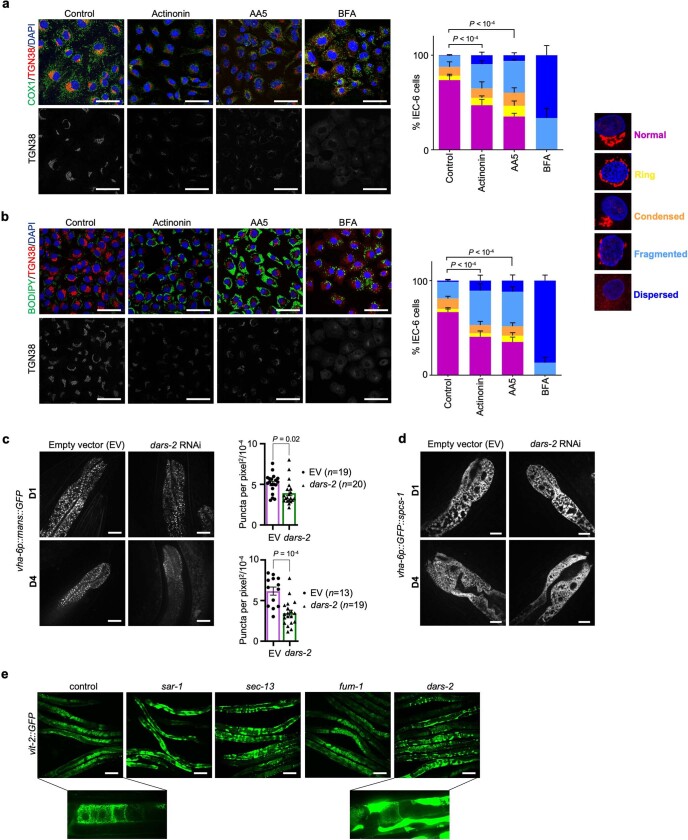
Digested dietary fats are taken up by enterocytes where they are assembled into pre-chylomicrons in the endoplasmic reticulum followed by transport to the Golgi for maturation and subsequent secretion to the circulation1. The role of mitochondria in dietary lipid processing is unclear. Here we show that mitochondrial dysfunction in enterocytes inhibits chylomicron production and the transport of dietary lipids to peripheral organs. Mice with specific ablation of the mitochondrial aspartyl-tRNA synthetase DARS2 (ref. 2), the respiratory chain subunit SDHA3 or the assembly factor COX10 (ref. 4) in intestinal epithelial cells showed accumulation of large lipid droplets (LDs) in enterocytes of the proximal small intestine and failed to thrive. Feeding a fat-free diet suppressed the build-up of LDs in DARS2-deficient enterocytes, which shows that the accumulating lipids derive mostly from digested fat. Furthermore, metabolic tracing studies revealed an impaired transport of dietary lipids to peripheral organs in mice lacking DARS2 in intestinal epithelial cells. DARS2 deficiency caused a distinct lack of mature chylomicrons concomitant with a progressive dispersal of the Golgi apparatus in proximal enterocytes. This finding suggests that mitochondrial dysfunction results in impaired trafficking of chylomicrons from the endoplasmic reticulum to the Golgi, which in turn leads to storage of dietary lipids in large cytoplasmic LDs. Taken together, these results reveal a role for mitochondria in dietary lipid transport in enterocytes, which might be relevant for understanding the intestinal defects observed in patients with mitochondrial disorders5.


Conflict of interest statement

The authors declare no competing interests.

Figures

Fig. 1
Fig. 1. Dars2IEC-KO mice develop severe intestinal pathology with massive lipid accumulation within large LDs in enterocytes.
a,b, Kaplan–Meier survival curves (a) and body weight at the age of 7 days (b) of Dars2fl/fl (n = 56 (a), n = 68 (b)) and Dars2IEC-KO (n = 57 (a), n = 66 (b)) mice. c, Immunoblot of IEC protein extracts from 7-day-old Dars2fl/fl (n = 3) and Dars2IEC-KO (n = 3) pups with the indicated antibodies. β-actin was used as the loading control. d, Representative images of SI sections from Dars2fl/fl and Dars2IEC-KO mice stained with enzyme histochemical staining for COX and SDH. e, Representative transmission electron microscopy (TEM) micrographs of SI sections from 7-day-old Dars2fl/fl and Dars2IEC-KO mice (n = 3 per genotype). G, Golgi; M, mitochondria. f, Representative images of SI sections from Dars2fl/fl and Dars2IEC-KO mice stained with haematoxylin & eosin (H&E), ORO or immunostained for PLIN2 and Ki67. g,h, TAG species content in SI (g) and liver (h) of Dars2fl/fl (n = 7) and Dars2IEC-KO (n = 7 SI, n = 6 liver) mice. i, Concentration of glucose, total cholesterol, TAGs, HDL-cholesterol and LDL-cholesterol in sera from 7-day-old Dars2fl/fl and Dars2IEC-KO mice (n = 29 (glucose, total cholesterol) per genotype; n = 23 (HDL, LDL) per genotype; n = 28, n = 25 (TAG) for Dars2fl/fl and Dars2IEC-KO, respectively). In b,gi, dots represent individual mice, bar graphs show the mean ± s.e.m. and P values were calculated using two-sided nonparametric Mann–Whitney U-test. In a, P values were calculated using two-sided Gehan–Breslow–Wilcoxon test. In d,f, histological images are representative of the number of mice analysed as indicated in Supplementary Table 4. In c, each lane represents one mouse. Scale bars, 1 μm (e) or 50 μm (d,f). For gel source data, see Supplementary Fig. 1. Source Data
Fig. 2
Fig. 2. Inducible DARS2 ablation in IECs of adult mice causes lipid accumulation in proximal enterocytes.
a, Relative body weight change of 8–12-week-old Dars2fl/fl and Dars2tamIEC-KO mice after tamoxifen administration (n = 21 per genotype). b, Immunoblot analysis with the indicated antibodies of protein extracts from SI IECs of Dars2fl/fl and Dars2tamIEC-KO mice 7 days after the last tamoxifen injection (n = 6 per genotype). β-actin was used as the loading control. c, Representative TEM micrographs of proximal SI sections and quantification of the mitochondria integrity distribution as a percentage of normal, partly affected and damaged mitochondria based on the electron density and cristae morphology in Dars2fl/fl mice (n = 4 mice, n = 663 mitochondria in n = 69 IECs) and Dars2tamIEC-KO mice (n = 4 mice, n = 707 mitochondria in n = 80 IECs) 7 days after tamoxifen. d, Representative images of sections from the proximal SI of Dars2tamIEC-KO and Dars2fl/fl mice stained with H&E, COX and SDH or immunostained with Ki67. e, Representative images of proximal and distal SI sections of Dars2fl/fl and Dars2tamIEC-KO mice stained with ORO or immunostained with PLIN2. f, TAG content in proximal SI of Dars2fl/fl and Dars2tamIEC-KO mice (n = 8 per genotype). g, Concentration of glucose, total cholesterol and TAGs in sera from Dars2fl/fl mice (n = 9 (glucose, total cholesterol), n = 8 (TAG)) and Dars2tamIEC-KO mice (n = 11 (glucose, total cholesterol), n = 7 (TAG)) 7 days after the last tamoxifen injection. In c, f and g, dots represent individual mice, bar graphs show the mean ± s.e.m. and P values were calculated using two-way analysis of variance (ANOVA) with Bonferroni’s correction for multiple comparison (a), two-sided chi-square test (c) or two-sided nonparametric Mann–Whitney U-test (f,g). In d,e, histological images are representative of the number of mice analysed as indicated in Supplementary Table 4. In b, each lane represents one mouse. Scale bars, 1 μm (c) or 50 μm (d,e). For gel source data, see Supplementary Fig. 1. Source Data
Fig. 3
Fig. 3. DARS2 deficiency causes impaired transport of dietary lipids by enterocytes.
a, Representative images from the proximal SI of 8–12-week-old Dars2fl/fl and Dars2tamIEC-KO mice fed with a FFD or NCD diet 7 days after the last tamoxifen injection, stained with H&E, ORO and COX and SDH or immunostained with antibodies against Ki67 and PLIN2. Scale bar, 50 μm. b, [3H]Triolein, [14C]cholesterol and TAG content in portal plasma of Dars2fl/fl mice (n = 8) and Dars2tamIEC-KO mice (n = 8) subjected to oral fat tolerance tests after intravenous injection of tyloxapol. c,d, Counts of [3H]triolein (c) and [14C]DOG (d) in different organs and plasma from Dars2fl/fl mice (n = 7) and Dars2tamIEC-KO mice (n = 8) determined 120 min after oral gavage. iBAT, interscapular brown adipose tissue; gWAT, gonadal white adipose tissue; iWAT, inguinal white adipose tissue; Prox. proximal. Liver 1 and liver 2 correspond to two different parts of the liver. e, Fast-protein liquid chromatography profiles of TAG and cholesterol in pooled portal plasma from fasted Dars2fl/fl mice (n = 7) and Dars2tamIEC-KO mice (n = 8) 120 min after gavage. IDL, intermediate-density lipoprotein. f, Free glycerol levels in plasma from Dars2fl/fl mice (n = 7) and Dars2tamIEC-KO mice (n = 8). g, Relative organ weight of Dars2fl/fl mice (n = 7) and Dars2tamIEC-KO mice (n = 8) 7 days after the last tamoxifen injection subjected to oral glucose fat tolerance test. In c,d,f,g, dots represent individual mice, bar graphs show the mean ± s.e.m. and P values were calculated using unpaired two-sided Student’s t-test with no assumption of equal variance (bd,f,g). In a, histological images are representative of the number of mice analysed as indicated in Supplementary Table 4. Source Data
Fig. 4
Fig. 4. DARS2 deficiency impairs CM production and induces progressive Golgi disorganization that precedes LD accumulation in enterocytes.
a,b, Immunoblots depicting expression levels of ApoB48 in SI IECs (a) and ApoB48 and ApoB100 on TRLs isolated from plasma by ultracentrifugation (b) from Dars2fl/fl and Dars2tamIEC-KO mice 5 and 7 days after the last tamoxifen injection (a, n = 4 mice per genotype, per indicated time point; b, n = 5 mice per genotype at 7 days after tamoxifen, n = 4 mice per genotype at 5 days after tamoxifen). γ-tubulin was used as the loading control (a). AT, after tamoxifen. c, Representative TEM micrographs from proximal SI sections of Dars2fl/fl mice (n = 4) and Dars2tamIEC-KO mice (n = 4) 7 days after the last tamoxifen injection. Note the lack of CM-containing Golgi complexes and the appearance of aberrant numbers of LDs and damaged mitochondria in DARS2-deficient enterocytes. Asterisks indicate CMs secreted in the basolateral intercellular space. Arrows point at lipid particles within the ER lumen in rough and smooth ER neighbouring areas. Arrowheads point at LD lateral fusion. N, nucleus. d, Top, representative fluorescence microscopy images from the proximal SI of 8–12-week-old Dars2fl/fl mice (n = 6) and Dars2tamIEC-KO mice (n = 6) immunostained with antibodies against TGN38, E-cadherin and PLIN2. Nuclei stained with DAPI. Arrowheads point at LDs. Bottom, quantification of the TGN38-positive puncta size and the number of puncta per nucleus from confocal images of proximal SI sections of Dars2fl/fl mice (n = 4) and Dars2tamIEC-KO mice (n = 5) 5 days after the last tamoxifen injection. In d, dots represent individual mice, bar graphs show the mean ± s.e.m. and P values were calculated using unpaired two-sided Student’s t-test with no assumption of equal variance. In a,b, each lane represents one mouse from two independent experiments. Scale bars, 1 μm (c) or 50 μm (d). For gel source data, see Supplementary Fig. 1. Source Data
Extended Data Fig. 1
Extended Data Fig. 1. Depletion of respiratory complex subunits and intestinal pathology in DARS2IEC-KO mice.
BN-PAGE analysis of (a) individual respiratory complexes, or (b) supercomplexes in mitochondria isolated from the SI  of 7-day-old Dars2fl/fl (fl/fl) and DARS2IEC-KO (IEC-KO) mice. Respiratory complexes were visualized by immunoblotting with indicated antibodies (a, b). The activity of supercomplex-associated Complex I was determined with in-gel assay (b). Coomassie blue stains and Complex II levels (anti-SDHA) were used as the loading controls (a, b). c, Representative pictures and quantification of the length of the SI and colon in 7-day-old DARS2IEC-KO (n = 13) and Dars2fl/fl littermates (n = 13). d, Representative images of SI sections from Dars2fl/fl and DARS2IEC-KO mice stained with PAS and ALP or immunostained against OLFM4 and graph depicting relative mRNA expression of the indicated genes measured by RT-qPCR in the SI from 7-day-old Dars2fl/fl (n = 6) and DARS2IEC-KO (n = 6) mice normalized to Tbp. e, Representative images of SI sections from Dars2fl/fl and DARS2IEC-KO mice immunostained against CC3, CC8, CD45 and F4/80. Scale bars, 50 μm (d, e). PAS, Periodic acid- Schiff; ALP, Alkaline Phosphatase; OLFM4, Olfactomedin 4, CC3, Cleaved Caspase 3, CC8, Cleaved Caspase 8. In c and d, dots represent individual mice, bar graphs show mean ± s.e.m. and P values were calculated by two-sided nonparametric Mann-Whitney U -test. In a and b, each individual lane represents mitochondria isolated from one mouse (n = 3 per genotype). For gel source data, see Supplementary Fig. 1. In d and e, histological images shown are representative of the number of mice analysed as indicated in Supplementary Table 4. Source Data
Extended Data Fig. 2
Extended Data Fig. 2. Impaired lipid homeostasis in the intestines of DARS2IEC-KO mice.
a-f, Graphs depicting quantification of DAG (a), GPLs (b), ceramides (c), sphingomyelins (d), CEs (e), and total cholesterol levels (f) in SI tissues from 7-day-old Dars2fl/fl and DARS2IEC-KO mice (n = 7, DAG, GLPs, ceramides, sphingomyelins, total cholesterol and n = 4, CE per genotype). g, Graph depicting relative mRNA expression of lipid-regulating genes associated with the indicated processes and measured by RT-qPCR in the total distal SI of 7-day-old Dars2fl/fl (n = 15) and DARS2IEC-KO (n = 15) mice normalized to Hprt1. In all graphs, dots represent individual mice, bar graphs show mean ± s.e.m. and P values were calculated by two-sided nonparametric Mann-Whitney U -test. DAG, Diacylglycerol, GLPs, Glycerophospholipids, PC, phosphatidylcholine, PE, phosphatidylethanolamine, PI, phosphatidylinositol, PS, phosphatidylserine, PG, phosphatidylglycerol, CE, cholesterol esters. Source Data
Extended Data Fig. 3
Extended Data Fig. 3. IEC-specific ablation of SDHA or COX10 causes lipid accumulation in large LDs in enterocytes.
a-c, Graphs depicting Kaplan-Meier survival curve (a), body weight (b) serum levels of glucose, total cholesterol, TAGs, HDL- and LDL-cholesterol (c) of Sdhafl/fl (n = 29 (a), n = 30 (b), n = 19 (glucose, HDL- and LDL- cholesterol), n = 24 (total cholesterol, TAG) (c)) and SDHAIEC-KO (n = 32 (a), n = 31 (b), n = 17 (glucose, HDL- and LDL-cholesterol), n = 22 (total cholesterol, TAG) (c)) mice at the age of 7 days. d, Representative images of SI sections from Sdhafl/fl and SDHAIEC-KO mice stained with H&E, COX-SDH and ORO or immunostained for PLIN2 and Ki67. Scale bars, 50 μm. e, Immunoblot analysis of IEC protein extracts from 7-day-old Sdhafl/fl (n = 4) and SDHAIEC-KO (n = 3) mice with the indicated antibodies. f, g, h Graphs depicting Kaplan-Meier survival curve (f), body weight (g) serum levels of glucose, total cholesterol, TAGs, HDL- and LDL-cholesterol (h) of 7-day-old Cox10fl/fl (n = 35 (f), n = 18 (g), n = 11 (glucose, HDL- and LDL-cholesterol), n = 18 (total cholesterol, TAG) (h)) and COX10IEC-KO (n = 37 (f), n = 21 (g), n = 7 (glucose, HDL- and LDL-cholesterol), n = 22 (total cholesterol, TAG) (h)) mice. i, Representative images of SI sections from Cox10fl/fl and COX10IEC-KO mice stained with H&E, COX-SDH and ORO or immunostained for PLIN2 and Ki67. Scale bars, 50 μm. j, Immunoblot analysis of IEC protein extracts from 7-day-old Cox10fl/fl (n = 5) and COX10IEC-KO (n = 4) mice with the indicated antibodies. In b, c, g and h, dots represent individual mice, bar graphs show mean ± s.e.m. and P values were calculated by two-sided nonparametric Mann-Whitney U -test. In a and f, P values were calculated by two-sided Gehan-Breslow-Wilcoxon test. In d and i, histological images shown are representative of the number of mice analysed as indicated in Supplementary Table 4. In i and j, each lane represents one mouse and α-tubulin was used as loading control. For gel source data, see Supplementary Fig. 1. Source Data
Extended Data Fig. 4
Extended Data Fig. 4. Proteomics and transcriptomics analyses of intestinal tissue and enterocytes from DARS2tamIEC-KO mice.
a, Schematic depicting the experimental design for inducible DARS2 deletion created with BioRender.com. Mice received daily intraperitoneal injections of tamoxifen (1 mg) for 5 consecutive days and were sacrificed 8 days upon the last injection as indicated. b, Volcano plot illustrating the protein expression profile of the mitochondria respiratory chain complex proteins detected in proximal IECs isolated from DARS2tamIEC-KO (n = 11) compared to Dars2fl/fl (n = 9) 7 days upon the last tamoxifen injection. c, Immunoblot analysis of protein extracts from proximal SI IECs from Dars2fl/fl and DARS2tamIEC-KO mice 7 days after the last tamoxifen injection with the indicated antibodies. α- tubulin was used as loading control. d, Volcano plot the profile of the different gene sets (colour coded) after performing GSEA analysis on the proteomics landscape of the DARS2tamIEC-KO (n = 11) mice compared to Dars2fl/fl (n = 9) 7 days upon the last tamoxifen injection. Adjusted p-value (p.adj) and normalized enrichment score (NES) are the result of the GSEA analysis. e, Volcano plot illustrating the protein expression profile of genes that are part of the ATF4 signature based on Han et al comparing proximal small intestinal IECs from DARS2tamIEC-KO (n = 11) to Dars2fl/fl mice (n = 9). f, Volcano plot illustrating the profile of the different gene sets (colour coded) after performing GSEA analysis on the transcriptomic profile of DARS2tamIEC-KO (n = 6) mice compared to Dars2fl/fl (n = 6) 7 days upon the last tamoxifen injection. NES and p.adj are the result of the GSEA analysis. g, Volcano plot illustrating the mRNA expression profile of genes that are part of the ATF4 signature based on Han et. al comparing the proximal small intestine from DARS2tamIEC-KO mice to Dars2fl/fl 7 days (red, n = 6) and 3 days (blue, n = 7) upon the last tamoxifen injection, respectively. In c, each lane represents one mouse (n = 6 per genotype). For gel source data, see Supplementary Fig. 1. In b and e, unpaired two-sided Welch’s Student t-test with S0 = 0.1 and a permutation-based FDR of 0.01 with 500 randomizations was performed to obtain differentially regulated proteins between the two groups. In d and f, normalized enrichment score (NES) and the statistics (p.adj) were calculated based on an algorithm described in Subramanian et al. In g, the statistical test producing the P values is Wald test and P‐adjusted values are calculated using the FDR/Benjamini-Hochberg approach. It is computed by function nbinomWaldTest of the Bioconductor DESeq2 package, based on a negative binomial general linear model of the gene counts.
Extended Data Fig. 5
Extended Data Fig. 5. Proteomics and metabolomics analyses reveal downregulation of lipid biosynthesis and chylomicron production, increased lipid droplet formation and suppression of mitochondrial metabolism in DARS2-deficient enterocytes.
a, Volcano plot presenting the proteome landscape comparing DARS2tamIEC-KO(n = 11) to Dars2fl/fl (n = 9) mice 7 days after the last tamoxifen injection. b, Immunoblot analysis with the indicated antibodies of protein extracts from proximal SI IECs isolated from Dars2fl/fl and DARS2tamIEC-KO mice 7 days after the last tamoxifen injection. α-tubulin and vinculin were used as loading controls. c-d, Emapplots of the Over Representation Analysis (ORA) performed on the significantly upregulated (Log2FC > 0.5 and p.adj < 0.05) proteins (c) and on the significantly downregulated (Log2FC < −0.5 and p.adj<0.05) proteins (d) when comparing DARS2tamIEC-KO (n = 11) to Dars2fl/fl (n = 9) mice 7 days upon tamoxifen injection. e, Volcano plot illustrating the differential intracellular metabolite levels comparing SI IECs of DARS2tamIEC-KO (n = 15) to Dars2fl/fl (n = 9) mice 7 days upon the last tamoxifen injection. f, Each data point in the bar graph represents the mean ± s.e.m of three technical replicates of one animal and is expressed as AUs relative to the average value of all control mouse samples for each metabolite detected in IECs from DARS2tamIEC-KO (n = 15) to Dars2fl/fl (n = 8) mice 7 days upon the last tamoxifen injection. P values were calculated by unpaired two-sided Welch’s Student t-test with S0 = 0.1 and a permutation-based FDR of 0.01 with 500 randomizations (a), one-sided Fisher’s exact test with Benjamini-Hochberg multiple-testing correction (c, d), one-sided Student t-test with Benjamini-Hochberg multiple-testing correction (e) and unpaired two-sided Student’s t-test with no assumption of equal variance or two-sided nonparametric Mann-Whitney U -test (f). Source Data
Extended Data Fig. 6
Extended Data Fig. 6. Impaired IEC proliferation, stemness and differentiation upon tamoxifen-inducible DARS2 ablation in IECs of adult mice.
a, Representative pictures from necropsy examination of Dars2fl/fl (n = 4) and DARS2tamIEC-KO (n = 4) mice sacrificed 8 days after the last tamoxifen injection. Blue arrows indicate the proximal SI appearing white in DARS2tamIEC-KO mice. b, c, d Representative microscopic pictures of proximal SI sections stained with PAS and ALP and immunostained with CC3 and CD45 (b) distal SI sections stained with H&E, COX/SDH, PAS, ALP or immunostained with Ki67 (c) and distal SI sections immunostained with CC3 and CD45 from Dars2fl/fl and DARS2tamIEC-KO (d). Scale bar, 50 μm (b, c, d). e, Graph depicting mRNA expression levels of stem cell genes in distal SI of Dars2fl/fl (n = 6) and DARS2tamIEC-KO (n = 6) mice measured with RT-qPCR and normalized to Tbp. In e, dots represent individual mice, bar graphs show mean ± s.e.m. and P values were calculated by two-sided non-parametric Mann-Whitney U test. In b, c and d, histological images shown are representative of the number of mice analysed as indicated in Supplementary Table 4. Source Data
Extended Data Fig. 7
Extended Data Fig. 7. Analysis of respiratory subunit expression, IEC proliferation and lipid accumulation in DARS2tamIEC-KO mice 3 and 5 days after tamoxifen injection.
a, Schematic depiction of the experimental design created with BioRender.com. b, Immunoblot analysis with the indicated antibodies of proximal SI IEC protein extracts from Dars2fl/fl (n = 6) and DARS2tamIEC-KO (n = 6) mice 3 days after the last tamoxifen injection. c, Graph depicting relative body weight of Dars2fl/fl (n = 16) and DARS2tamIEC-KO (n = 15) mice after tamoxifen injection. d, Representative microscopic images of proximal SI sections from Dars2fl/fl and DARS2tamIEC-KO mice sacrificed 3 days upon the last tamoxifen injection stained with H&E, COX/SDH and ORO or immunostained with Ki67 and PLIN2. Scale bars, 50 μm. e, Schematic depiction of the experimental design created with BioRender.com. f, Immunoblot analysis with the indicated antibodies of proximal SI IEC protein extracts from Dars2fl/fl (n = 5) and DARS2tamIEC-KO (n = 6) mice 5 days after the last tamoxifen injection. g, Graph depicting relative body weight of Dars2fl/fl (n = 8) and DARS2tamIEC-KO (n = 11) mice after tamoxifen injection. h, Representative microscopic images of proximal SI sections from Dars2fl/fl and DARS2tamIEC-KO mice sacrificed 5 days upon the last tamoxifen injection stained with H&E, COX/SDH and ORO or immunostained with Ki67 and PLIN2. Scale bars, 50 μm. In c and g, data are represented as mean ± s.e.m and P values were calculated by two-way ANOVA with Bonferroni’s correction for multiple comparison. In b and f, each individual lane represents one mouse and α-tubulin was used as loading control. For gel source data, see Supplementary Fig. 1. In d and h, histological images shown are representative of the number of mice analysed as indicated in Supplementary Table 4. Source Data
Extended Data Fig. 8
Extended Data Fig. 8. Tamoxifen-inducible ablation of DARS2 in adult mice fed with a fat-free diet (FFD).
a, Schematic depiction of the experimental design for inducing DARS2 deletion in mice fed with a FFD created with BioRender.com. 8-12-week-old mice were fed with an equal mixture of normal chow diet (NCD) and FFD for 4 days, which was followed by 14 days FFD feeding and sacrifice 7 days after the last tamoxifen injection. b, Graph depicting relative body weight change in FFD-fed Dars2fl/fl (n = 18) and DARS2tamIEC-KO (n = 20) mice after tamoxifen injection. c, Immunoblot analysis with the indicated antibodies of small intestinal IEC protein extracts from FFD-fed Dars2fl/fl (n = 6) and DARS2tamIEC-KO (n = 8) mice. α-tubulin was used as loading control. d, Representative images of sections from the distal SI of FFD-fed Dars2fl/fl and DARS2tamIEC-KO mice 7 days after the last tamoxifen injection stained with H&E, ORO and COX/SDH or immunostained for PLIN2 and Ki67. Scale bar, 50 μm. e, Graph depicting relative mRNA levels of stem cell genes analysed by RT-qPCR and normalized to Tbp in the SI of Dars2fl/fl (n = 8) and DARS2tamIEC-KO (n = 8) mice 7 days after tamoxifen injection. f, Graphs depicting the concentration of glucose, total cholesterol and TAGs in sera from Dars2fl/fl (n = 6) and DARS2tamIEC-KO (n = 6) mice fed with FFD 7 days upon the last tamoxifen injection. In e and f, dots represent individual mice. In b, e and f bar graphs data are represented as mean ± s.e.m. and P values were calculated by two-way ANOVA with Bonferroni’s correction for multiple comparison (b) and two-sided nonparametric Mann-Whitney U -test (e, f). In c, each individual lane represents one mouse. For gel source data, see Supplementary Fig. 1. In d, histological images shown are representative of the number of mice analysed as indicated in Supplementary Table 4. Source Data
Extended Data Fig. 9
Extended Data Fig. 9. Oral glucose fat tolerance and metabolic tracing in DARS2tamIEC-KO mice 5 and 7 days upon the last tamoxifen injection.
a-n, Metabolic tracing studies performed in DARS2tamIEC-KO mice 7 (a-f) and 5 days (a, d, g-n) upon the last tamoxifen injection. a, Schematic depiction of the experimental design of the oral fat tolerance test (OFTT) created with Biorender.com. On day 5 or 7 after the last tamoxifen injection, mice received an intravenous injection of the lipoprotein lipase inhibitor tyloxapol and were fasted for 2 h, followed by oral gavage with a lipid solution containing 3H-triolein and 14C-cholesterol. Afterwards, blood was collected from the tail vein for the indicated time points and the plasma appearance of the tracers was measured. b, c, g, h, Relative body weight change over the indicated time period (b, g) and body weight recorded on the day of sacrifice (c, h) of Dars2fl/fl (n = 8) and DARS2tamIEC-KO (n = 8) mice subjected to OFTT 7 days (b, c) or 5 days (g, h) upon tamoxifen. e, f, j, k, Relative body weight change over the indicated time period (e, j) and body weight recorded on the day of sacrifice (f, k) of Dars2fl/fl (n = 7) and DARS2tamIEC-KO (n = 8) mice subjected to OGFTT 7 days (e, f) or Dars2fl/fl (n = 9) and DARS2tamIEC-KO (n = 10) mice subjected to OGFTT 5 days (j, k) upon tamoxifen. d, Schematic depiction of the experimental design of the oral glucose fat tolerance test (OGFTT) created with BioRender.com. On day 5 or 7 after the last tamoxifen injection, mice were fasted for 2 h followed by oral gavage with 3H-triolein and 14C-DOG. Tissues were harvested 2 h after the oral gavage. i, Graphs depicting 3H-triolein, 14C-cholesterol and TAG content in portal plasma of Dars2fl/fl (n = 8) and DARS2tamIEC-KO (n = 8) mice subjected to OFTT after intravenous tyloxapol injection. l, Graph depicting relative organ weight of Dars2fl/fl (n = 9) and DARS2tamIEC-KO (n = 10) mice subjected to OGFTT. m, n, Graphs depicting counts of 3H-triolein (m) or 14C-DOG (n) in different organs and plasma from Dars2fl/fl (n = 9) and DARS2tamIEC-KO (n = 10) mice determined 120 min after oral gavage 5 days upon the last tamoxifen injection. In c, f, h, k, l, m and n, dots represent individual mice. In bar graphs data are represented as mean ± s.e.m. and P values were calculated by two-way ANOVA with Bonferroni’s correction for multiple comparison (b, e, g, j), two-sided nonparametric Mann-Whitney U -test (c, f, h, k), and unpaired two-sided Student’s t-test with no assumption of equal variance (i, l, m, n). Source Data
Extended Data Fig. 10
Extended Data Fig. 10. DARS2 depletion causes gradual Golgi disorganisation in proximal enterocytes that precedes LD formation and requires the presence of fat in the diet.
a, Representative fluorescence microscopy images from the proximal SI of 8-12-week-old Dars2fl/fl (n = 6) and DARS2tamIEC-KO (n = 6) mice sacrificed 3, 5 and 8 days upon the last tamoxifen injection and immunostained with antibodies against TGN38 (red) and E-cadherin (green). Insets shows only TGN38 staining in white. b, Representative fluorescence microscopy images from the proximal and distal SI of 8-12-week-old Dars2fl/fl (n = 6) and DARS2tamIEC-KO (n = 6) mice fed with NCD sacrificed 3 and 8 days upon the last tamoxifen injection and immunostained with antibodies against TGN38 (red), E-cadherin (green) and PLIN2 (yellow). c, Representative fluorescence microscopy images from the proximal SI of 8-12-week-old Dars2fl/fl (n = 6) and DARS2tamIEC-KO (n = 6) mice under NCD and FFD sacrificed 7 days upon the last tamoxifen injection and immunostained with antibodies against TGN38 (red), E-cadherin (green) and PLIN2 (yellow). Nuclei stained with DAPI (blue). Scale bars, 50 μm. Confocal images shown are representative of the number of mice analysed as indicated in Supplementary Table 4.
Extended Data Fig. 11
Extended Data Fig. 11. Mitochondrial dysfunction causes impairment of Golgi organisation and lipid processing in IEC-6 cells and in C. elegans.
a, Representative fluorescence microscopy images depicting IEC-6 cells treated for 48 h with actinonin (100 μM), Atpenin A5 (AA5, 1μM) or 1% dimethyl sulfoxide; DMSO (control). Short treatment (6 h) with Brefeldin A (BFA, 5 μg/ml) was used as a positive control for Golgi dispersal. Scale bars, 50 μm b, Representative fluorescence microscopy images of IEC-6 cells grown under the same conditions as described in a were incubated with oleic acid (OA, 600 μM) for the last 24 h prior imaging. In this case, BFA was applied in the last 6 h of OA treatment to avoid cytotoxicity. Anti-TGN38 (red) antibody was used to visualize Golgi, Anti-COX1(green) to stain mitochondrial networks (a), BODIPY (green) to stain lipid droplets (b), and DAPI (blue) for nuclei (top). TGN38 staining is additionally depicted in white (bottom). Scale bars, 50 μm. Quantification of the observed Golgi morphology of the IEC-6 cells based on five distinct categories, as illustrated at the right (n = 100–300 inspected IEC-6 cells from three independent biological experiments). c, Representative confocal images and graphs depicting quantification of GFP signal in C. elegans expressing α-mannosidase II fused to GFP under the control of the gut-specific vha-6 promoter grown either on a control empty vector (EV) or RNAi against dars-2 at the first (D1) and fourth day of adulthood (D4) (EV, n = 19 (D1), n = 13 (D4), dars-2, n = 20 (D1), n = 19 (D4)). Scale bars, 1 μm. d, Representative confocal images of GFP signal in C. elegans expressing SPCS-1 fused to GFP under the control of the gut-specific vha-6 promoter grown either on a control empty vector (EV) or RNAi against dars-2 at the first (D1) and fourth day of adulthood (D4) EV, n = 19 (D1), n = 19 (D4), dars-2, n = 20 (D1), n = 19 (D4)). Scale bars, 1 μm. e, Immunofluorescence micrographs of C. elegans carrying vit-2::GFP reporter on a control empty vector (EV) (n = 10) and RNAi against sar-1, sec-13, fum-1 and dars-2 at D1 (n = 10). Insets show magnification of a selected area of the worm. Scale bars, 100 μm. In bar graphs data are represented as mean ± s.e.m. and P values were calculated by two-sided Chi-squared test (a, b) and two-sided Student’s t-test with assumption of equal variance (c). Source Data

References

    1. Ko CW, Qu J, Black DD, Tso P. Regulation of intestinal lipid metabolism: current concepts and relevance to disease. Nat. Rev. Gastroenterol. Hepatol. 2020;17:169–183. doi: 10.1038/s41575-019-0250-7. - DOI - PubMed
    1. Dogan SA, et al. Tissue-specific loss of DARS2 activates stress responses independently of respiratory chain deficiency in the heart. Cell Metab. 2014;19:458–469. doi: 10.1016/j.cmet.2014.02.004. - DOI - PubMed
    1. Bourgeron T, et al. Mutation of a nuclear succinate dehydrogenase gene results in mitochondrial respiratory chain deficiency. Nat. Genet. 1995;11:144–149. doi: 10.1038/ng1095-144. - DOI - PubMed
    1. Diaz F, Thomas CK, Garcia S, Hernandez D, Moraes CT. Mice lacking COX10 in skeletal muscle recapitulate the phenotype of progressive mitochondrial myopathies associated with cytochrome c oxidase deficiency. Hum. Mol. Genet. 2005;14:2737–2748. doi: 10.1093/hmg/ddi307. - DOI - PMC - PubMed
    1. Finsterer J, Frank M. Gastrointestinal manifestations of mitochondrial disorders: a systematic review. Therap. Adv. Gastroenterol. 2017;10:142–154. doi: 10.1177/1756283X16666806. - DOI - PMC - PubMed