. 2024 Jan;625(7993):195-203.
doi: 10.1038/s41586-023-06870-3. Epub 2023 Dec 20.

Cryo-EM structures of PP2A:B55-FAM122A and PP2A:B55-ARPP19

Affiliations

Cryo-EM structures of PP2A:B55-FAM122A and PP2A:B55-ARPP19

Sathish K R Padi et al. Nature. 2024 Jan.

Abstract

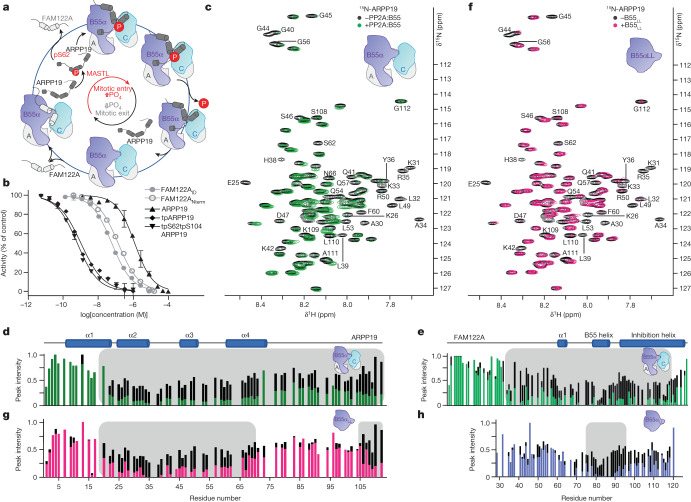
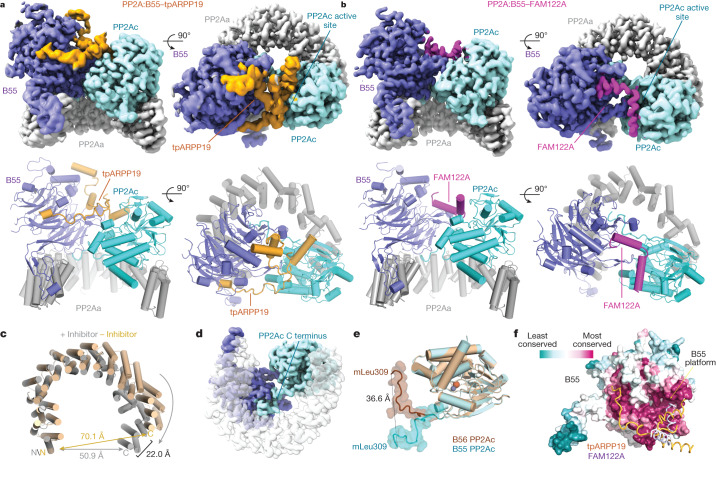
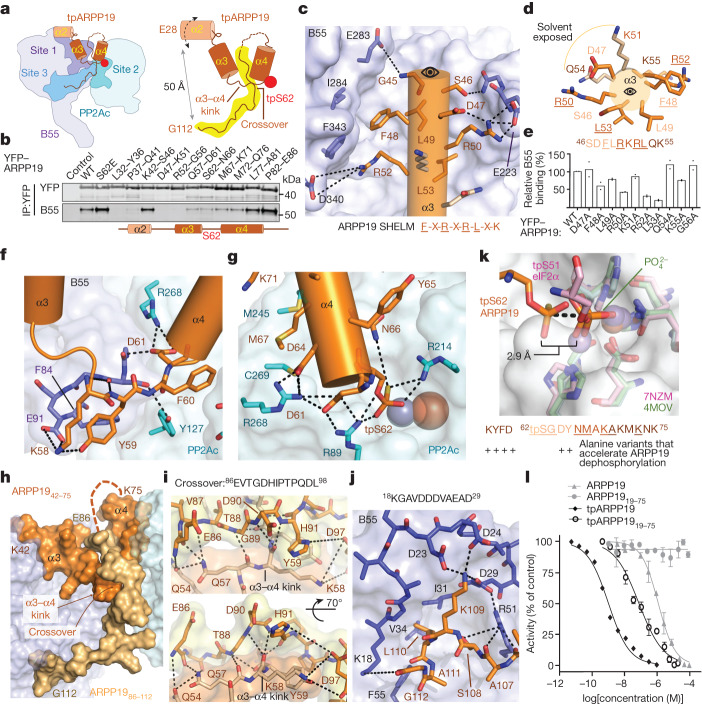
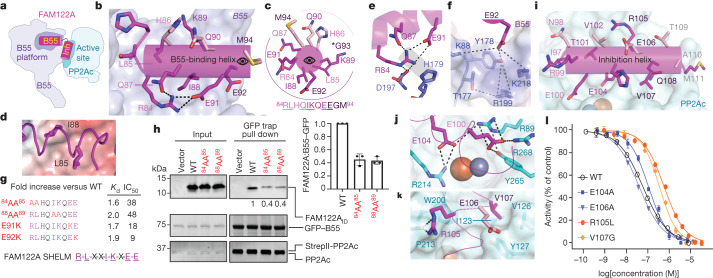
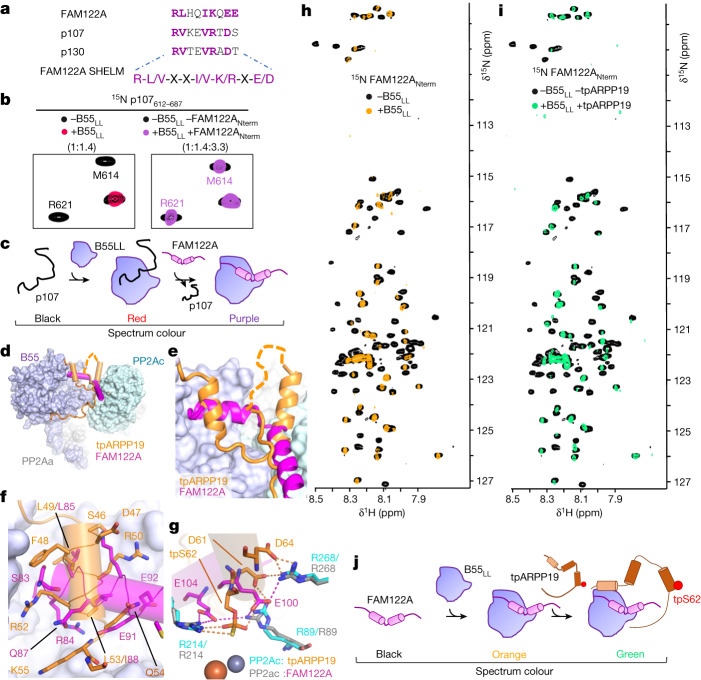
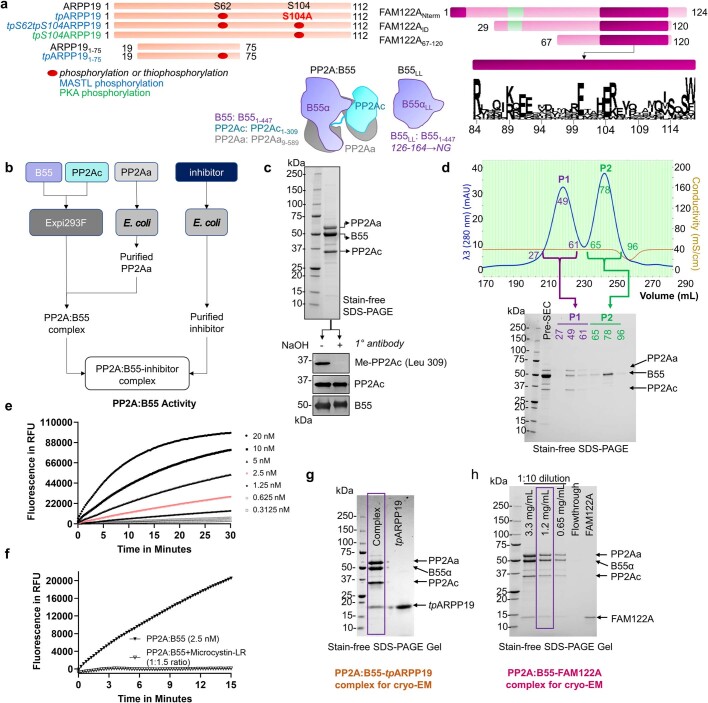
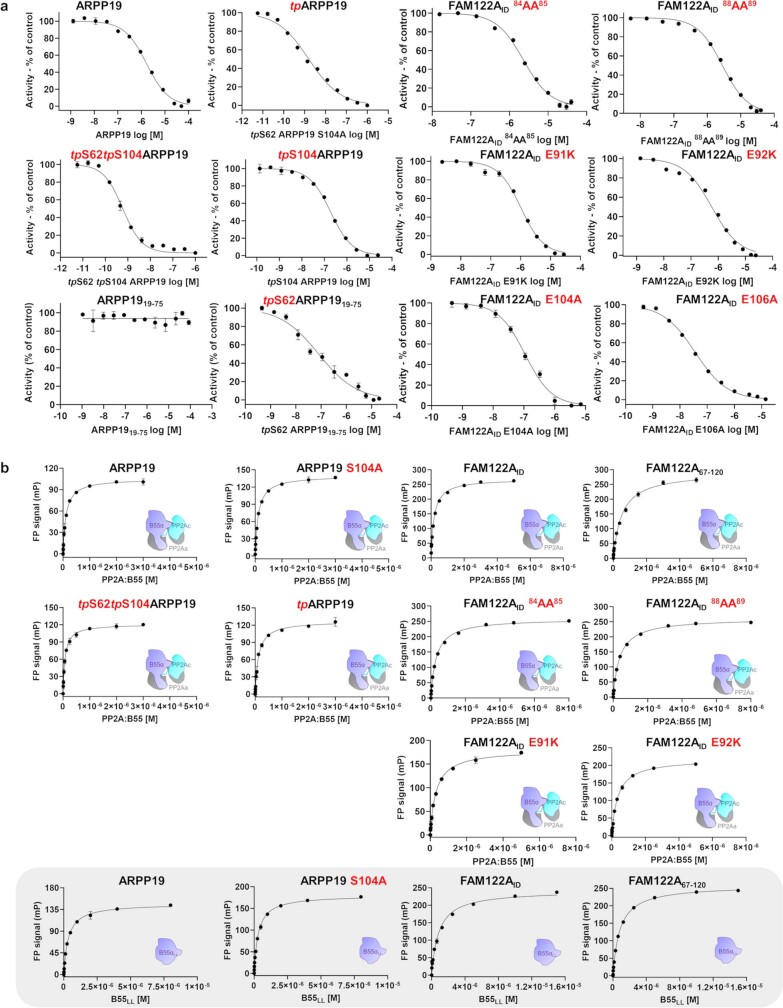
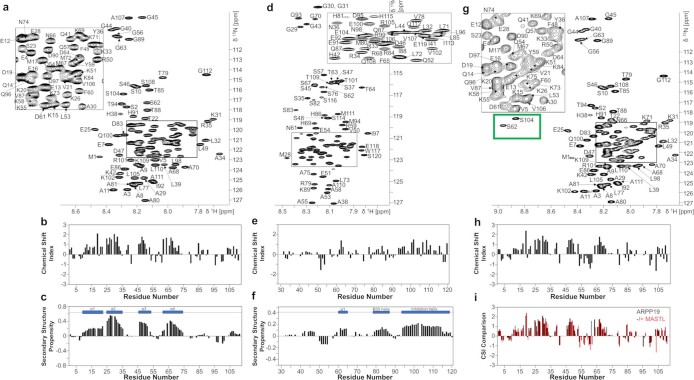
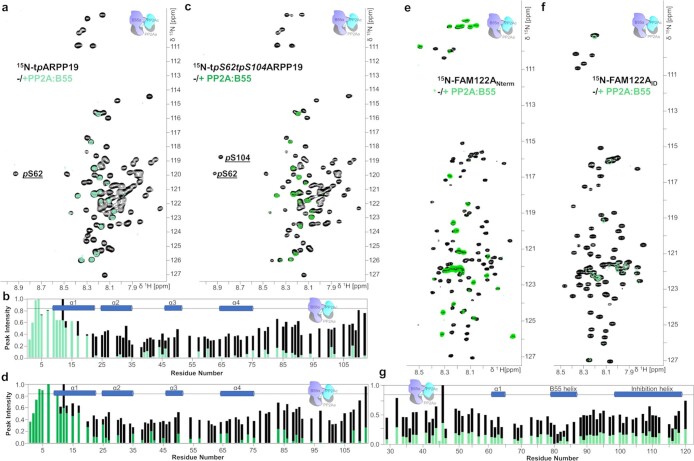
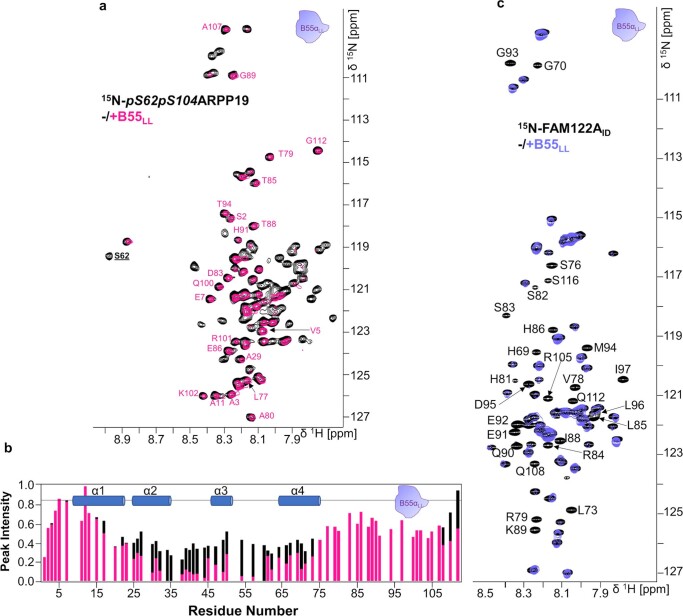
Progression through the cell cycle is controlled by regulated and abrupt changes in phosphorylation1. Mitotic entry is initiated by increased phosphorylation of mitotic proteins, a process driven by kinases2, whereas mitotic exit is achieved by counteracting dephosphorylation, a process driven by phosphatases, especially PP2A:B553. Although the role of kinases in mitotic entry is well established, recent data have shown that mitosis is only successfully initiated when the counterbalancing phosphatases are also inhibited4. Inhibition of PP2A:B55 is achieved by the intrinsically disordered proteins ARPP195,6 and FAM122A7. Despite their critical roles in mitosis, the mechanisms by which they achieve PP2A:B55 inhibition is unknown. Here, we report the single-particle cryo-electron microscopy structures of PP2A:B55 bound to phosphorylated ARPP19 and FAM122A. Consistent with our complementary NMR spectroscopy studies, both intrinsically disordered proteins bind PP2A:B55, but do so in highly distinct manners, leveraging multiple distinct binding sites on B55. Our extensive structural, biophysical and biochemical data explain how substrates and inhibitors are recruited to PP2A:B55 and provide a molecular roadmap for the development of therapeutic interventions for PP2A:B55-related diseases.


Conflict of interest statement

The authors declare no competing interests.

Figures

Fig. 1
Fig. 1. ARPP19 and FAM122A inhibit PP2A:B55.
a, ARPP19 and FAM122A sequentially inhibit PP2A:B55 activity during mitosis. A, PP2Aa; C, PP2Ac; P, phosphate. b, PP2A:B55 inhibition by ARPP19 (with or without phosphorylation), FAM122ANterm and FAM122AID (mean ± s.d.; n = 3 experimental replicates). Results representative of n = 3 independent experiments. Unpaired two-tailed t-test with 95% confidence interval was used to compare ARPP19 with tpARPP19 (P < 0.0001) or tpS62tpS104ARPP19 (P < 0.0001). IC50 values are reported in Extended Data Table 1. c, 2D 1H,15N HSQC spectrum of 15N-labelled ARPP19 with or without PP2A:B55. d, Plot of peak intensity versus ARPP19 protein sequence for spectra in c; grey shading highlights ARPP19 residues with reduced intensities in the presence of PP2A:B55. Secondary structure elements based on NMR CSI data are indicated. Colour scheme as in c. e, Plot of peak intensity versus FAM122A protein sequence for FAM122ANterm alone (black) and with PP2A:B55 (green); grey shading highlights FAM122A residues with reduced intensities in the presence of PP2A:B55. Secondary structure elements based on NMR CSI data are indicated. f, 2D 1H,15N HSQC spectrum of 15N-labelled ARPP19 with (pink) and without (black) B55LL; grey shading highlights ARPP19 residues with reduced intensities in the presence of B55LL. g, Plot of peak intensity versus ARPP19 protein sequence for spectra in f; grey shading highlights ARPP19 residues with reduced intensities in the presence of B55LL. h, Plot of peak intensity versus FAM122AID protein sequence for FAM122AID alone (black) and with B55LL (blue); grey shading highlights FAM122AID residues with reduced intensities in the presence of B55LL.
Fig. 2
Fig. 2. Structures of the PP2A:B55–tpARPP19 and PP2A:B55–FAM122A complexes.
a, Cryo-EM map and model of PP2A:B55–tpARPP19. Two views of the map (top) with the corresponding view of the molecular model (bottom). b, Cryo-EM map and model of PP2A:B55–FAM122A. c, Overlay of PP2Aa from the PP2A:B55 crystal structure (PDB ID: 3DW8; beige) and the PP2A:B55–inhibitor model (grey), superimposed using HEAT repeats 1–6. d, Rotated view of the experimental map. e, Overlay of the PP2Ac catalytic domains from PP2A:B55-FAM122A (cyan) and PP2A:B56 (brown; PDB ID: 2IAE); the C-terminal tails (amino acids R294–mL309) shown as surfaces. f, B55 shown as surface and coloured by sequence conservation; ARPP19 (orange) and FAM122A (slate blue) are shown as ribbons.
Fig. 3
Fig. 3. tpARPP19 inhibition of PP2A:B55.
a, Cartoon of PP2A:B55–tpARPP19 with interaction sites labelled. b, 5-Ala mutational scan of ARPP19 L32–E86. YFP–ARPP19 variants were transfected into HeLa cells, immunopurified and B55 binding was determined by western blot (n = 2). ARPP19 α-helices shown as a cartoon. c, Interaction of helix α3 (orange) with B55 (lavender). ARPP19 binding SHELM shown below. d, Helix α3 helical wheel. B55-binding residues are in dark orange and solvent-exposed residues are in light orange. Label colours indicate residues in the same helical turn; B55-binding residues are underlined. e, Quantification of 1-Ala mutational scan of helix α3 (pull-down experiments performed as in a; n = 2). f, The ARPP19 α3–α4 kink. g, tpS62 at the PP2Ac active site. h, The ARPP19 crossover. Helices α3 and α4 are in orange; the remaining residues are in gold. i, The ARPP19 crossover. Intramolecular contacts are shown as dashed lines. j, ARPP19 binds B55 loop 18KGAVDDDVAEAD29. k, PPP active site overlay of PP2A:B55–tpARPP19. PP1 phosphate (PDB ID 4MOV; PP1, green) and a pre-dephosphorylation complex (PDB ID 7NZM; tpS51eIF2α, pink; PP1, light pink) are shown. tpARPP19 is in orange, PP2Ac is cyan. Bottom, residues that when mutated result in faster dephosphorylation of S62. l, PP2A:B55 inhibition by ARPP19 variants (with or without phosphorylation; mean ± s.d.; n = 3 experimental replicates). Results representative of n = 3 independent experiments. Unpaired two-tailed t-test with 95% confidence interval was used to compare ARPP19 with tpARPP1919–75 (P < 0.0001) and tpARPP19 with tpARPP1919–75 (P = 0.0002). IC50 values are reported in Extended Data Table 1.
Fig. 4
Fig. 4. FAM122A inhibition of PP2A:B55.
a, Cartoon of PP2A:B55–FAM122A. B55, B55-binding helix; inh, inhibition helix. b, FAM122A residues R84–E92 (magenta) bind B55 (lavender) via a three-turn helix. c, Helical wheel of the B55-binding helix. B55-binding residues are in magenta, solvent-exposed residues are light pink, and label colours indicate residues within the same helical turn. d, L85–I88 binding pocket on B55 (shown as an electrostatic potential surface). e, Intra- and intermolecular interactions of Arg84 with B55 (polar or ionic interactions are shown as dashes). f, Intermolecular interactions of E92 with B55 (polar or ionic interactions are shown as dashes). g, Mutations in the FAM122A SHELM negatively affect PP2A:B55 binding and inhibition (Extended Data Table 2). h, Pull-down assay with SHELM variants. expi293F lysates were co-transfected with GFP–B55 and PP2Ac was incubated with purified PP2Aa and FAM122A variants and immunopurified. FAM122A variant binding efficiency was determined by western blot. Quantification based on three independent experiments (mean ± s.d.). Unpaired two-tailed t-test with 95% confidence interval was used to compare wild-type FAM122A with SHELM variants (P < 0.0005). i, FAM122A residues I97–M111 (magenta) bind PP2Ac (cyan). j, Intermolecular interactions of E100 and E104 with PP2Ac (ionic interactions are shown as dashed lines). k, Intermolecular interactions of R105 and V107 with PP2Ac. l, PP2A:B55 inhibition by FAM122AID variants (mean ± s.d.; n = 3 experimental replicates). Results representative of n = 3 independent experiments. Unpaired two-tailed t-test with 95% confidence interval was used to compare wild-type FAM122A with E104A (P < 0.0001), E106A (P = 0.013), R105L (P < 0.0001) or V107G (P < 0.0001). IC50 value reported in Extended Data Table 1.
Fig. 5
Fig. 5. PP2A:B55 recruitment.
a, PP2A:B55 SHELM sequences from experimentally confirmed B55 interactors. b, Left, 2D 1H,15N HSQC spectrum of 15N-labelled p107 alone and with B55LL (p107:B55 ratio is shown). Right, 2D 1H,15N HSQC spectrum of 15N-labelled p107 alone and with B55LL and an excess of unlabelled FAM122A (p107:B55:FAM122ANterm ratio is shown). c, Model of FAM122A-mediated displacement of p107. d, Overlay of PP2A:B55 bound to tpARPP19 or FAM122A. e, Magnified view of the overlapping regions shown in d. f, Overlay of tpARPP19 (orange) or FAM122A (magenta) at the B55 platform. g, Overlay of tpARPP19 (orange) or FAM122A (magenta) at the PP2Ac catalytic pocket. PP2Ac residues from the ARPP19 complex are labelled in cyan and those from the FAM122A complex are labelled in grey. Ionic interactions are shown as dashed lines. Metal ions in PP2Ac are shown as spheres. h, 2D 1H,15N HSQC spectrum of 15N-labelled FAM122A with and without B55LL. i, 2D 1H,15N HSQC spectrum of 15N-labelled FAM122A with and without B55LL and unlabelled tpARPP19. j, Model of FAM122A and ARPP19 binding B55LL simultaneously.
Extended Data Fig. 1
Extended Data Fig. 1. Constructs and complex production.
a. Construct schematic. ARPP19 constructs phosphorylated as indicated. Most highly conserved FAM122A residues are shown. b. Schematic describing the production of PP2A:B55 and PP2A:B55-inhibitors for structural and biophysical studies. c. Immunoblots of purified PP2A:B55 (above, SDS-PAGE), with and without NaOH treatment, using antibodies detecting methylated PP2Ac (BioLegend, Cat# 828801), PP2Ac (Millipore, Cat# MABE1783) and B55 (Cell Signaling Technologies, Cat# 2290 S). d. Size exclusion chromatography (SEC) chromatogram of PP2A:B55; peak 1 corresponds to PP2A:B55; peak 2 is excess free B55. e. PP2A:B55 activity assay using DiFMUP as a substrate; PP2A:B55 concentrations 0.3125-20 nM; 2.5 nM concentration highlighted in red. f. Same as e (2.5 nM concentration) with and without the PPP inhibitor microcystin-LR (3.75 nM concentration). g. SDS-PAGE of the PP2A:B55-tpARPP19 used for Cryo-EM grid preparation and data collection. h. SDS-PAGE of the PP2A:B55-FAM122A used for Cryo-EM grid preparation and data collection. Results (c-d and g-h) representative of 3 independent experiments.
Extended Data Fig. 2
Extended Data Fig. 2. IC50 inhibition and binding assays for ARPP19 and FAM122A variants vs PP2A:B55 and B55LL.
a. IC50 curves for PP2A:B55 inhibition by ARPP19 (variants; unphosphorylated and phosphorylated as well as different constructs) and FAM122AID variants. IC50 values are reported in Extended Data Table 1. Data are presented as mean values ± s.d. Results representative of n = 3 independent experiments. Unpaired two-tailed t-test with 95% confidence interval was used to compare: ARPP19 with tpARPP19 (p < 0.0001) or tpS62tpS104ARPP19 (p < 0.0001) or tpARPP1919-75 (p < 0.0001); tpARPP19 with tpS62tpS104ARPP19 (p = 0.02) or tpARPP1919-75 (p = 0.0002); FAM122AID with FAM122AID variants 84AA85 (p < 0.0001) or 88AA89 (p < 0.0001) or E91K (p < 0.0001) or E92K (p < 0.0001) or E104A (p < 0.0001) or E106A (p = 0.0013). b. FP binding studies to measure the interaction of ARPP19 (unphosphorylated and phosphorylated) and FAM122AID variants with PP2A:B55 and B55LL (gray box). KD values are reported in Extended Data Table 2. Data are presented as mean values ± s.d. Results representative of n = 3 independent experiments. Unpaired two-tailed t-test with 95% confidence interval was used to compare: PP2A:B55 interaction with ARPP19 vs tpS62tpS104ARPP19 (p = 0.0006); ARPP19 interaction with PP2A:B55 vs B55LL (p = 0.0016); ARPP19 S104A interaction with PP2A:B55 vs B55LL (p = 0.0008); PP2A:B55 interaction with FAM122AID vs FAM122A67-120 (p < 0.0001) or 84AA85 (p < 0.0001) or 88AA89 (p < 0.0001) or E91K (p < 0.0001) or E92K (p < 0.0001); FAM122AID interaction with PP2A:B55 vs B55LL (p < 0.0001); FAM122A67-120 interaction with PP2A:B55 vs B55LL (p < 0.0004).
Extended Data Fig. 3
Extended Data Fig. 3. HSQC and CSI plots of ARPP19, FAM122A and MASTL-phosphorylated ARPP19.
a. Fully annotated 2D [1H,15N] HSQC spectrum of 15N-labeled ARPP19. b. Chemical Shift Index (CSI) and c. Secondary-structure propensity (SSP) data for ARPP19 plotted vs. residue numbers. (SSP > 0, α helix; SSP < 0, β strand). Cα and Cβ chemical shifts were used to create the CSI and SSP plots (RefDB database). Preferred secondary structure indicated above SSP data. d. Fully annotated 2D [1H,15N] HSQC spectrum of 15N-labeled FAM122AID. e. CSI and f. SSP data for FAM122AID plotted vs. residue numbers; same as c. g. Fully annotated 2D [1H,15N] HSQC spectrum of 15N-labeled tpS62tpS104ARPP19. h. CSI; same as c. i. CSI comparison between ARPP19 (black) and tpS62tpS104ARPP19 (red).
Extended Data Fig. 4
Extended Data Fig. 4. NMR data supporting the interaction of phosphorylated ARPP19 and FAM122A with PP2A:B55.
a. 2D [1H,15N] HSQC spectrum of 15N-labeled tpARPP19 alone (black) and in complex with PP2A:B55 (green). pS62 labeled for clarity. b. Peak intensity vs ARPP19 protein sequence plot for tpARPP19 alone (black) and when bound to PP2A:B55 (green). Secondary structure elements based on NMR CSI data are indicated. c. 2D [1H,15N] HSQC spectrum of 15N-labeled tpS62tpS104ARPP19 alone (black) and in complex with PP2A:B55 (green). pS62 and pS104 labeled for clarity. d. Peak intensity vs ARPP19 protein sequence plot for tpS62tpS104ARPP19 alone (black) and when bound to PP2A:B55 (green). Secondary structure elements based on NMR CSI data are indicated. e. 2D [1H,15N] HSQC spectrum of 15N-labeled FAM122ANterm alone (black) and in complex with PP2A:B55 (green). f. 2D [1H,15N] HSQC spectrum of 15N-labeled FAM122AID alone (black) and in complex with PP2A:B55 (green). g. Peak intensity vs FAM122AID protein sequence plot for FAM122AID alone (black) and when bound to PP2A:B55 (green). Secondary structure elements based on NMR CSI data are indicated.
Extended Data Fig. 5
Extended Data Fig. 5. NMR data supporting the interaction of phosphorylated ARPP19 and FAM122A with B55LL.
a. 2D [1H,15N] HSQC spectrum of 15N-labeled pS62pS104ARPP19 alone (black) and in complex with B55LL (pink). pS62 labeled for clarity. b. Peak intensity vs ARPP19 protein sequence plot for pS62pS104ARPP19 alone (black) and when bound to B55LL (pink). Secondary structure elements based on NMR CSI data are indicated. c. 2D [1H,15N] HSQC spectrum of 15N-labeled FAM122AID alone (black) and in complex with B55LL (purple).
Extended Data Fig. 6
Extended Data Fig. 6. Cryo-EM image processing workflow for PP2A:B55-tpARPP19.
Particle counts and reconstruction resolutions are given at key junctions of the process. “Coarse grained” 3D classification denotes the inclusion of global angular and translational particle pose searches. All resolutions noted are calculated by the gold standard half-maps FSC = 0.143 criterion.
Extended Data Fig. 7
Extended Data Fig. 7. Cryo-EM image processing workflow for PP2A:B55-FAM122A.
Particle counts and reconstruction resolutions are given at key junctions of the process. “Coarse grained” 3D classification denotes the inclusion of global angular and translational particle pose searches. All resolutions noted are calculated by the gold standard half-maps FSC = 0.143 criterion.
Extended Data Fig. 8
Extended Data Fig. 8. Cryo-EM 2D class averages and maps for PP2A:B55-inhibitor complexes.
a-e, PP2A:B55-FAM122A; f-i, PP2A:B55-tpARPP19. a. Reference-free 2D class averages generated from the 103,522 particles used in the final multi-body refinement. b. The multi-body refinement results for each body, B55 and PP2Ac, colored by local resolution. c. The 25,000-particle subset consensus map, colored by local resolution. d. Histograms of the particle pose angular distribution from the input to the final multi-body refinement (left) and the 25,000-particle consensus subset refinement (right). e. The Fourier shell correlation (FSC) for the independently refined half-maps (black) and the full map and atomic model (orange) for the multibody refinement results (B55 body, top, PP2Ac body, middle) and the 25,000-particle subset consensus (bottom). The “gold standard” half-maps FSC was calculated and corrected for masking effects using Relion; the map-model FSC was calculated by PHENIX using a mask around the model based on map resolution. The FSC = 0.5 and 0.143 thresholds are marked by dashed lines. For the B55 and PP2Ac multibody refinements, the half-maps FSC crosses the 0.143 threshold at 2.55 Å and 2.69 resolution, respectively, and the map-model FSC crosses the 0.5 threshold at 2.61 Å and 3.12 Å resolution, respectively. For the subset consensus refinement, the half-maps FSC crosses the 0.143 threshold at 2.8 Å resolution and the map-model FSC crosses the 0.5 threshold at 2.86 Å resolution. f. Reference-free 2D class averages generated from the 52,934 particles used in the final refinement. g. Cryo-EM map, colored by local resolution. h. Histograms of the particle pose angular distribution from the input to the final refinement. i. The Fourier shell correlation (FSC) for the refinement results. The “gold standard” half-maps FSC was calculated and corrected for masking effects using Relion; the map-model FSC was calculated by PHENIX using a mask around the model based on map resolution. The FSC = 0.5 and 0.143 thresholds are marked by dashed lines. For the refinement, the half-maps FSC crosses the 0.143 threshold at 2.77 Å resolution and the map-model FSC crosses the 0.5 threshold at 2.81 Å resolution.
Extended Data Fig. 9
Extended Data Fig. 9. Intra- and intermolecular PP2A:B55-inhibitor interactions.
a. The methylated C-terminal tail of PP2Ac (cyan) extends to the opposite side of PP2A (grey) where it interacts at the interface between PP2Aa and B55 (lavender). b. Close-up of (a) with the C-terminus shown as sticks and PP2Aa, B55 and the rest of PP2Ac shown as a surface. c. Different view of a,b with the PP2Ac C-terminus shown as sticks and PP2Aa and B55 interacting residues also shown as sticks. Polar/ionic inter-subunit interactions indicated by black dashed lines and the participating residues underlined. d. Detailed interactions between the methylated C-terminal tail of PP2Ac (cyan, highlighted by purple box in (a)) with PP2Aa (grey) and B55 (lavender). e. Alanine scanning mutagenesis of ARPP19 amino acids L32-Q41. The indicated YFP-ARPP19 constructs were transfected into HeLa cells and immunopurified. Binding efficiency of the YFP-ARPP19 derivatives to B55 and PP2Ac was determined by Western blotting. f. Quantification of (e) based on two independent experiments. g. Alanine scanning mutagenesis of ARPP19 amino acids D47-G56. The indicated YFP-ARPP19 constructs were transfected into HeLa cells and immunopurified. Binding efficiency of the YFP-ARPP19 derivatives to B55 and PP2Ac was determined by Western blotting. Quantification of (g) based on two independent experiments shown in Fig. 3e. h. FAM122A K89 makes polar/ionic interactions (dashes) with multiple residues from B55. i. Helical wheel N→C view of the B55 inhibition helix highlighting residues that interact with PP2Ac and those that are solvent exposed.
Extended Data Fig. 10
Extended Data Fig. 10. NMR displacement and pull-down studies show that FAM122A displaces p107 and that FAM122A and tpARPP19 can bind simultaneously, with similarities to PP1.
a. 2D [1H,15N] HSQC spectrum of 15N-labeled p107 alone (black) and in complex with B55LL (red) shows that specific p107 residues bind B55LL. b. The addition of unlabeled FAM122A replaces 15N-labeled p107 in the identical B55LL binding surface and now starts to appear in the 2D [1H,15N] HSQC spectrum (light blue) in an identical position as in the 2D [1H,15N] HSQC spectrum of 15N-labeled p107 alone (black). c. Further addition of unlabeled FAM122A replaces 15N-labeled p107 in the identical B55LL binding surface and now nearly fully appears in the 2D [1H,15N] HSQC spectrum (violet) in an identical position as in the 2D [1H,15N] HSQC spectrum of 15N-labeled p107 alone (black). Black boxes highlight inserts shown in Fig. 5b in the manuscript. d. Pulldown assay demonstrating that tpS62-ARPP19 does not displace FAM122A when bound to PP2A:B55. Expi293F lysates co-transfected with GFP-B55 and PP2Ac-strep were incubated with purified PP2Aa and FAM122A alone and with a 5-fold surplus of tpS62-ARPP19, pulled-down using a GFP-TRAP and immunoblotted for the indicated proteins. Results representative of 3 independent experiments. e. 2D [1H,15N] HSQC spectrum of 4.5 μM 15N-labeled ARPP19 alone (black) and in complex with 6.9 μM unlabeled B55LL and 22.5 μM unlabeled FAM122A (red) shows that mostly ARPP19 helix α2 HN/N cross peaks stay bound to B55LL (annotated in orange); compare with Fig. 1f without FAM122A. f. tpARPP19 (orange) bound to PP2Ac (cyan). g. FAM122A (magenta) bound to PP2Ac (light pink). h. I-2 (light green) bound to PP1 (grey; pdbid 2OG8). i. Overlay of PP2Ac and PP1 bound to tpARPP19, FAM122A and I-2, respectively. Colors as in a-c. PP2Ac shown as surface. j. Zoom view of (i) with the residues near the active site shown as sticks. Bound metals are shown. k. PP2Ac:tpARPP19 in same orientation as j. l. PP2Ac:FAM122A in same orientation as j. m. PP1:I-2 in same orientation as j. n. Same as j but without the PPPs.

Update of

References

    1. Queralt E, Uhlmann F. Cdk-counteracting phosphatases unlock mitotic exit. Curr. Opin. Cell Biol. 2008;20:661–668. doi: 10.1016/j.ceb.2008.09.003. - DOI - PMC - PubMed
    1. Maller JL. Mitotic control. Curr. Opin. Cell Biol. 1991;3:269–275. doi: 10.1016/0955-0674(91)90151-N. - DOI - PubMed
    1. Amin P, et al. PP2A–B55: substrates and regulators in the control of cellular functions. Oncogene. 2022;41:1–14. doi: 10.1038/s41388-021-02068-x. - DOI - PubMed
    1. Mochida S, Ikeo S, Gannon J, Hunt T. Regulated activity of PP2A–B55 delta is crucial for controlling entry into and exit from mitosis in Xenopus egg extracts. EMBO J. 2009;28:2777–2785. doi: 10.1038/emboj.2009.238. - DOI - PMC - PubMed
    1. Mochida S, Maslen SL, Skehel M, Hunt T. Greatwall phosphorylates an inhibitor of protein phosphatase 2A that is essential for mitosis. Science. 2010;330:1670–1673. doi: 10.1126/science.1195689. - DOI - PubMed

MeSH terms

Substances