. 2024 Feb;626(7997):177-185.
doi: 10.1038/s41586-023-06887-8. Epub 2023 Dec 20.

Discovery of a structural class of antibiotics with explainable deep learning

Affiliations

Discovery of a structural class of antibiotics with explainable deep learning

Felix Wong et al. Nature. 2024 Feb.

Abstract

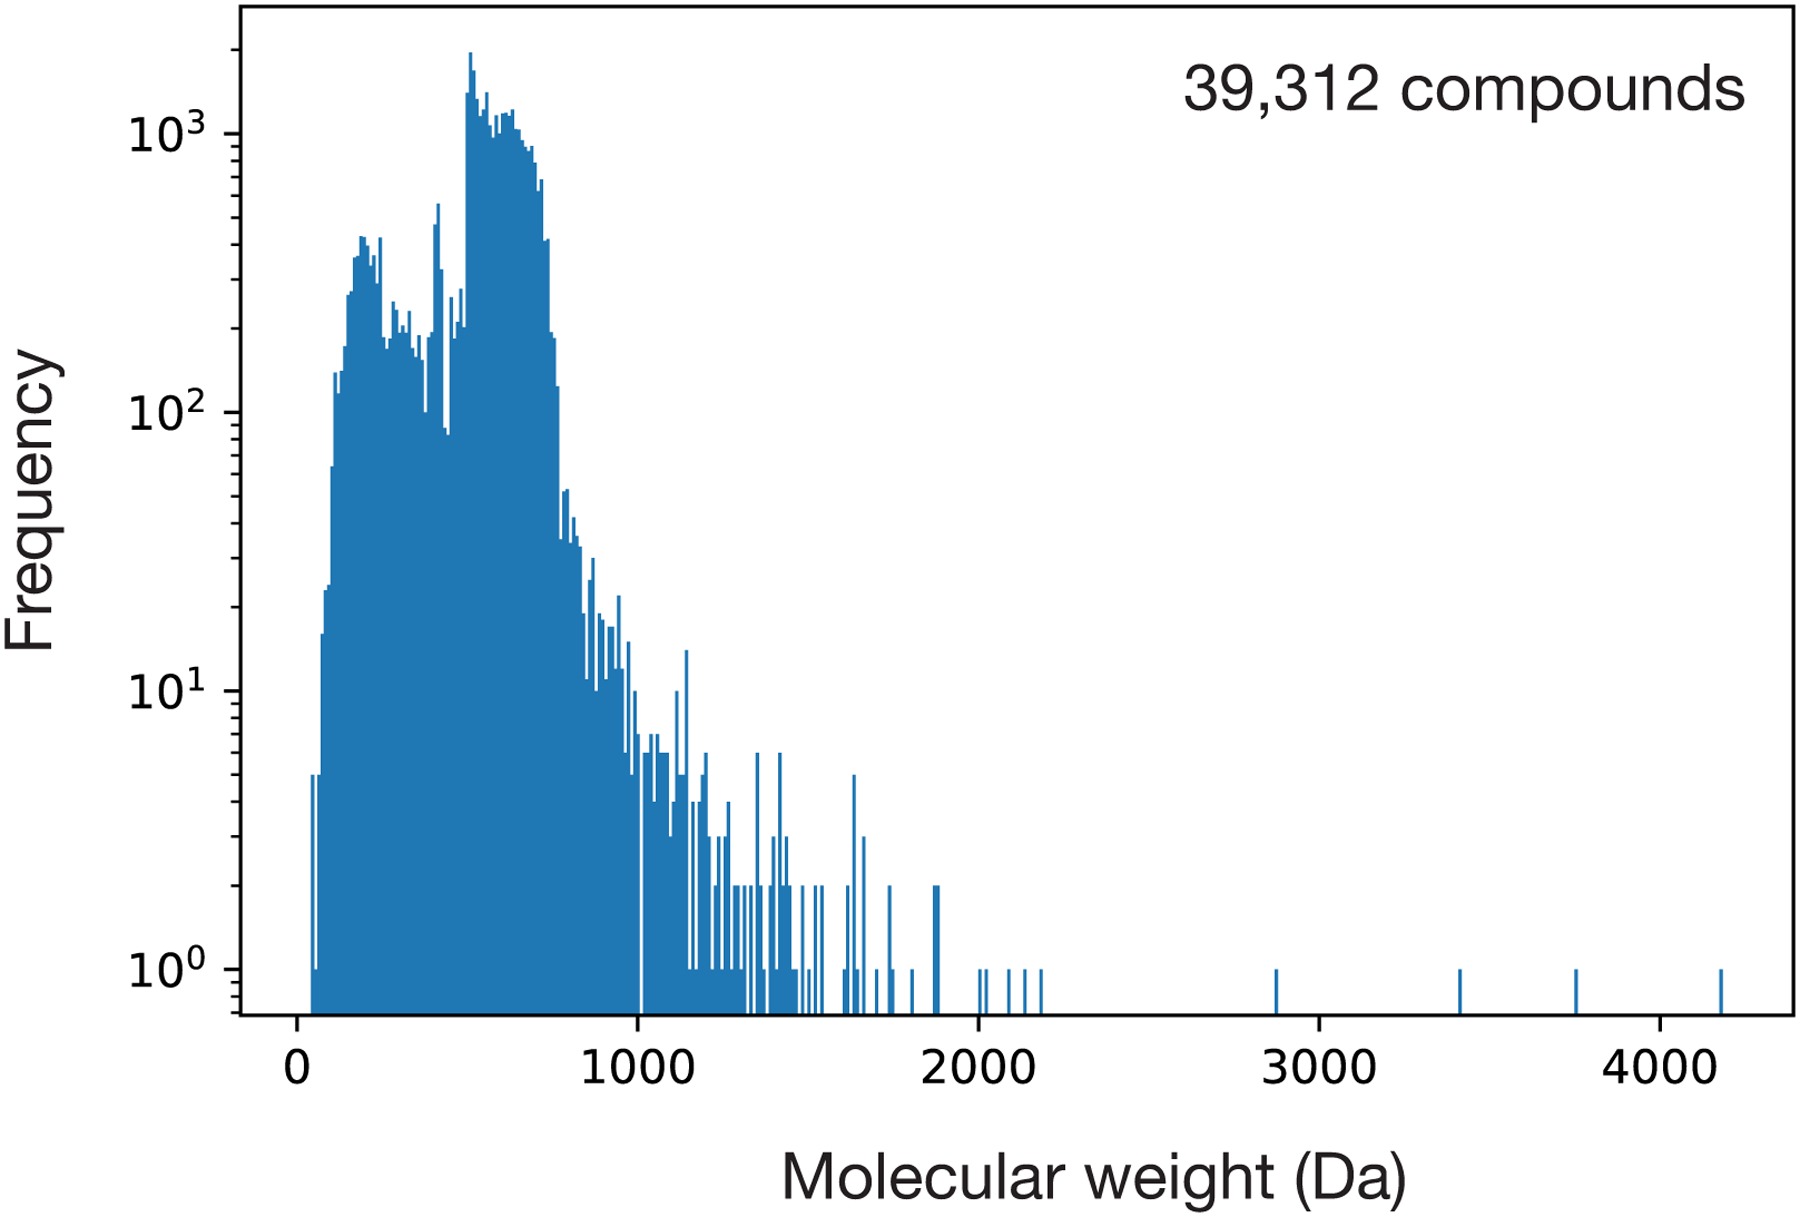
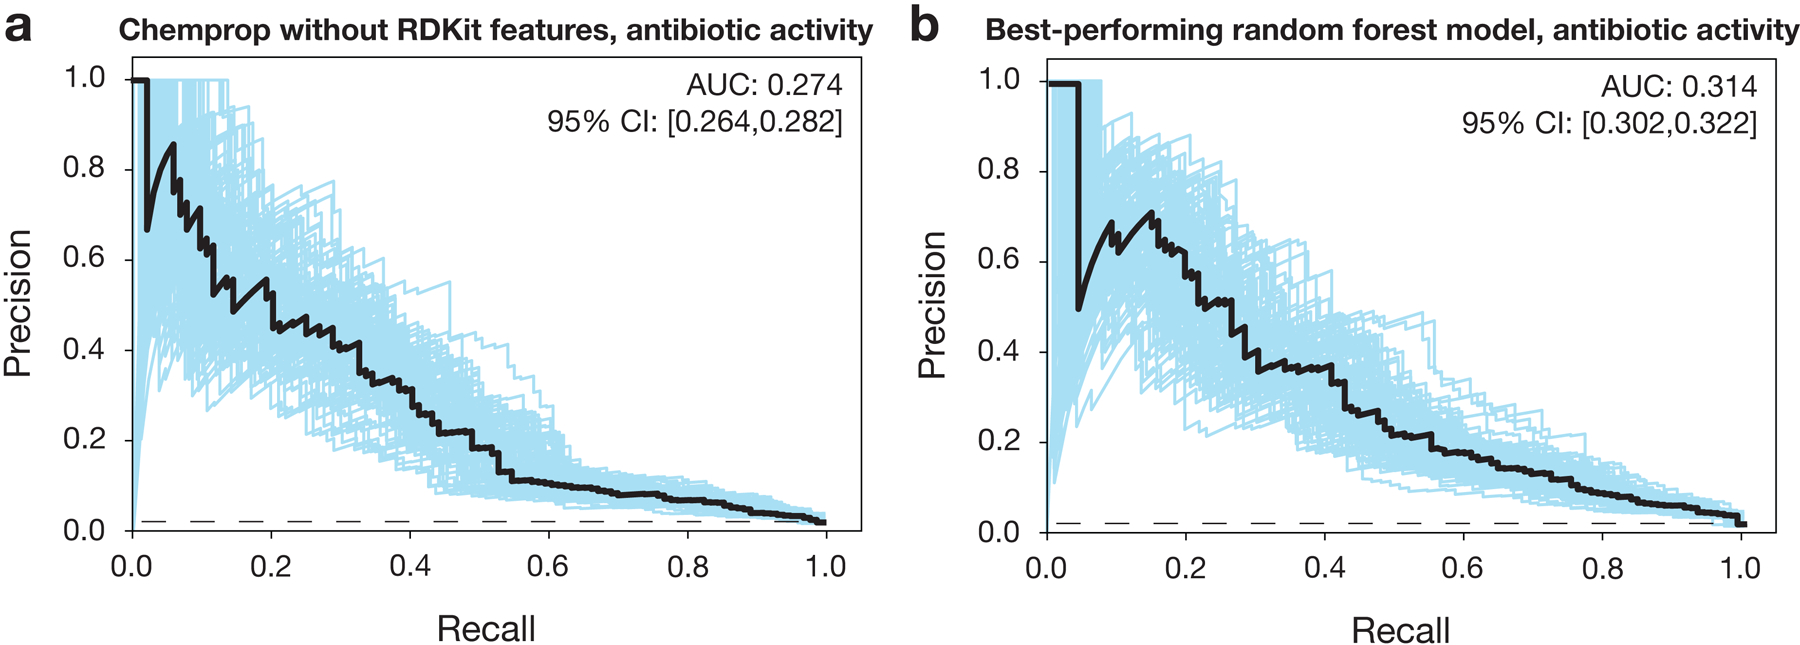
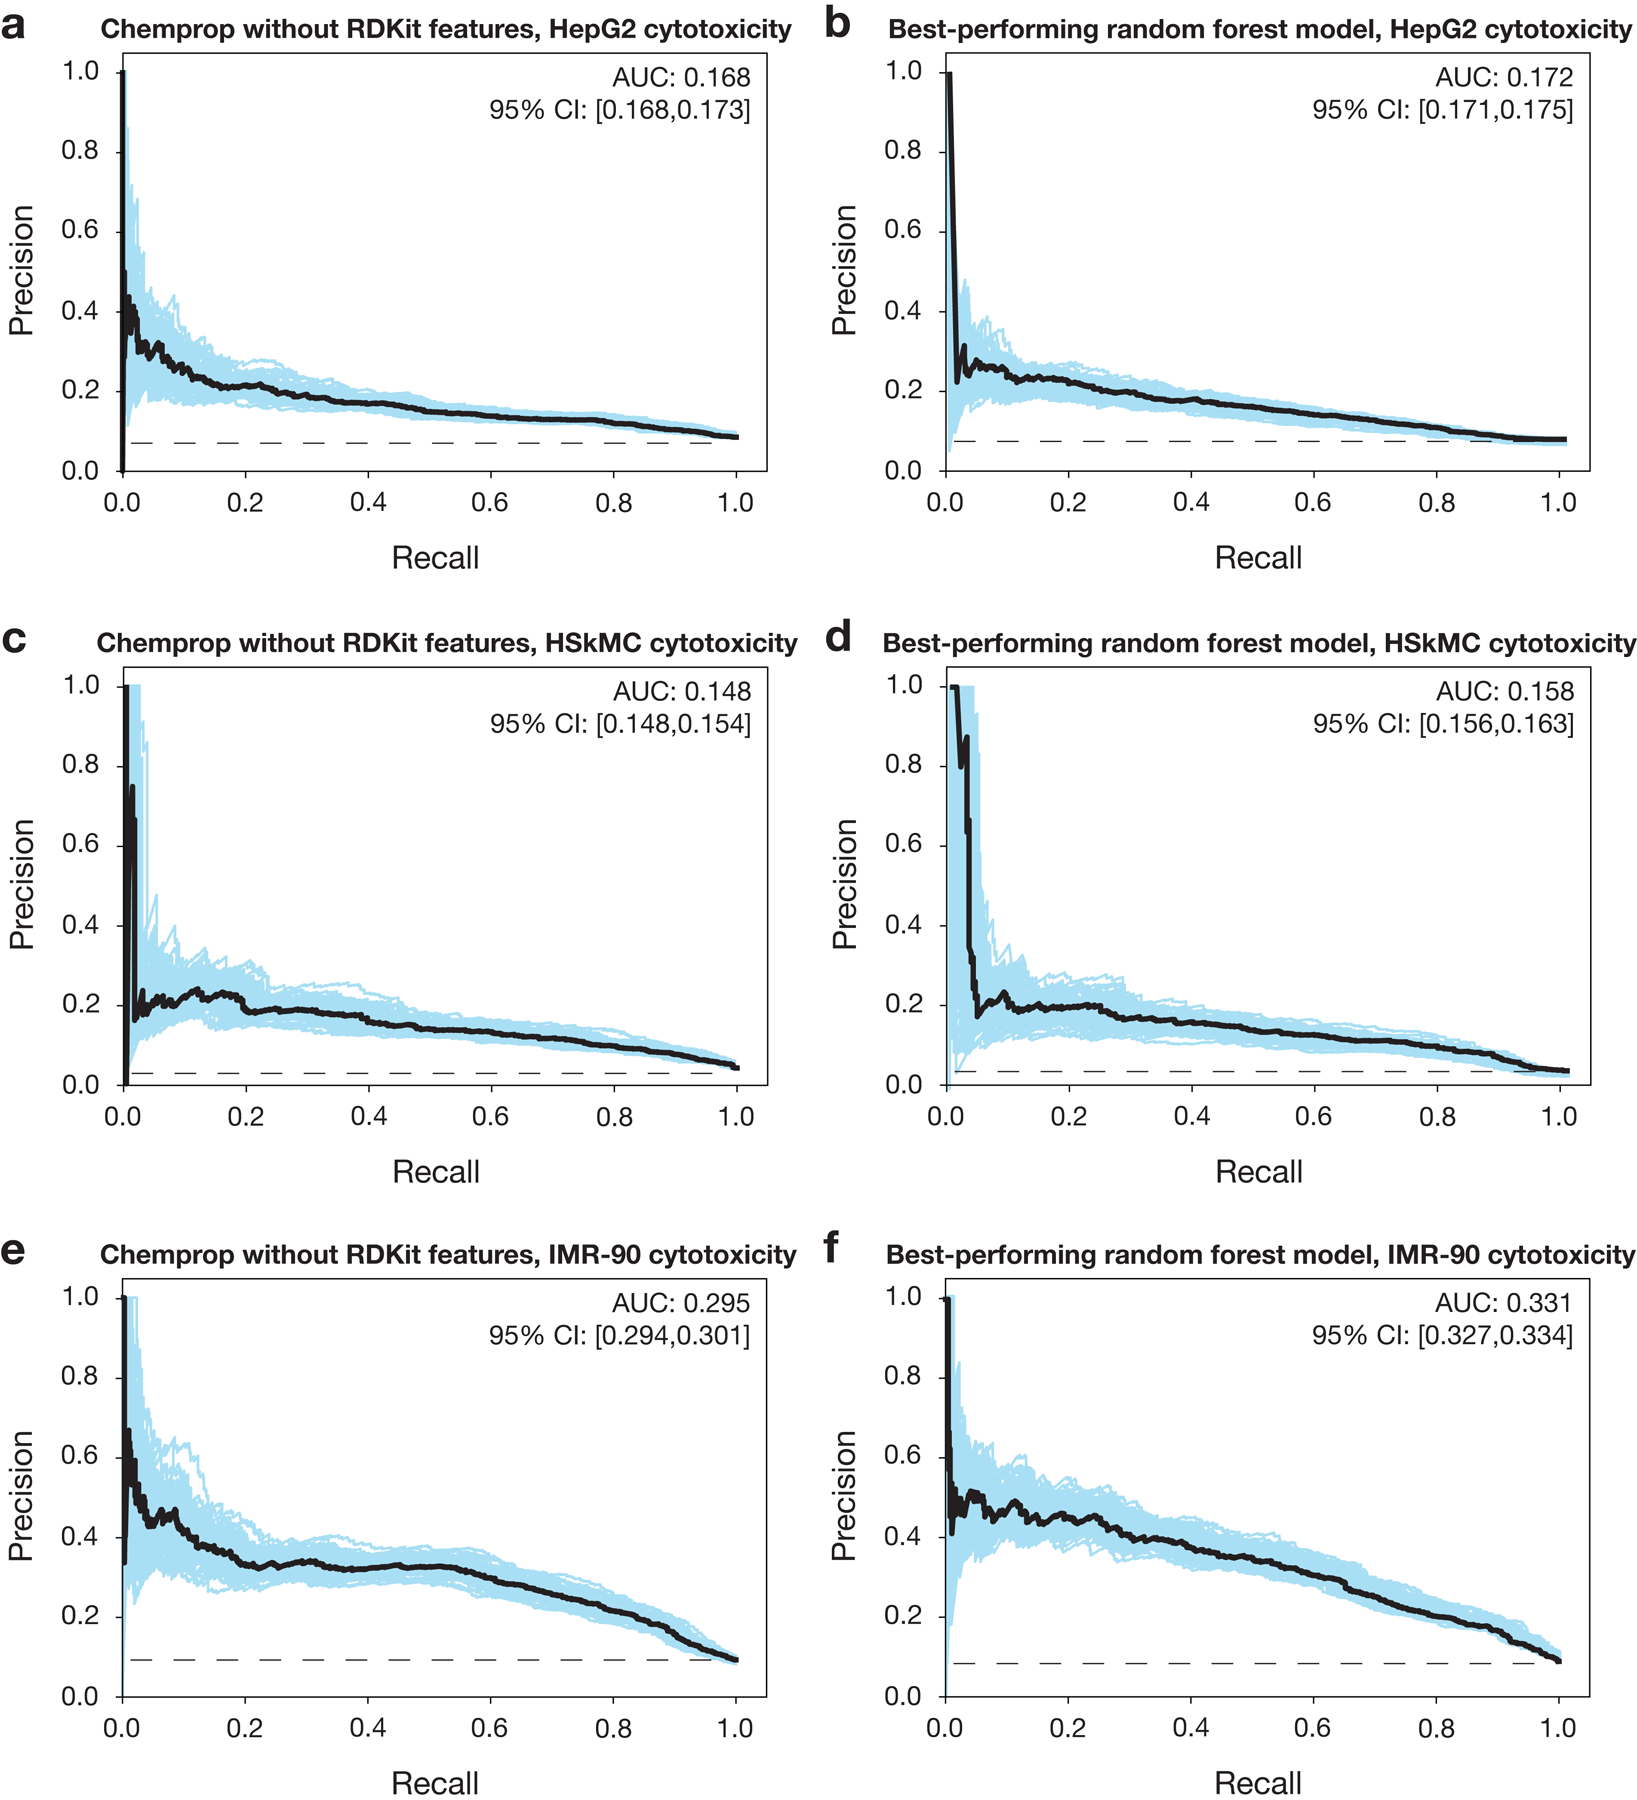
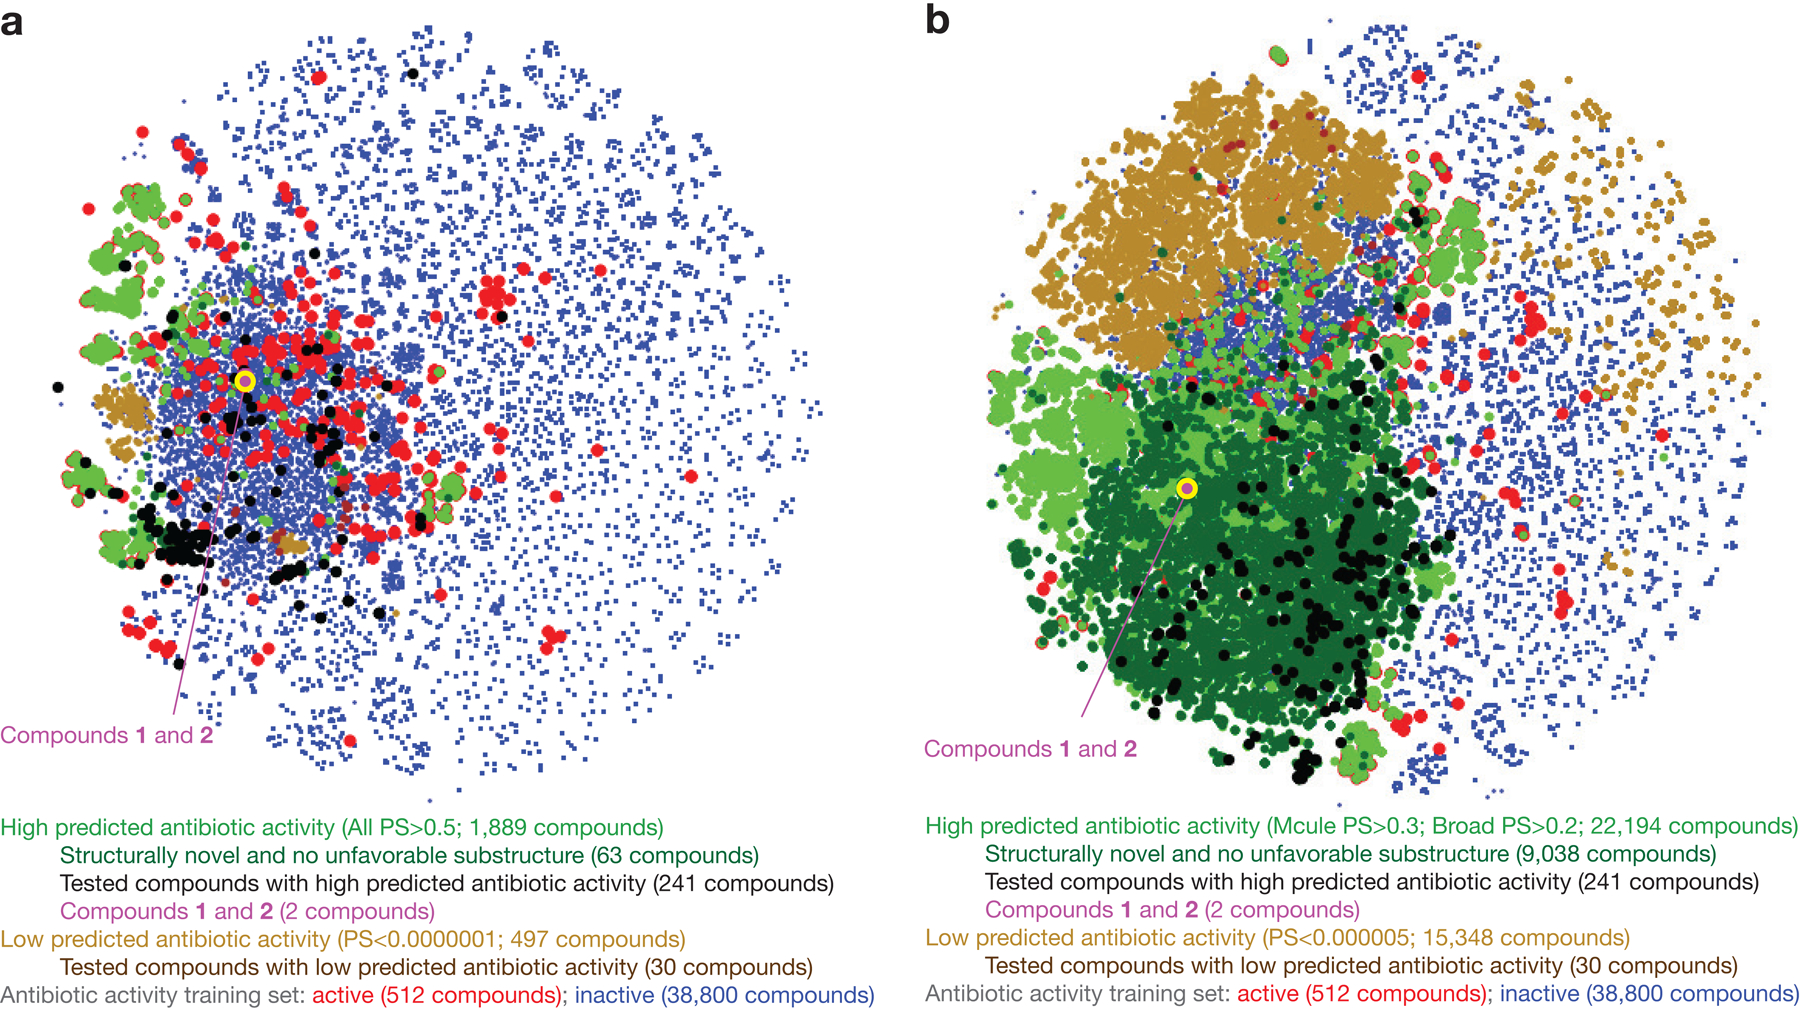
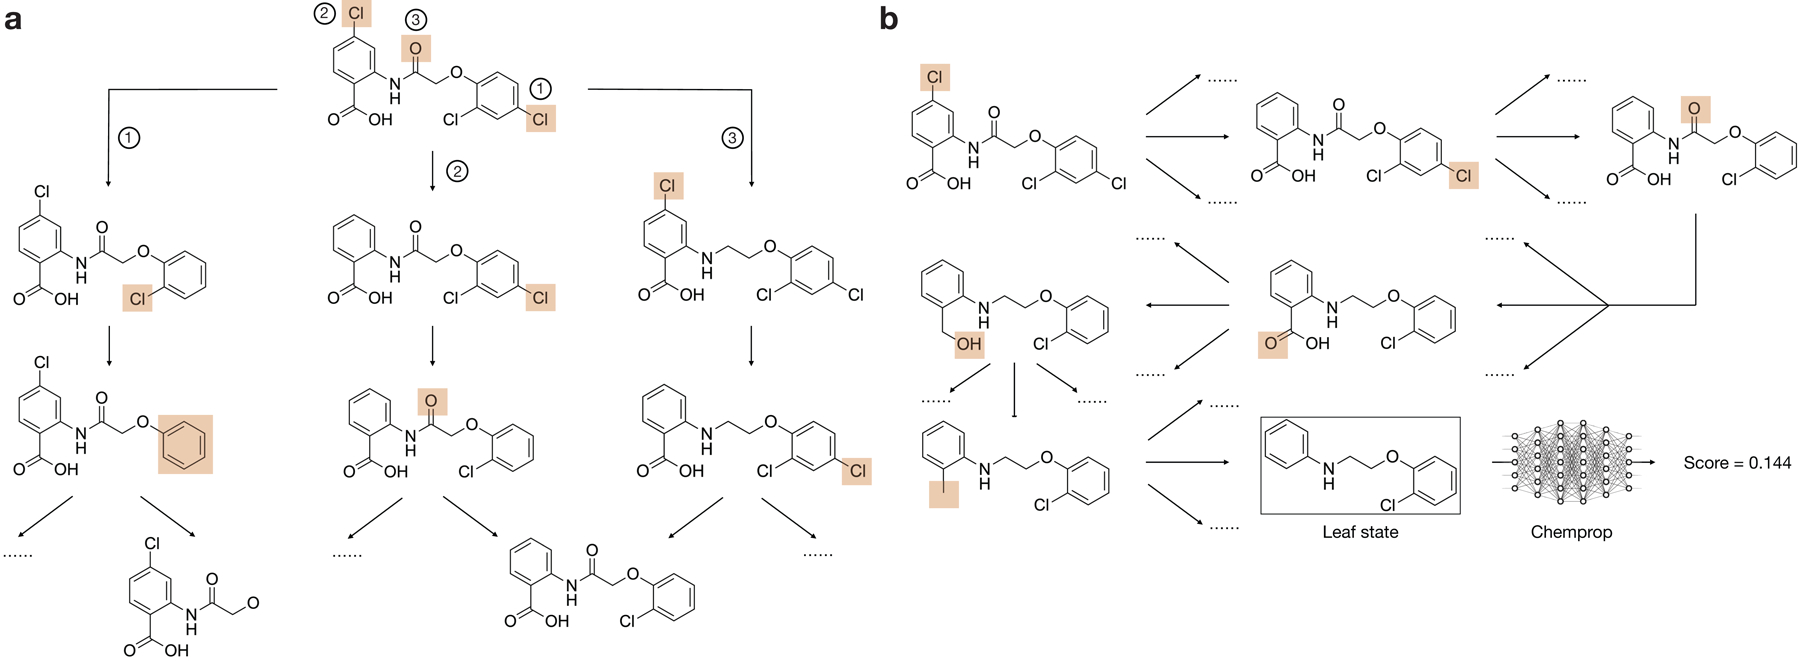
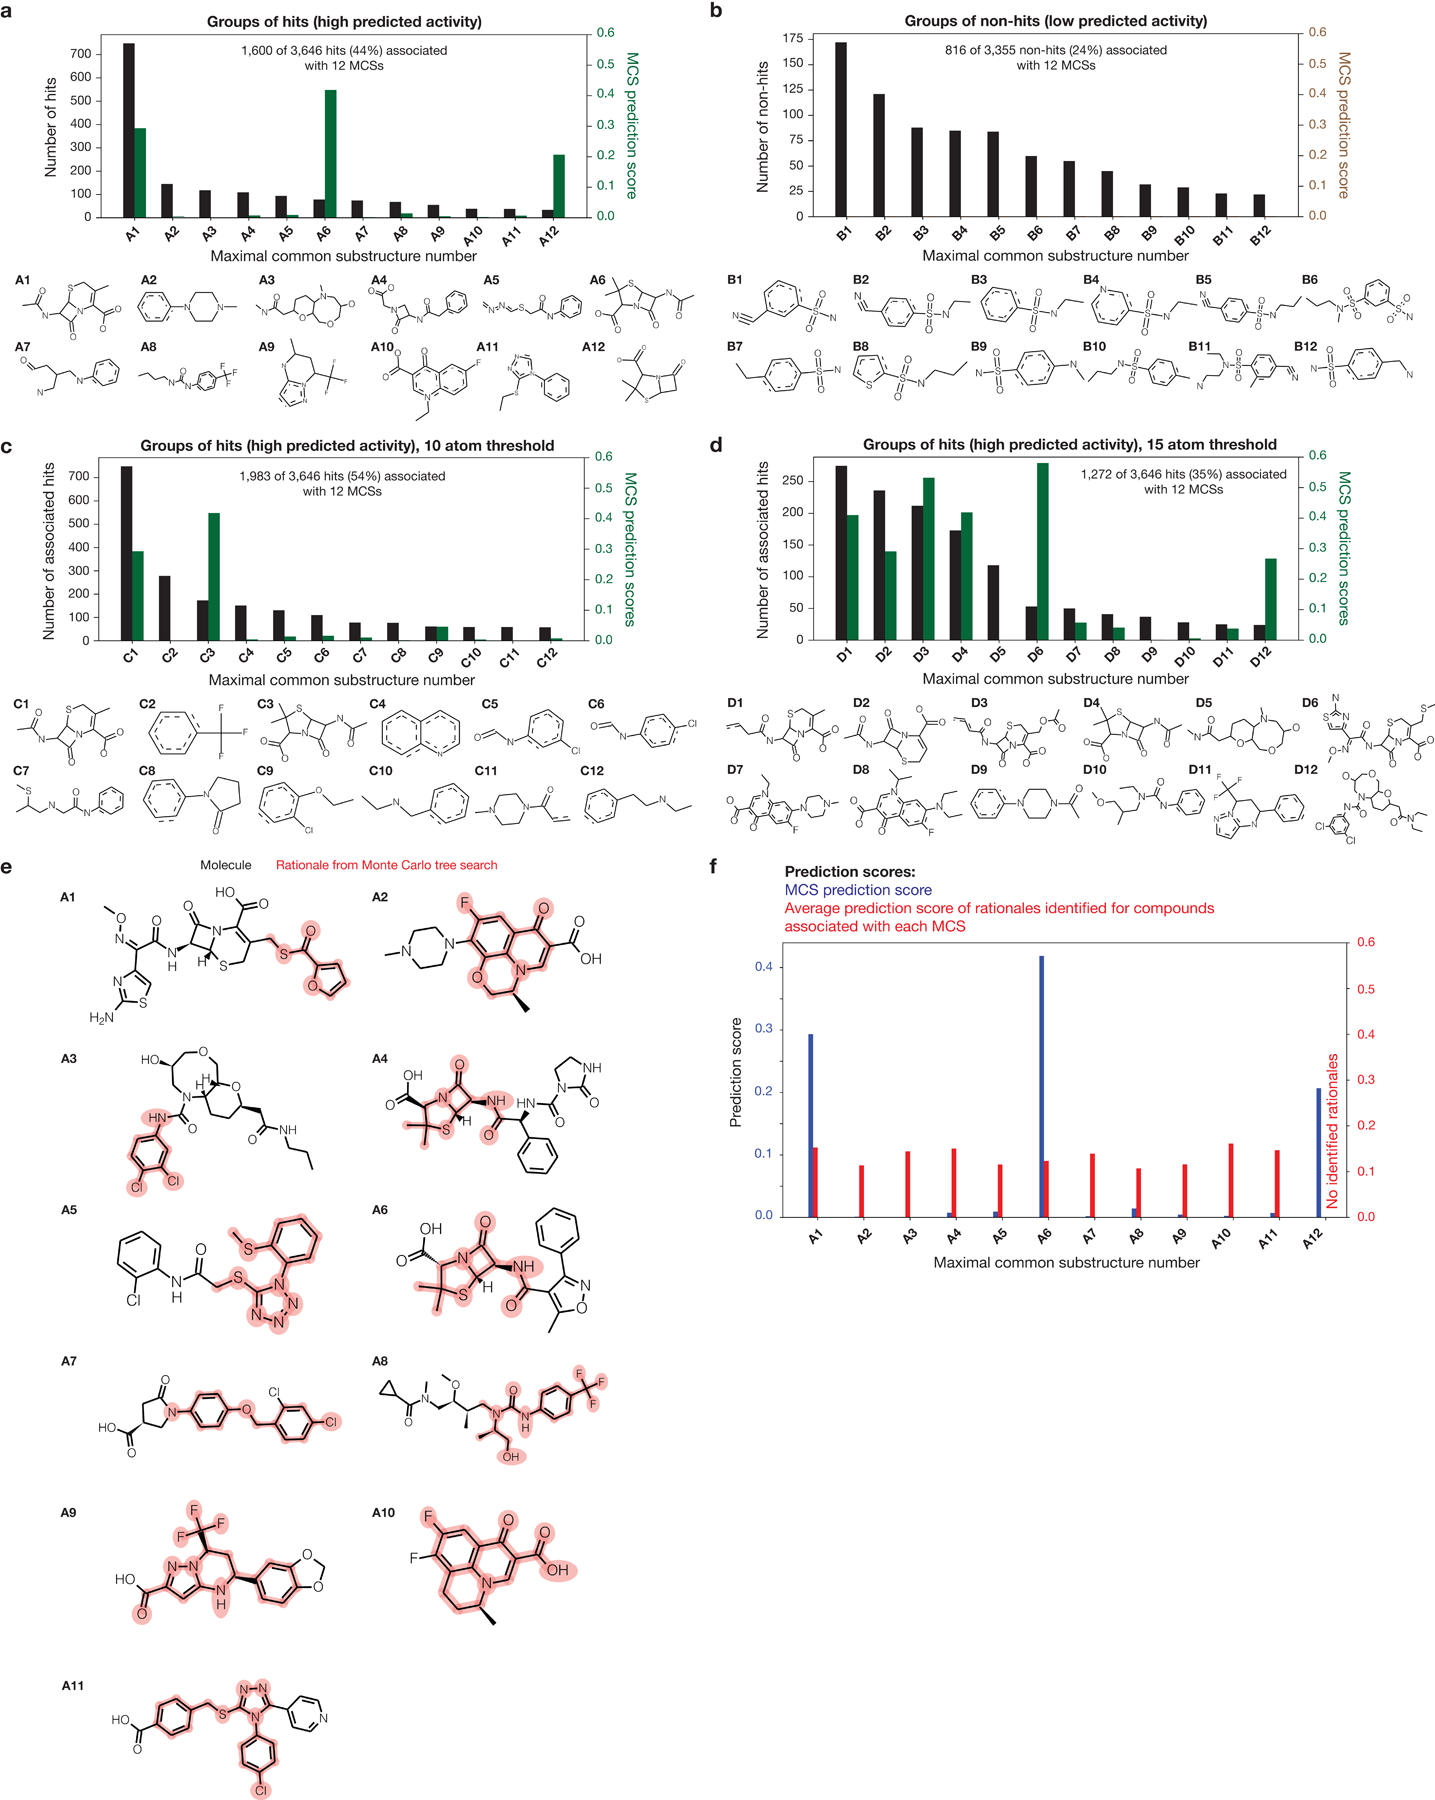
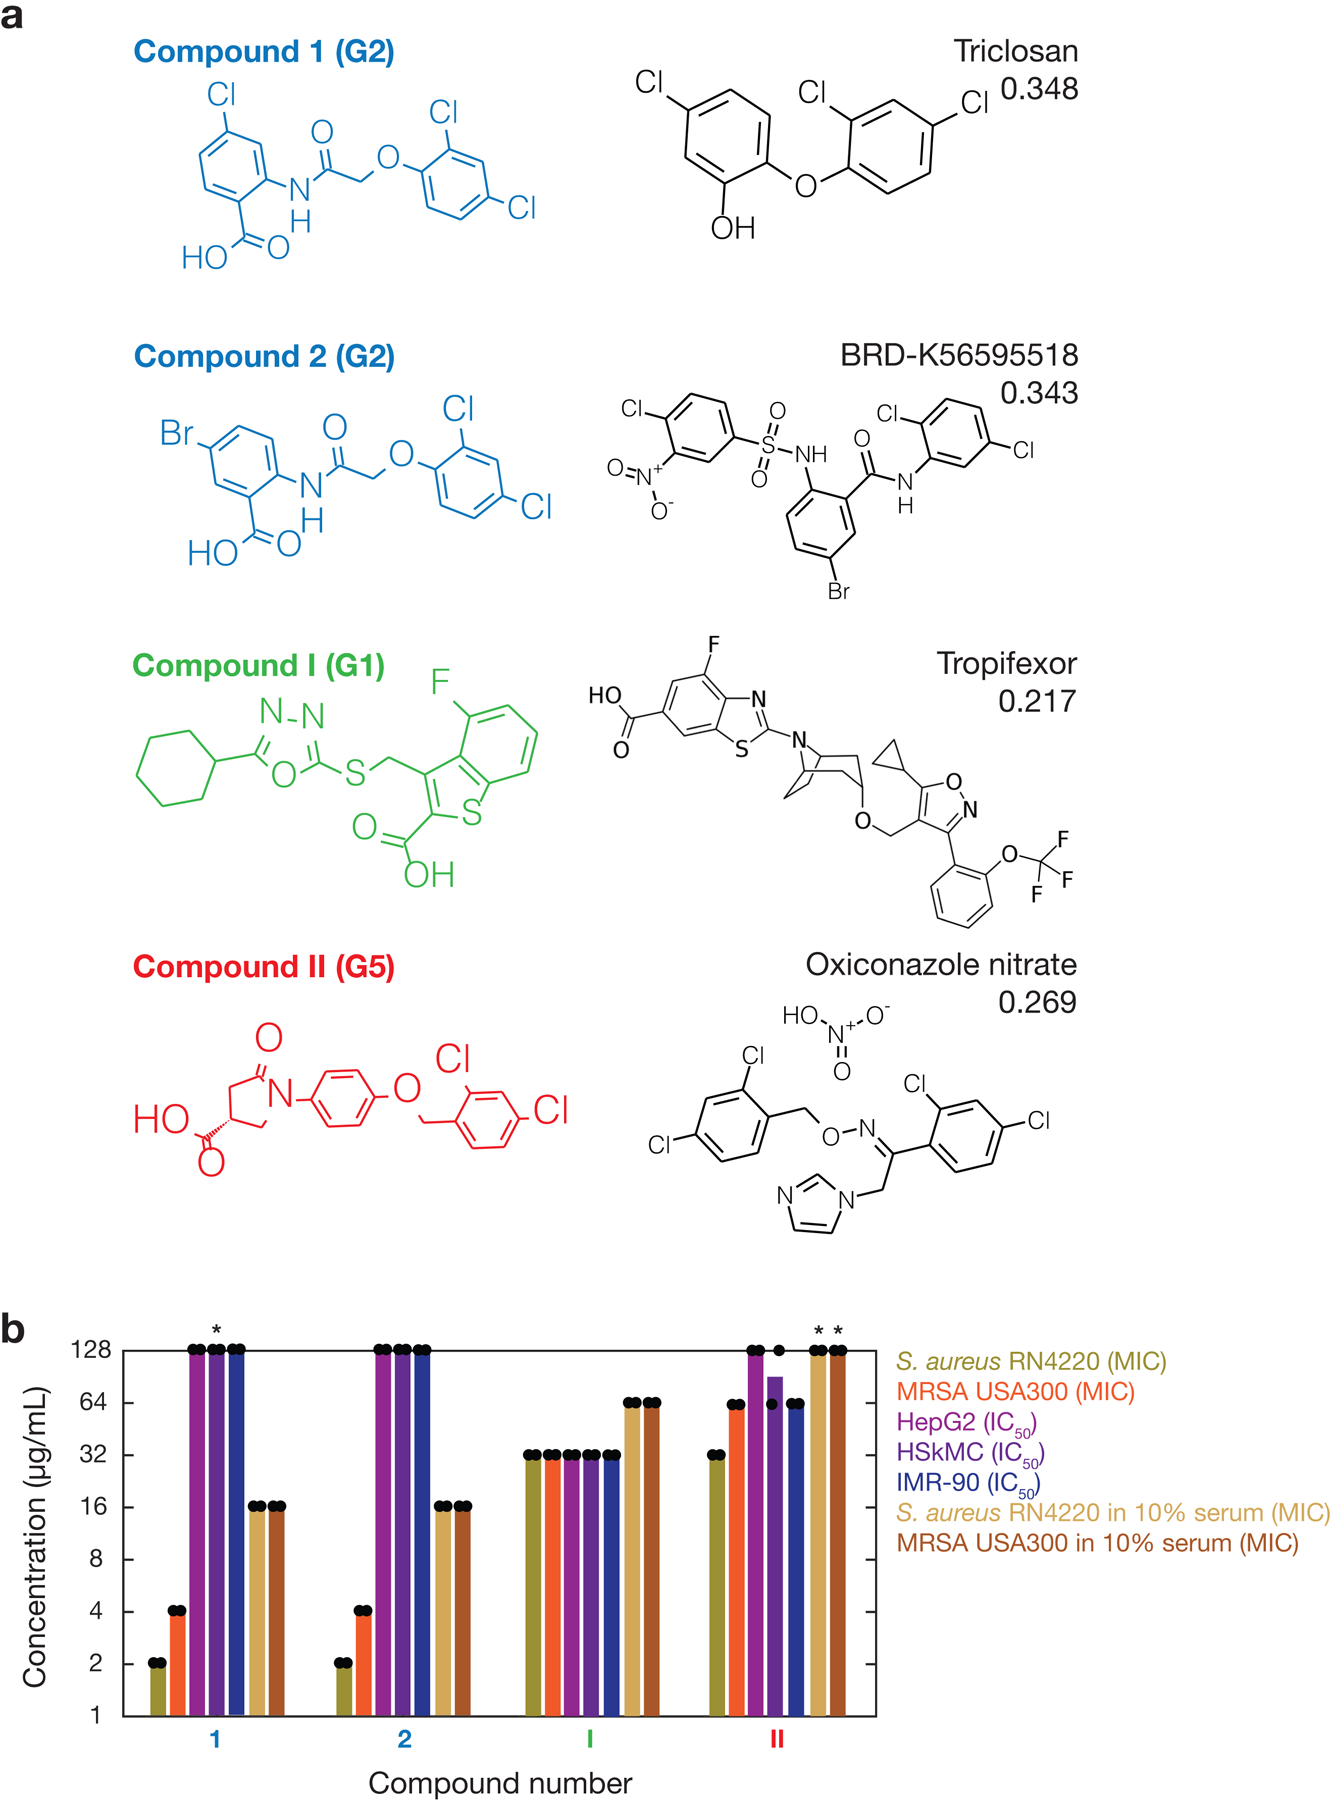
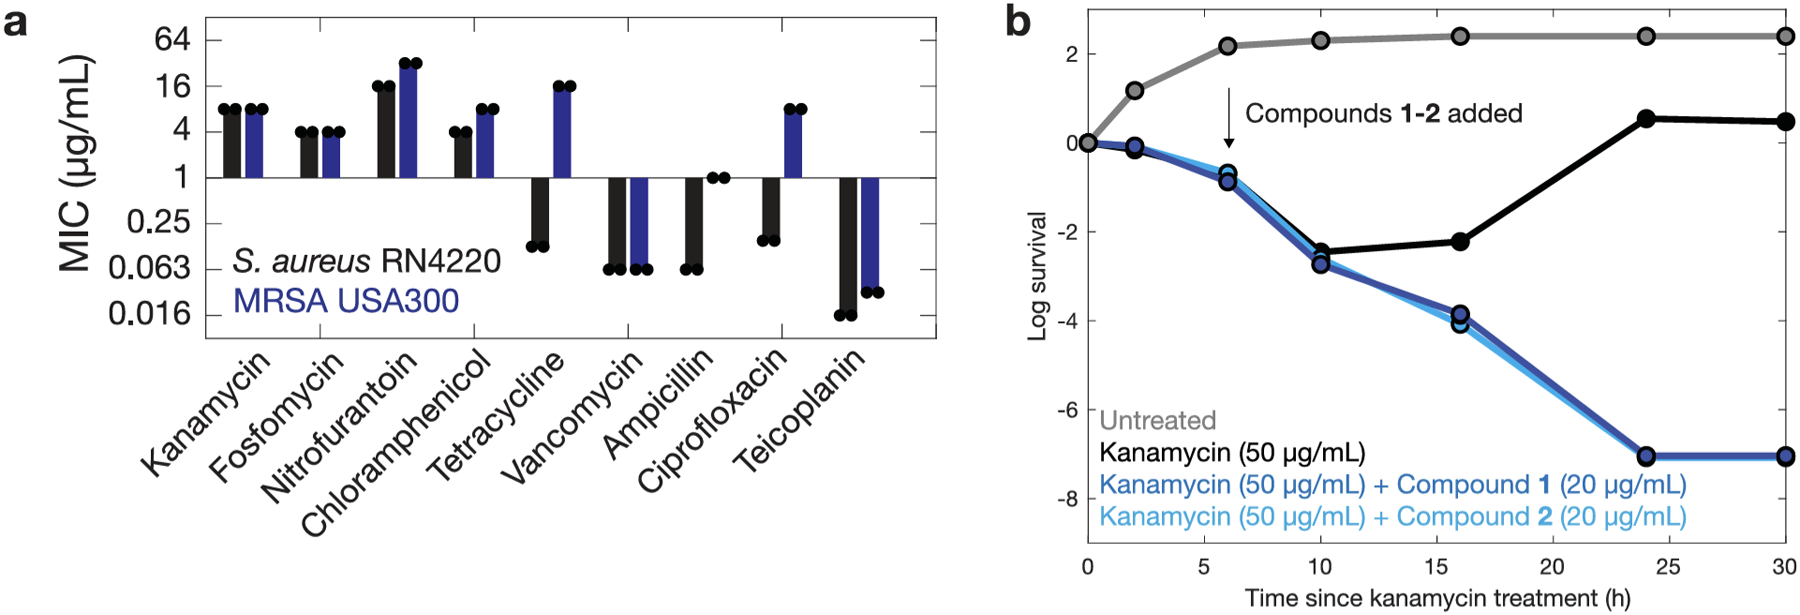
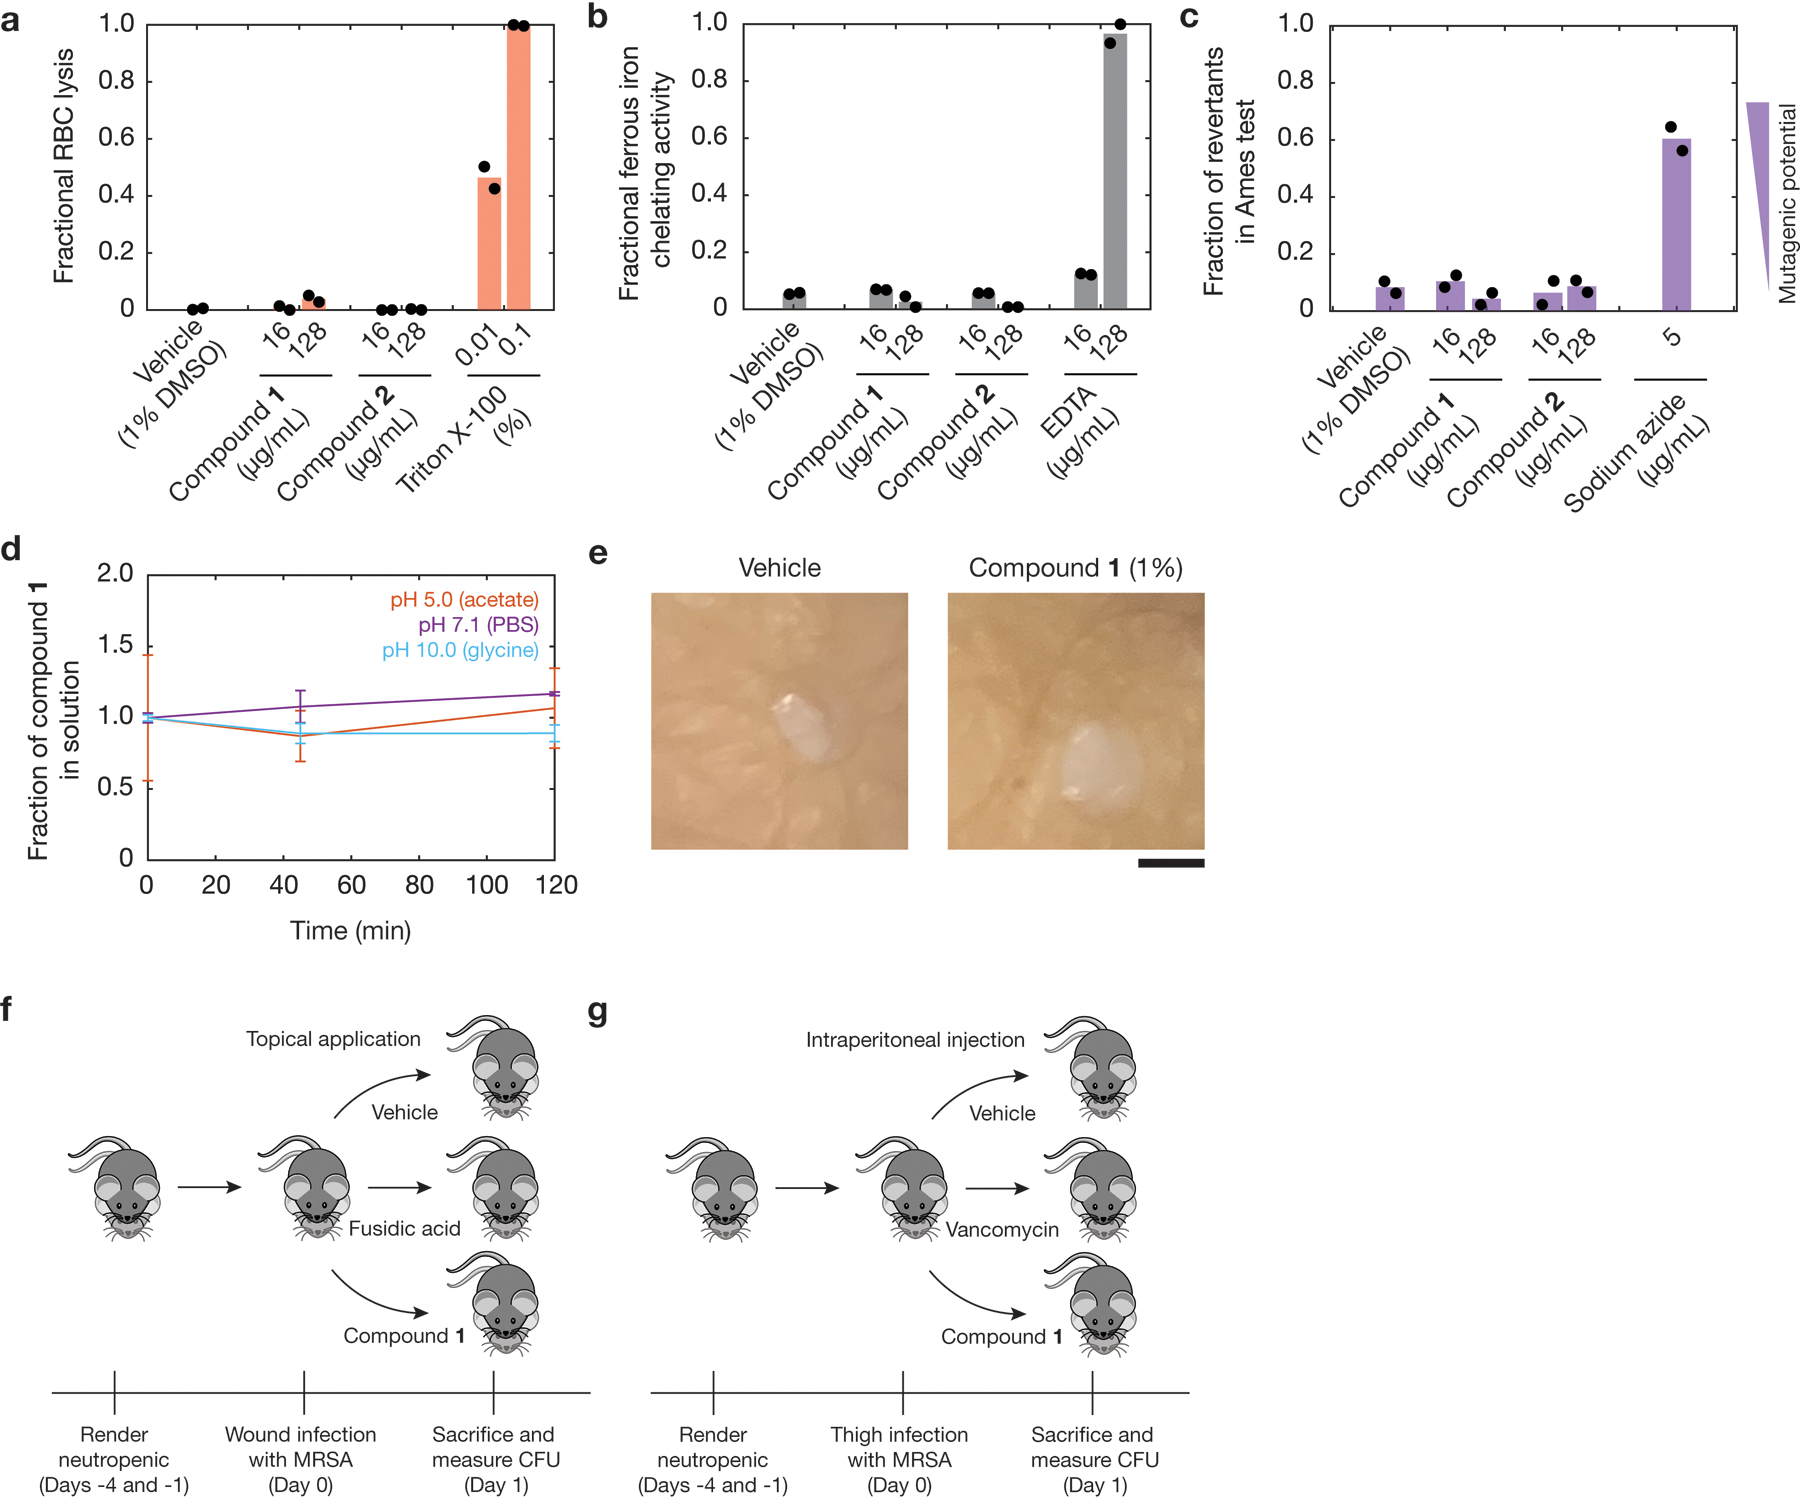
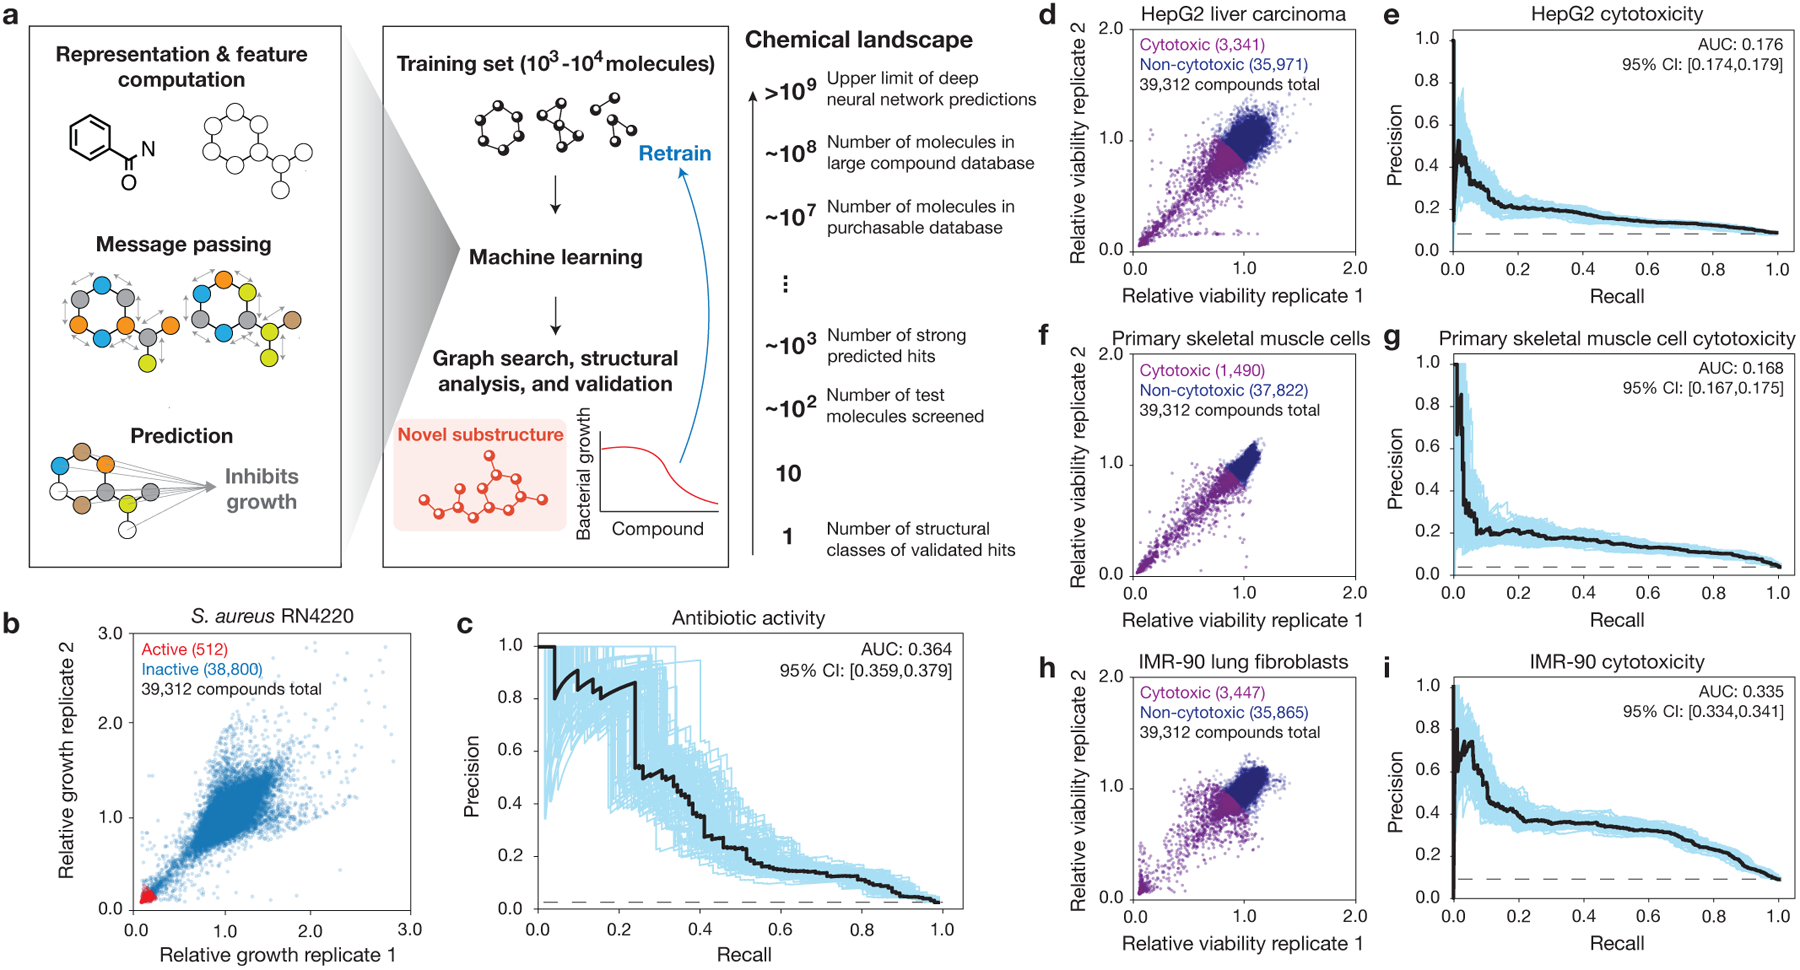
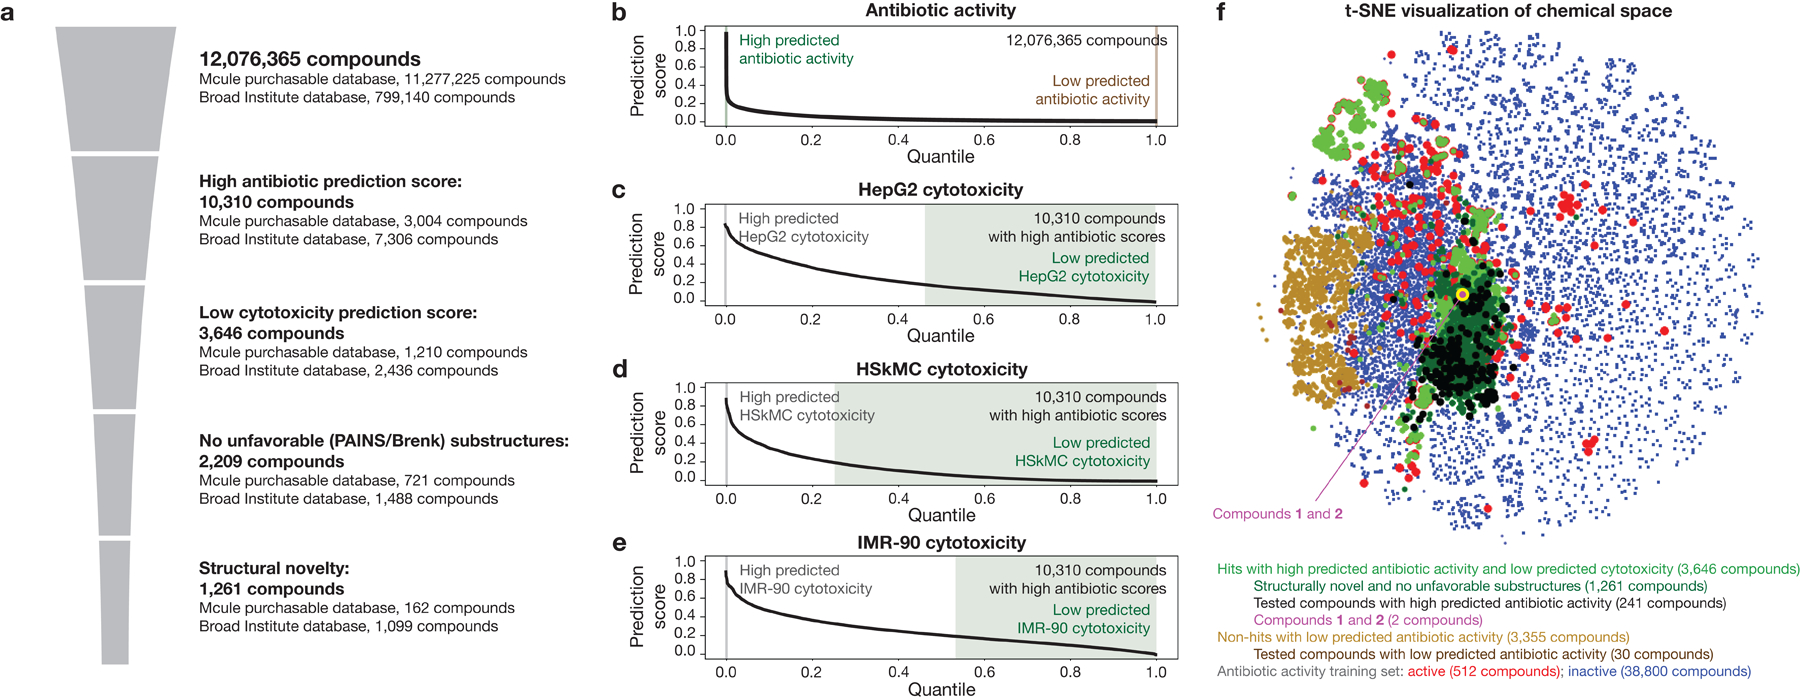
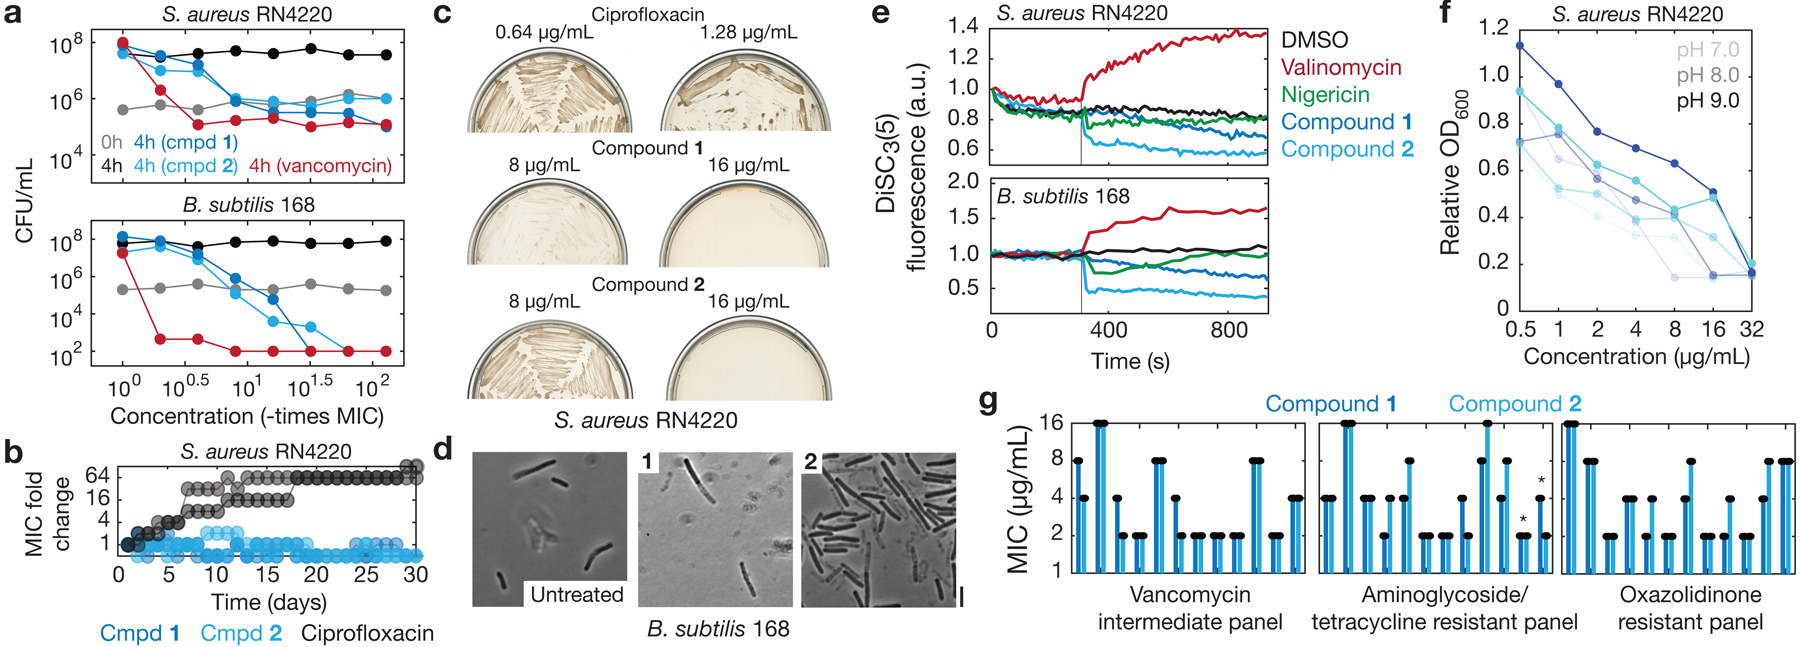
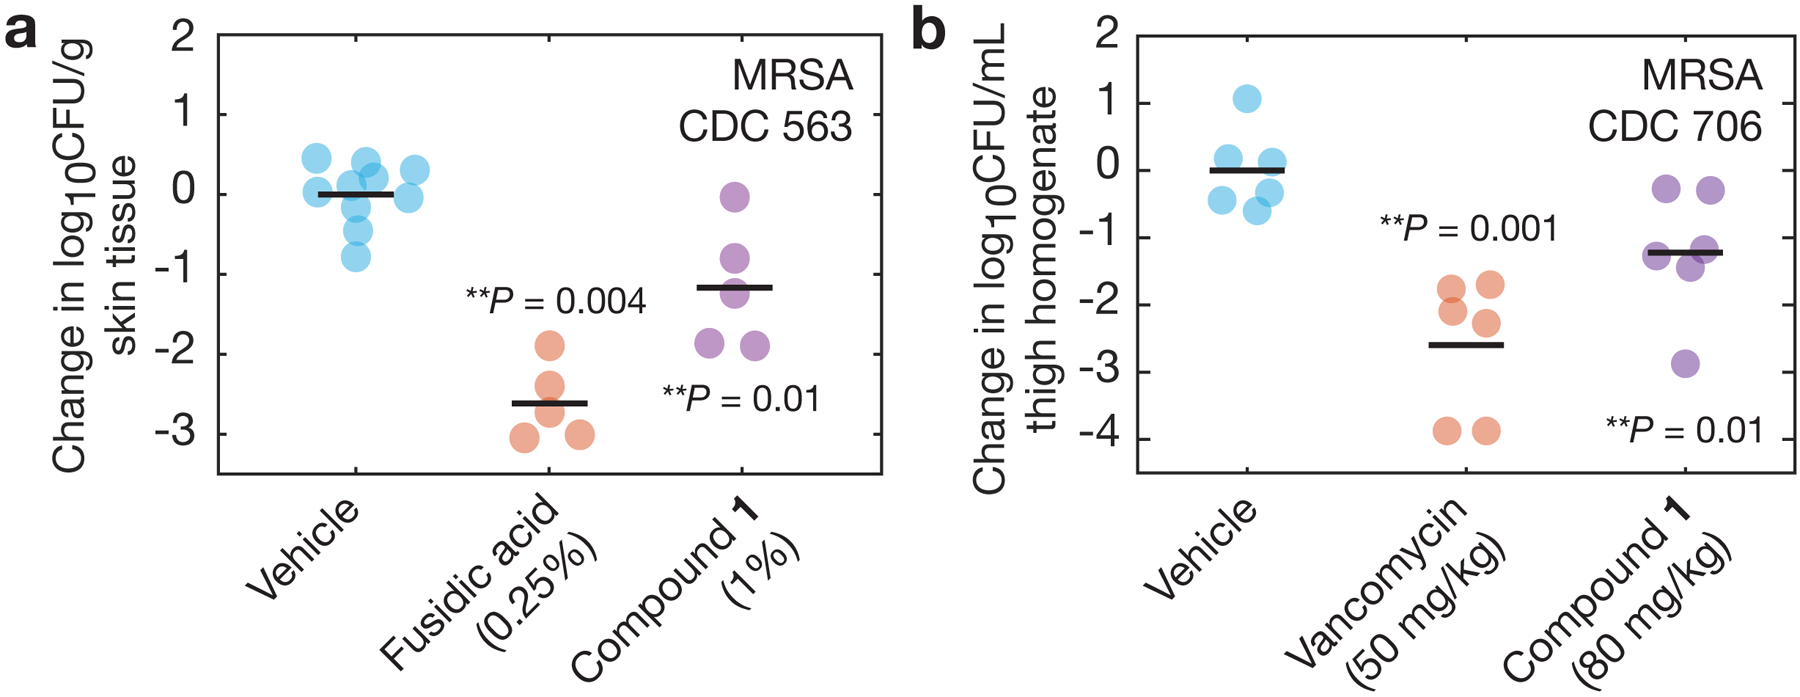
The discovery of novel structural classes of antibiotics is urgently needed to address the ongoing antibiotic resistance crisis1-9. Deep learning approaches have aided in exploring chemical spaces1,10-15; these typically use black box models and do not provide chemical insights. Here we reasoned that the chemical substructures associated with antibiotic activity learned by neural network models can be identified and used to predict structural classes of antibiotics. We tested this hypothesis by developing an explainable, substructure-based approach for the efficient, deep learning-guided exploration of chemical spaces. We determined the antibiotic activities and human cell cytotoxicity profiles of 39,312 compounds and applied ensembles of graph neural networks to predict antibiotic activity and cytotoxicity for 12,076,365 compounds. Using explainable graph algorithms, we identified substructure-based rationales for compounds with high predicted antibiotic activity and low predicted cytotoxicity. We empirically tested 283 compounds and found that compounds exhibiting antibiotic activity against Staphylococcus aureus were enriched in putative structural classes arising from rationales. Of these structural classes of compounds, one is selective against methicillin-resistant S. aureus (MRSA) and vancomycin-resistant enterococci, evades substantial resistance, and reduces bacterial titres in mouse models of MRSA skin and systemic thigh infection. Our approach enables the deep learning-guided discovery of structural classes of antibiotics and demonstrates that machine learning models in drug discovery can be explainable, providing insights into the chemical substructures that underlie selective antibiotic activity.


Conflict of interest statement

Competing interests: J.J.C. is an academic co-founder and Scientific Advisory Board chair of EnBiotix, an antibiotic drug discovery company, and Phare Bio, a non-profit venture focused on antibiotic drug development. J.J.C. is also an academic co-founder and board member of Cellarity and the founding Scientific Advisory Board chair of Integrated Biosciences. J.M.S. is scientific co-founder and scientific director of Phare Bio. F.W. is a co-founder of Integrated Biosciences. S.O. and A.L. contributed to this work as employees of Integrated Biosciences, and S.O. may have an equity interest in Integrated Biosciences. F.W. and J.J.C. have filed a patent based on the results of this work. The remaining authors declare no competing interests.

Figures

Extended Data Fig. 1.
Extended Data Fig. 1.. Molecular weight distribution of the 39,312 compounds screened.
Data are from an original set of 39,312 compounds containing most known antibiotics, natural products, and structurally diverse molecules, with molecular weights between 40 Da and 4,200 Da. Frequency is shown on a log scale.
Extended Data Fig. 2.
Extended Data Fig. 2.. Comparison of deep learning models for predicting antibiotic activity.
a, b, Precision-recall curves for predictions of antibiotic activity, for an ensemble of 10 Chemprop models without RDKit features (a) and the best-performing random forest classifier model based on Morgan fingerprints (b), trained and tested using data from a screen of 39,312 molecules (Fig. 1 of the main text). The black dashed line represents the baseline fraction of active compounds in the training set (1.3%). Blue curves and the 95% confidence interval indicate the variation generated by bootstrapping. AUC, area under the curve.
Extended Data Fig. 3.
Extended Data Fig. 3.. Comparison of deep learning models for predicting human cell cytotoxicity.
a, b, Precision-recall curves for predictions of HepG2 cytotoxicity, for an ensemble of 10 Chemprop models without RDKit features (a) and the best-performing random forest classifier model based on Morgan fingerprints (b), trained and tested using data from a screen of 39,312 molecules (Fig. 1 of the main text). The black dashed line represents the baseline fraction of active compounds in the training set (8.5%). Blue curves and the 95% confidence interval indicate the variation generated by bootstrapping. AUC, area under the curve. c, d, Precision-recall curves for predictions of HSkMC cytotoxicity, for an ensemble of 10 Chemprop models without RDKit features (c) and the best-performing random forest classifier model based on Morgan fingerprints (d), trained and tested using data from a screen of 39,312 molecules (Fig. 1 of the main text). The black dashed line represents the baseline fraction of active compounds in the training set (3.8%). Blue curves and the 95% confidence interval indicate the variation generated by bootstrapping. e, f, Precision-recall curves for predictions of IMR-90 cytotoxicity, for an ensemble of 10 Chemprop models without RDKit features (e) and the best-performing random forest classifier model based on Morgan fingerprints (f), trained and tested using data from a screen of 39,312 molecules (Fig. 1 of the main text). The black dashed line represents the baseline fraction of active compounds in the training set (8.8%). Blue curves and the 95% confidence interval indicate the variation generated by bootstrapping.
Extended Data Fig. 4.
Extended Data Fig. 4.. Visualizing chemical space across different prediction score thresholds.
a, b, t-Distributed neighbor embedding (t-SNE) plot of compounds with high and low antibiotic prediction scores, in addition to compounds in the training set, for different prediction score thresholds. The plot shows the chemical similarity or dissimilarity of various compounds, and active compounds in the training set (red dots) are seen to largely separate compounds with high prediction scores (green, black, and purple dots) from compounds with low prediction scores (brown dots).
Extended Data Fig. 5.
Extended Data Fig. 5.. Examples of rationale calculations using Monte-Carlo tree search.
a, Illustration of the MCTS forward pass using compound 1. The figure shows three possible search paths from the root (compound 1) by deleting peripheral bonds or rings (highlighted in red). Due to space limitations, only three steps from the root are shown. b, Illustration of a complete search path from the root (compound 1) to a leaf node (the rationale). Chemprop is used to predict the activity of each leaf node, and these predictions are used to make updates to the statistics of each intermediate node in the backward pass.
Extended Data Fig. 6.
Extended Data Fig. 6.. Maximal common substructure identification reveals known antibiotic classes, but are less predictive than Chemprop rationales across all hits.
a, b, Rank-ordered numbers of hits (a) and non-hits (b) associated with maximal common substructures (MCSs) identified by a grouping method. Here, any hit associated with any of the MCSs shown shares a minimum of 12 atoms with the MCS. Dashed lines in MCSs indicate either single or double bonds. Each green or brown bar shows the prediction score of each MCS viewed as a molecule in its own right. Where bars are thin, the corresponding MCS prediction scores are approximately zero (including all brown bars in (b)). c, d, Similar to (a), but here, any hit associated with any of the MCSs shown shares a minimum of 10 (c) or 15 (d) atoms with the MCS. e, Illustration of the rationales (red) determined using a Monte Carlo tree search for example hits (black) associated with MCSs A1-A12. No hit associated with MCS A12 possessed a rationale. f, MCS prediction scores (blue bars) and the average prediction scores of all rationales of all hits associated with MCSs A1-A12 (red bars). Where blue bars are thin, the corresponding MCS prediction scores are approximately zero. No hit associated with MCS A12 possessed a rationale.
Extended Data Fig. 7.
Extended Data Fig. 7.. Closest active training set compounds to, and selectivities of, four validated hits associated with rationale groups G1-G5.
a, Closest active compounds (right), as measured by Tanimoto similarity, are from the training set of 39,312 compounds. Compounds are colored according to associated rationale groups (as indicated in parentheses), and the identifier and Tanimoto similarity score of each closest active compound are displayed. b, S. aureus MIC and human cell IC50 values of the four compounds in (a), shown on a log scale. Bars show the means of two biological replicates (points) and are colored by the bacterial strain, human cell type, or media condition tested. Asterisks indicate values larger than 128 μg/mL.
Extended Data Fig. 8.
Extended Data Fig. 8.. Comparison of MICs of different compounds against methicillin-susceptible and methicillin-resistant S. aureus, and eradication of kanamycin persisters by treatment with compounds 1 and 2.
a, MICs of various antibiotics against S. aureus RN4220 (black) and S. aureus USA300 (blue) on a log scale. Bars show the mean of two biological replicates (individual points). b, Survival curves of B. subtilis 168 after combination treatment with kanamycin and compounds 1 and 2, respectively, as determined by plating and CFU counting. Initial CFU values are ~107. Each point is representative of the mean of two biological replicates. Cultures treated with kanamycin in addition to compounds 1 and 2 were eradicated after 24 h (CFU/mL = 0), and these values were truncated to a log survival value of −7 on this plot.
Extended Data Fig. 9.
Extended Data Fig. 9.. Toxicity, chemical properties, and in vivo efficacy of compounds 1 and 2.
a, Fractional hemolysis measurements of human red blood cells (RBCs) treated with compounds 1 and 2 at the indicated final concentrations. Vehicle (1% DMSO) was used as a negative control, and Triton X-100, a detergent, was used as a positive control. Black points indicate values from two biological replicates, and red bars indicate average values. b, Ferrous iron chelation measurements of compounds 1 and 2. Vehicle (1% DMSO) was used as a negative control, and ethylenediaminetetraacetic acid (EDTA), an iron chelator, was used as a positive control. Black points indicate values from two biological replicates, and gray bars indicate average values. c, Ames test mutagenesis measurements of the fractions of revertant S. typhimurium TA100 cultures treated with compounds 1 and 2 at the indicated final concentrations. Vehicle (1% DMSO) was used as a negative control, and 5 μg/mL sodium azide was used as a positive control. Black points indicate values from two biological replicates, and purple bars indicate average values. Higher fractions of revertant cultures indicate higher mutagenic potential (inset). d, Chemical stability of compound 1 in various buffers as a function of incubation time at 37°C. Values are normalized to the mean measurement at time zero, and each point is representative of the mean of two biological replicates. Error bars indicate the full range of values arising from two biological replicates. e, Photographs of WoundSkin models 24 h after topical treatment with compound 1 (1%) or DMSO vehicle. Images are representative of six biological replicates in each treatment group. Scale bar, 2 mm. f, Illustration of the in vivo study of a neutropenic mouse wound infection model using MRSA CDC 563 shown in Fig. 5a of the main text. g, Illustration of the in vivo study of a neutropenic mouse thigh infection model using MRSA CDC 706 shown in Fig. 5b of the main text.
Extended Data Fig. 10.
Extended Data Fig. 10.. Exploration of a structural class through structure-activity relationships.
a, The rationale of compounds 1 and 2, overlaid with chemical modifications (R1-R8) that encompass all compounds used to test SAR (Supplementary Data 2). SAR, structure-activity relationships. b, Analogues of compounds 1 and 2 found to have varying degrees of activity against S. aureus. Corresponding MIC and IC50 values are representative of two biological replicates.
Fig. 1.
Fig. 1.. Ensembles of deep learning models for predicting antibiotic activity and human cell cytotoxicity.
a, Schematic of the approach. Graph neural networks predict the chemical properties of >109 molecules in silico, in contrast to expensive and time-consuming experimental screening of large chemical libraries. Here, the growth inhibition activities of 39,312 chemically diverse compounds are used to train the model, the model is applied to virtual chemical databases comprising 12,076,365 molecules that can be readily procured, and compounds with high prediction scores (“hits”) are analyzed according to structural class, procured, and tested. This approach can be iterated, and the model can be retrained to generate new predictions. b, S. aureus RN4220 growth inhibition data for a screen of 39,312 compounds at a final concentration of 50 μM. Data are from two biological replicates. Active compounds are those for which the mean relative growth is <0.2. c, Precision-recall curves for an ensemble of 10 Chemprop models, augmented with RDKit features, trained and tested on the data in (b). The black dashed line represents the baseline fraction of active compounds in the dataset (1.3%). Blue curves and the 95% confidence interval (CI) indicate variation from bootstrapping. AUC, area under the curve. d, f, h, HepG2 (d), HSkMC (f), and IMR-90 (h) viability data for screens of 39,312 compounds at a final concentration of 10 μM. Data are from two biological replicates for each cell type. Cytotoxic compounds are those for which the mean relative viability is <0.9. e, g, i, Precision-recall curves for an ensemble of 10 Chemprop models, augmented with RDKit features, trained and tested on the data in (d,f,h). Black dashed lines represent the baseline fractions of cytotoxic compounds in the datasets (e, 8.5%; g, 3.8%; i, 8.8%). Blue curves and the 95% confidence interval (CI) indicate variation from bootstrapping.
Fig. 2.
Fig. 2.. Filtering and visualizing chemical space.
a, In silico filtering procedure. Trained graph neural networks are applied to make predictions of antibiotic activity for 12,076,365 compounds from the Mcule purchasable database and a Broad Institute database. Compounds with high (>0.4 for the Mcule database, and >0.2 for the Broad Institute database) prediction scores for antibiotic activity are retained, and similar graph neural networks are applied to predict the cytotoxicity of these compounds for HepG2 cells, HSkMCs, and IMR-90 cells. Compounds with low (<0.2) cytotoxicity prediction scores for all cell types are retained, then computationally tested for the presence of promiscuously reactive or unfavorable chemical substructures (PAINS and Brenk substructures). Finally, the remaining compounds are filtered for structural novelty, as defined by a Tanimoto similarity score of <0.5 with respect to any active compound in the training dataset and lack of a quinolone bicyclic core or β-lactam ring. b, Rank-ordered antibiotic activity prediction scores of all 12,076,365 compounds for which antibiotic activity was predicted. c-e, Rank-ordered HepG2 (c), HSkMC (d), and IMR-90 (e) cytotoxicity prediction scores of 10,310 compounds with high antibiotic activity prediction scores. f, t-Distributed neighbor embedding (t-SNE) plot of compounds with high and low antibiotic prediction scores, in addition to compounds in the training set. The plot shows the chemical similarity or dissimilarity of various compounds, and active compounds in the training set (red dots) are seen to largely separate compounds with high prediction scores (green, black, and purple dots) from compounds with low prediction scores (brown dots).
Fig. 3.
Fig. 3.. Graph-based rationales reveal scaffolds for prospective antibiotic classes.
a, Illustration of the Monte Carlo tree search method resulting in chemical structure rationales (graph substructures) with high predicted antibiotic activity. b, A rationale (red) determined using a Monte Carlo tree search for cefmenoxime, an example hit compound. Here, the rationale overlaps with the cephalosporin core and results, by itself, in an antibiotic prediction score of 0.149. For comparison, the cephalosporin core is shown in black. c, Rank-ordered Tanimoto similarity scores of all hits with respect to active compounds in the training set. A threshold of 0.5 was used to threshold predicted hits that are structurally distinct from active compounds in the training set. d, Rank-ordered numbers of hits with rationales in rationale groups with conserved scaffolds, for 186 hits with rationales found in 1,261 structurally novel hits containing no unfavorable substructures. Here, 16 hits with rationales were associated with five scaffolds, G1-G5. e, Rank-ordered antibiotic activity prediction scores of 253 compounds with high (>0.2) antibiotic prediction scores and 30 compounds with low (<0.1) antibiotic prediction scores procured for empirical testing. True positives are colored in purple, and true negatives are colored in brown. f, Chemical structures of compounds 1 and 2, two structurally novel hits associated with rationale group G2 that possess no unfavorable substructures and were found to inhibit the growth of S. aureus RN4220. The rationales (red) are identical for both compounds, resulting in an antibiotic prediction score of 0.144. g, S. aureus MIC and human cell IC50 values of compounds 1 and 2, shown on a log scale. Bars show the means of two biological replicates (points) and are colored by the bacterial strain, human cell type, or media condition tested. Asterisks indicate values larger than 128 μg/mL.
Fig. 4.
Fig. 4.. Resistance and mechanism of action of a structural class.
a, Time-kill measurements for log-phase S. aureus RN4220 and B. subtilis 168 treated with compounds 1 and 2, vancomycin, or untreated. Data are from two biological replicates, and points indicate mean values. Where applicable, CFU/mL values less than 102 were truncated to a value of 102 to reflect the lower limit of quantification. b, MIC fold changes in serial passaging experiments, in which S. aureus RN4220 was passaged in liquid LB every 24 h for 30 days. Two biological replicates (individual curves) are shown for each compound, and fold change is on a log scale. c, Growth of suppressor mutants in evolution experiments, in which S. aureus RN4220 was plated at 109 CFU on LB agar plates containing compound, incubated for 5 days, then streaked on fresh compound-containing LB agar plates. Each image represents two biological replicates. d, Phase contrast images of log-phase B. subtilis 168 cells treated with compounds 1 and 2 (16 μg/mL) for 3 h. Scale bar, 3 μm. Results shown represent three biological replicates. e, DiSC3(5) fluorescence in log-phase S. aureus RN4220 and B. subtilis 168 during treatment with DMSO (1%), valinomycin and nigericin (~1 mg/mL), and compounds 1 and 2 (32 μg/mL). Cells were treated at time 300 s (vertical lines). Results shown represent three biological replicates. g, OD600 measurements from S. aureus RN4220 cultures incubated overnight with compounds 1 and 2 across different media pH levels. Each growth curve shows one biological replicate, and results shown represent two biological replicates. h, MIC values of compounds 1 and 2 against CDC MRSA and VRE isolates, shown on a log scale. Bars show the means of two biological replicates (points). Asterisks denote bars corresponding to VRE isolates. All other bars correspond to MRSA isolates.
Fig. 5.
Fig. 5.. In vivo efficacy.
a, b, In vivo study of a neutropenic mouse wound infection model using MRSA CDC 563 (a) and a neutropenic mouse thigh infection model using MRSA CDC 706 (b), as described in Methods. In a, treatment was administered topically beginning 1 h post-infection and at 4, 8, 12, 20, and 24 h post-infection. n = 5 mice were used in each group, and the fusidic acid and compound 1 treatment arms were tested against vehicle treatment on separate occasions; points for both vehicle groups are overlaid. In b, treatment was administered single-dose intraperitoneally at 1 h post-infection, and n = 6 mice were used in each treatment group. Horizontal lines indicate mean log10 CFU/g values. One-sided, two-sample permutation test compared to vehicle treatment: **p ≤ 10−2.

Comment in

References

    1. Stokes JM et al. A deep learning approach to antibiotic discovery. Cell 180, 688–702 (2020). - PMC - PubMed
    1. Imai Y et al. A new antibiotic selectively kills Gram-negative pathogens. Nature 576, 459–464 (2019). - PMC - PubMed
    1. Ling LL et al. A new antibiotic kills pathogens without detectable resistance. Nature 517, 455–459 (2015). - PMC - PubMed
    1. Martin JK II et al. A dual-mechanism antibiotic kills Gram-negative bacteria and avoids drug resistance. Cell 181, 1–15 (2020). - PMC - PubMed
    1. Lewis K Platforms for antibiotic discovery. Nat. Rev. Drug Dis 12, 371–387 (2013). - PubMed

MeSH terms

Substances