. 2023 Dec;12(12):e12394.
doi: 10.1002/jev2.12394.

Extracellular vesicle-associated cholesterol supports the regenerative functions of macrophages in the brain

Affiliations

Extracellular vesicle-associated cholesterol supports the regenerative functions of macrophages in the brain

Sam Vanherle et al. J Extracell Vesicles. 2023 Dec.

Abstract

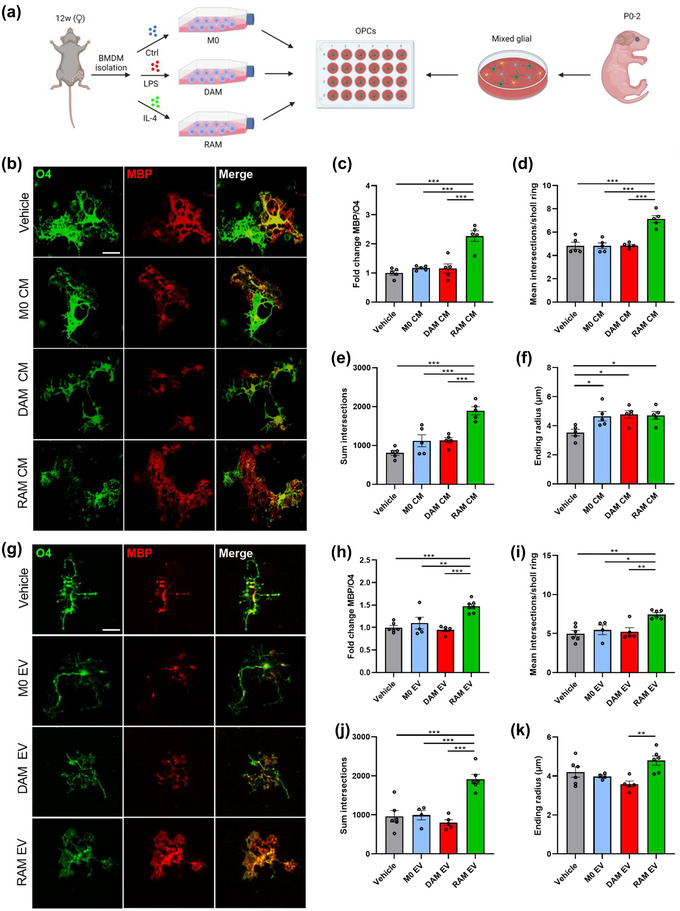
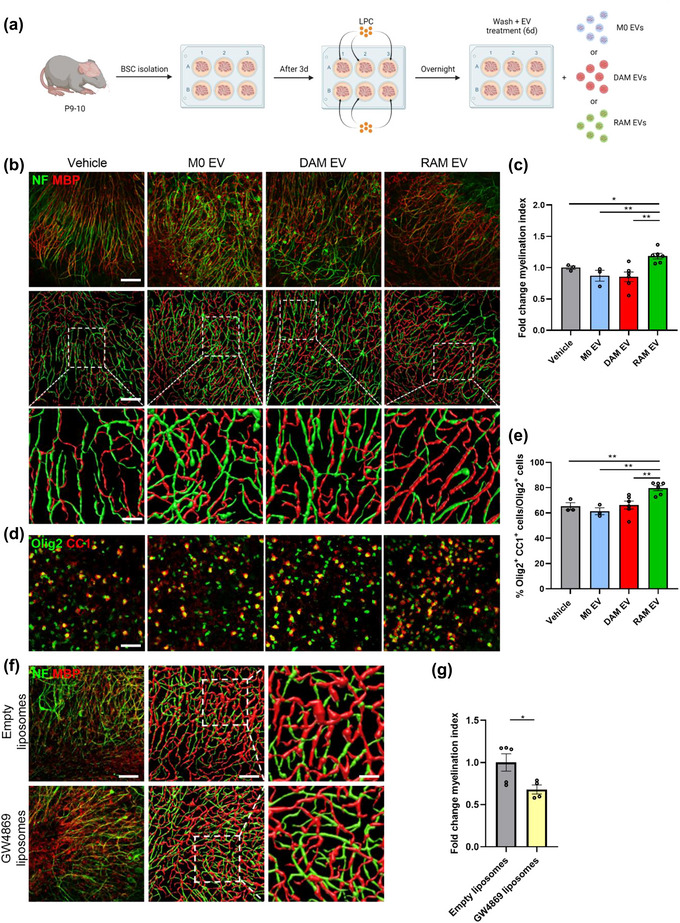
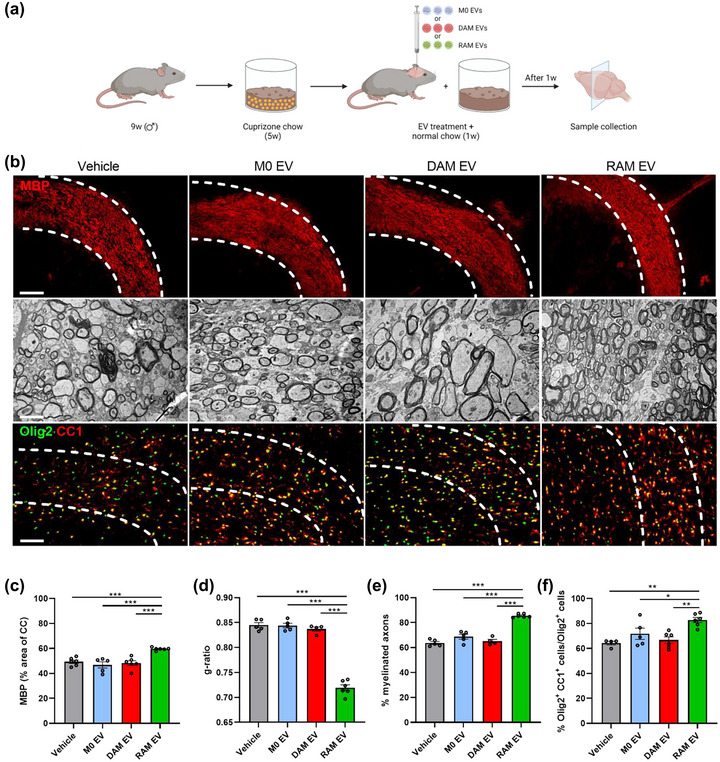
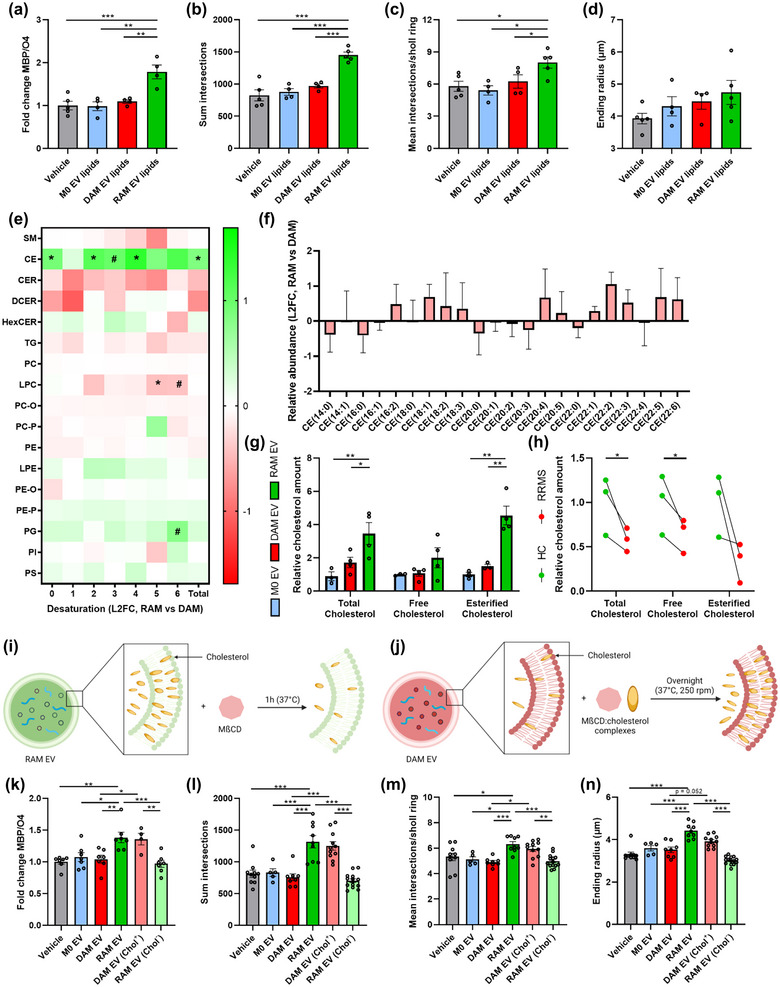
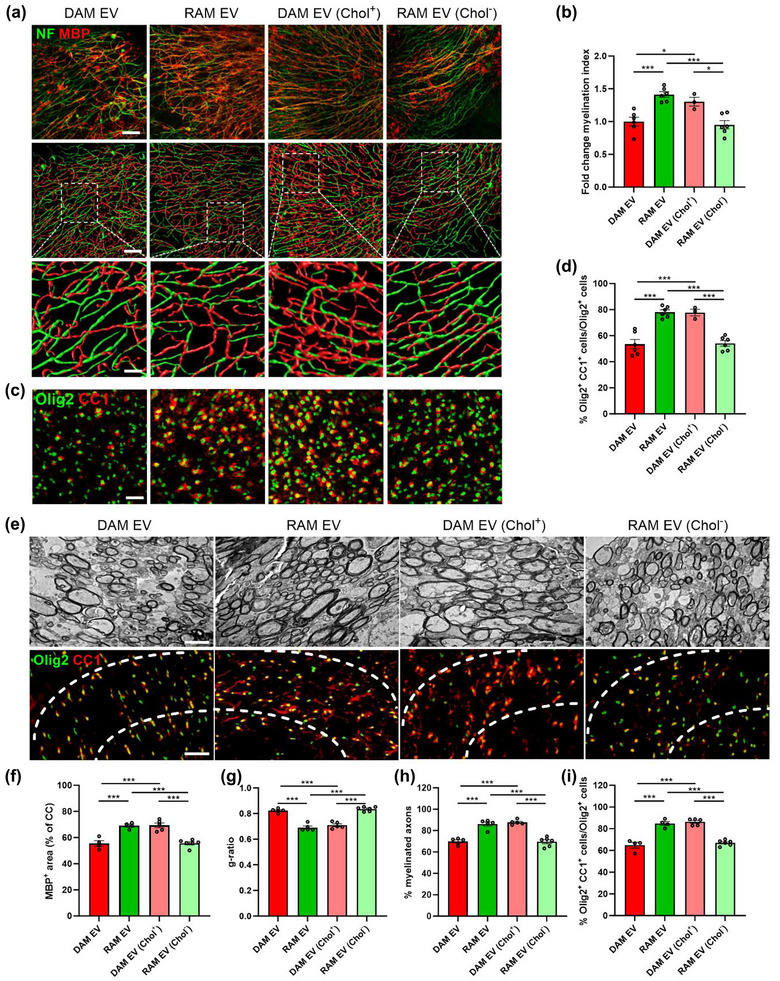
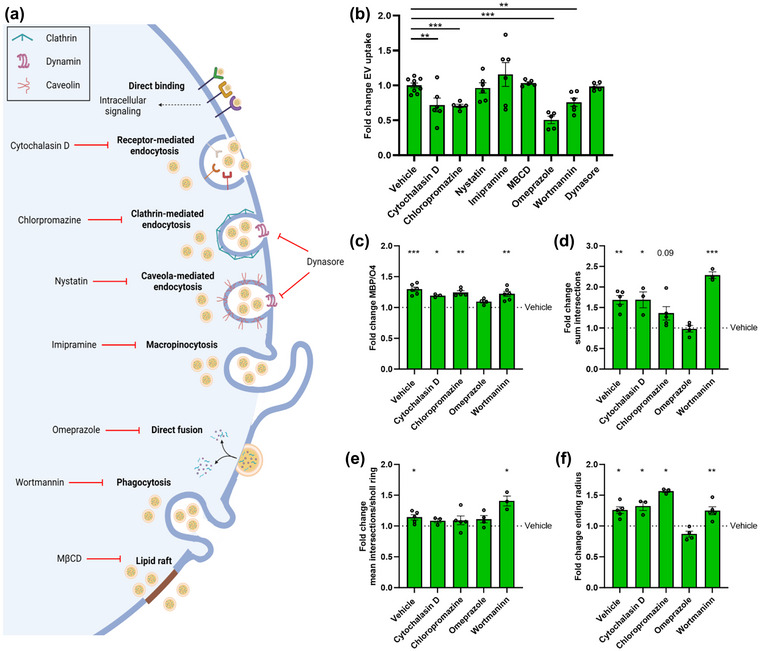
Macrophages play major roles in the pathophysiology of various neurological disorders, being involved in seemingly opposing processes such as lesion progression and resolution. Yet, the molecular mechanisms that drive their harmful and benign effector functions remain poorly understood. Here, we demonstrate that extracellular vesicles (EVs) secreted by repair-associated macrophages (RAMs) enhance remyelination ex vivo and in vivo by promoting the differentiation of oligodendrocyte precursor cells (OPCs). Guided by lipidomic analysis and applying cholesterol depletion and enrichment strategies, we find that EVs released by RAMs show markedly elevated cholesterol levels and that cholesterol abundance controls their reparative impact on OPC maturation and remyelination. Mechanistically, EV-associated cholesterol was found to promote OPC differentiation predominantly through direct membrane fusion. Collectively, our findings highlight that EVs are essential for cholesterol trafficking in the brain and that changes in cholesterol abundance support the reparative impact of EVs released by macrophages in the brain, potentially having broad implications for therapeutic strategies aimed at promoting repair in neurodegenerative disorders.

Keywords: cholesterol; extracellular vesicle; oligodendrocyte precursor cell differentiation; remyelination; repair-associated macrophage.


Conflict of interest statement

The authors declare no competing interests.

Figures

FIGURE 1
FIGURE 1
Extracellular vesicles released by RAMs improve OPC differentiation. (a) Schematic representation showing the isolation of oligodendrocyte precursor cells (OPCs) and their stimulation with conditioned medium (CM) and extracellular vesicles (EVs) released by naive macrophages (M0, PBS‐treated), disease‐associated macrophages (DAMs, LPS‐stimulated), and repair‐associated macrophages (RAMs, IL‐4‐stimulated). Created with biorender.com. (b–k) Representative immunofluorescent images (b, g) and quantification (c–f, h–k) of OPC maturation exposed to vehicle (BMDM culture medium (b–f), PBS (g–k)), conditioned medium (b–f) or EVs (g–k) isolated from M0, DAMs and RAMs for 6 days. OPCs were stained for MBP (mature oligodendrocyte) and O4 (premature oligodendrocyte), and differentiation was quantified by measuring the MBP/O4 ratio (c, h) or applying the Sholl analysis (mean interactions/ring, sum intersections, and ending radius; d–f, i–k). OPCs were treated with conditioned medium produced by 1.5 × 105 BMDMs or 4 × 108 EVs/mL. Scale bar, 25 µm. Results are pooled from or representative of four biological replicates (n = 4–6 cultures). Data are represented as mean ± SEM and statistically analysed using the one‐way ANOVA test followed by Tukey's multiple comparison test. *, p < 0.05; **, p < 0.01; ***, p < 0.001.
FIGURE 2
FIGURE 2
Extracellular vesicles released by RAMs improve remyelination in cerebellar brain slices. (a) Schematic representation showing the isolation and culture of cerebellar brain slices as well as their stimulation with vehicle (PBS), or extracellular vesicles (EVs) released by naive macrophages (M0, PBS‐treated), disease‐associated macrophages (DAMs, LPS‐stimulated) and repair‐associated macrophages (RAMs, IL‐4‐stimulated). LPC = lysolecithin, demyelinating compound. Created with biorender.com. (b, d) Representative images and three‐dimensional reconstruction of immunofluorescent MBP/NF (b) and Olig2/CC1 (d) stains of cerebellar brain slices treated with vehicle or EVs isolated from M0, DAMs and RAMs. Slices were treated with 4 × 109 EVs/mL. Scale bars, 100 µm (b, (row 1, 2) d); 25 µm (b, row 3). (c) Relative number of MBP+ NF+ axons out of total NF+ axons in cerebellar brain slices treated with vehicle or EVs released by M0, DAMs and RAMs (n = 3–6 slices). (e) Percentage Olig2+ CC1+ cells within the Olig2+ cell population in cerebellar brain slices treated with vehicle or EVs released by M0, DAMs and RAMs (n = 3–6 slices). (f) Representative images and three‐dimensional reconstruction of immunofluorescent MBP/NF of cerebellar brain slices treated with empty liposomes or GW4869 liposomes. Scale bars, 100 µm (column 1, 2); 25 µm (column 3). (g) Relative number of MBP+ NF+ axons out of total NF+ axons in cerebellar brain slices treated with empty liposomes or GW4869 liposomes (n = 4–5 slices). Results are pooled from or representative of three independent experiments. Data are represented as mean ± SEM and statistically analysed using the Kruskal–Wallis test followed by Dunn's multiple comparison test (c, e) or the Mann‐Whitney test (g). *, p < 0.05; **, p < 0.01.
FIGURE 3
FIGURE 3
Extracellular vesicles released by RAMs enhance remyelination in the cuprizone model. (a) Schematic representation showing the experimental pipeline used to assess the impact of extracellular vesicles (EVs) released by naive macrophages (M0, PBS‐treated), disease‐associated macrophages (DAMs, LPS‐stimulated), and repair‐associated macrophages (RAMs, IL‐4‐stimulated) on remyelination in the cuprizone model. Created with biorender.com. (b) Representative images of immunofluorescent MBP and Olig2/CC1 stains and transmission electron microscopy analysis of the corpus callosum (CC) from mice treated intracerebroventricularly with vehicle (PBS) or EVs released by M0, DAMs and RAMs. The outer border of the CC is demarcated by the dotted line. Mice were injected with vehicle or EVs (1 × 109 EVs) after demyelination (5w), and analysis was performed during remyelination (5w+1). Scale bar, 200 µm (rows 1, 3) and 2 µm (row 2). (c) Quantification of the MBP+ area of the CC from cuprizone mice treated with vehicle or EVs during remyelination (5w+1) (n = 5–6 animals, 3 images/animal). (d, e) Analysis of the g‐ratio (the ratio of the inner axonal diameter to the total outer diameter, (d), and percentage myelinated axons (e) in CC from cuprizone mice treated with vehicle or EVs during remyelination (5w+1) (n = 3–5 animals, 3 images/animal, 100–150 axons/image). (f) Quantification of the percentage Olig2+ CC1+ cells out of total Olig2+ cells in the CC of cuprizone animals treated with vehicle or EVs during remyelination (5w+1) (n = 4–6 animals, 3 images/animal). Data are represented as mean ± SEM and statistically analysed using the Kruskal–Wallis test followed by Dunn's multiple comparison test. *, p < 0.05; **, p < 0.01; ***, p < 0.001.
FIGURE 4
FIGURE 4
Cholesterol abundance controls the impact of EVs released by macrophages on OPC maturation. (a–d) Quantification of OPC maturation following 6‐day exposure to lipids isolated from EVs released by naive macrophages (M0, PBS‐treated), disease‐associated macrophages (DAMs, LPS‐stimulated) and repair‐associated macrophages (RAMs, IL‐4‐stimulated). OPCs were stained for MBP (mature oligodendrocyte) and O4 (premature oligodendrocyte), and differentiation was quantified by measuring the MBP/O4 ratio (a) or applying the Sholl analysis (mean interactions/ring, sum intersection, and ending radius; b–d). OPCs were treated with 4 × 108 EVs/mL (n = 4–5 cultures). (e) Liquid chromatography electrospray tandem mass spectrometry (LC‐ESI‐MS/MS) analysis to measure lipid species of EVs released by DAMs and RAMs (n = 3 isolates). Data are depicted as log2 fold change (L2FC). SM, sphingomyelin; CE, cholesterol esters; TG, triglycerides; (D/H)CER, (dihydro/hexosyl)ceramide; (L)PC(‐O/‐P), (lyso,‐alkyl/‐alkenyl) phosphatidylcholine; (L)PE(‐O/‐P), (lyso, ‐alkyl/‐alkenyl) phosphatidylethanolamine; PG, phosphatidylglycerol and PI, phosphatidylinositol. (f) Relative abundance of fatty acyl moieties within CE group is shown (RAM EVs vs. DAM EVs). Data are depicted as L2FC (n = 3 isolates). (g, h) Quantification of total cholesterol, free cholesterol, and esterified cholesterol in EVs isolated from M0, DAMs, and RAMs (g, n = 3–4 isolates) and EVs isolated from peripheral blood mononuclear cells (PBMCs) of healthy controls (HC, n = 3 individuals) and relapsing‐remitting multiple sclerosis patients (RRMS) (h, n = 3 patients). With respect to the latter, age‐matched and gender‐matched comparisons are depicted. i, j) Schematic representation of the experimental pipeline used for cholesterol depletion (h) and enrichment (i) of EVs released by RAMs and DAMs, respectively. Created with biorender.com. (k–n) Quantification of OPC maturation following 6 days exposure to EVs isolated from M0, DAMs and RAMs, as well as EVs isolated from DAMs and RAMs that were enriched (Chol+) with or depleted (Chol) of cholesterol, respectively. OPCs were stained for MBP (mature oligodendrocyte) and O4 (premature oligodendrocyte), and differentiation was quantified by measuring the MBP/O4 ratio (j) or applying the Sholl analysis (mean interactions/ring, sum intersection and ending radius; k–m). OPCs were treated with 4 × 108 EVs/mL (n = 5–12 cultures). All results are pooled from three biological replicates. Data are represented as mean ± SEM and statistically analysed using the one‐way ANOVA test followed by Tukey's multiple comparison test (a–d, j–m), the Mann‐Whitney test (f), and the Kruskal–Wallis test followed by Dunn's multiple comparison test (g). #, p < 0.1, *, p < 0.05; **, p < 0.01; ***, p < 0.001.
FIGURE 5
FIGURE 5
Cholesterol abundance controls the impact of EVs released by macrophages on remyelination. (a–d) Representative images, three‐dimensional reconstruction, and quantification of immunofluorescent MBP/NF (a, b) and Olig2/CC1 stains (c, d) of cerebellar brain slices treated with vehicle or EVs released by disease‐associated macrophages (DAMs, LPS‐stimulated), and repair‐associated macrophages (RAMs, IL‐4‐stimulated), as well as EVs released by DAMs and RAMs that were enriched (Chol+) with or depleted (Chol) of cholesterol, respectively. Relative number of MBP+ NF+ axons out of total NF+ axons (b) and percentage Olig2+ CC1+ cells within the Olig2+ cell population (d) in cerebellar brain slices treated with vehicle or EVs is shown (n = 3–6 slices). Slices were treated with 4 × 109 EVs/mL. Scale bars, 100 µm (a (row 1 and 2), c); 25 µm (a (row 3)). (e) Representative images of transmission electron microscopy analysis and immunofluorescent Olig2/CC1 stains of the corpus callosum (CC) from mice treated with vehicle or EV subsets. The outer border of the CC is demarcated by the dotted line. Mice were intracerebroventricularly injected with vehicle or EVs (1 × 109 EVs/mL) after demyelination (5w), and analysis was done during remyelination (5w+1). Scale bar, 200 µm (rows 1, 3) and 2 µm (row 2). (f) Quantification of the MBP+ area of the CC from cuprizone mice treated with vehicle or EVs during remyelination (5w+1) (n = 4–6 animals, 3 images/animal). (g, h) Analysis of the g‐ratio (the ratio of the inner axonal diameter to the total outer diameter, (g), and percentage of myelinated axons (h) in CC from cuprizone mice treated with vehicle or EVs during remyelination (5w+1) (n = 5–6 animals, 3 images/animal, 100–150 axons/image). (i) Quantification of the percentage Olig2+ CC1+ cells out of total Olig2+ cells in the CC of cuprizone animals treated with vehicle or EVs during remyelination (5w+1) (n = 4–6 animals, 3 images/animal). Data are represented as mean ± SEM and statistically analysed using the Kruskal–Wallis test followed by Dunn's multiple comparison test. *, p < 0.05; **, p < 0.01; ***, p < 0.001.
FIGURE 6
FIGURE 6
Pharmacological inhibition of direct membrane fusion using Omeprazole counters the regenerative impact of EVs released by RAMs. (a) Schematic representation showing routes of extracellular vesicles (EV) uptake and their associated inhibitors. Created with biorender.com. (b) Internalization of DiI‐labelled EVs released by repair‐promoting macrophages (RAMs, IL‐4‐stimulated) by OPCs pre‐treated for 30 min with inhibitors of receptor‐mediated endocytosis (cytochalasin D, 10 µM), clathrin‐mediated endocytosis (chloropromazine, 50 µM), caveola‐mediated endocytosis (nystatin, 25 µM), macropinocytosis (imipramine, 5 µM), direct fusion (omeprazole, 50 µM), phagocytosis (wortmannin, 500 nM), lipid raft‐mediated uptake (methyl‐β‐cyclodextrin, 1% v/v) and dynamin‐mediated endocytosis (dynasore, 20 µM). OPCs were exposed for 3 h to 4 × 108 EVs/mL (n = 5–9 cultures). (c–f) Quantification of OPC maturation following 6 days exposure to EVs isolated from RAMs and cytochalasin D, chloropromazine, omeprazole or wortmaninn. OPCs were stained for MBP (mature oligodendrocyte) and O4 (premature oligodendrocyte), and differentiation was quantified by measuring the MBP/O4 ratio (c; n = 4 cultures) or applying the Sholl analysis (mean interactions/ring, sum intersection and ending radius; D–F; n = 5 cultures). Quantification was represented as fold change of OPCs treated with RAM‐derived EVs, compared to vehicle‐treated OPCs. Dotted line represents vehicle‐treated OPCs. OPCs were treated with 4 × 108 EVs/mL. All results are pooled from three biological replicates. Data are represented as mean ± SEM and statistically analysed using the Kruskal–Wallis test followed by Dunn's multiple comparison test (b), and the one‐way ANOVA test followed by Tukey's multiple comparison test (c–f). *, p < 0.05; **, p < 0.01; ***, p < 0.001.

References

    1. Ahsan, F. , Rivas, I. P. , Khan, M. A. , & Torres Suarez, A. I. (2002). Targeting to macrophages: Role of physicochemical properties of particulate carriers–liposomes and microspheres–on the phagocytosis by macrophages. Journal of Controlled Release, 79, 29–40. - PubMed
    1. Ajami, B. , Bennett, J. L. , Krieger, C. , McNagny, K. M. , & Rossi, F. M. (2011). Infiltrating monocytes trigger EAE progression, but do not contribute to the resident microglia pool. Nature Neuroscience, 14, 1142–1149. - PubMed
    1. Aydınlı, F. , Er, S. , & Kerman, B. E. (2022). Two phases of macrophages: Inducing maturation and death of oligodendrocytes in vitro co‐culture. Journal of Neuroscience Methods, 382, 109723. - PubMed
    1. Berghoff, S. A. , Gerndt, N. , Winchenbach, J. , Stumpf, S. K. , Hosang, L. , Odoardi, F. , Ruhwedel, T. , Bohler, C. , Barrette, B. , Stassart, R. , Liebetanz, D. , Dibaj, P. , Möbius, W. , Edgar, J. M. , & Saher, G. (2017). Dietary cholesterol promotes repair of demyelinated lesions in the adult brain. Nature Communications, 8, 14241. - PMC - PubMed
    1. Berghoff, S. A. , Spieth, L. , & Saher, G. (2022). Local cholesterol metabolism orchestrates remyelination. Trends in Neuroscience (Tins), 45, 272–283. - PubMed

Publication types

LinkOut - more resources