. 2024 May 17;109(6):1540-1549.
doi: 10.1210/clinem/dgad749.

A Population-Based and Clinical Cohort Validation of the Novel Consensus Definition of Metabolic Hyperferritinemia

Affiliations

A Population-Based and Clinical Cohort Validation of the Novel Consensus Definition of Metabolic Hyperferritinemia

Wen-Yue Liu et al. J Clin Endocrinol Metab. .

Abstract

Context: There is limited data on the clinical significance of metabolic hyperferritinemia (MHF) based on the most recent consensus.

Objective: We aimed to validate the clinical outcomes of MHF in the general population and patients with biopsy-proven metabolic dysfunction-associated fatty liver disease (MAFLD).

Methods: The NHANES database and PERSONS cohort were included. MHF was defined as elevated serum ferritin with metabolic dysfunction (MD) and stratified into different grades according to ferritin (grade 1: 200 [females]/300 [males]-550 ng/mL; grade 2: 550-1000 ng/mL; grade 3: >1000 ng/mL). The clinical outcomes, including all-cause death, comorbidities, and liver histology, were compared between non-MHF and MHF in adjusted models.

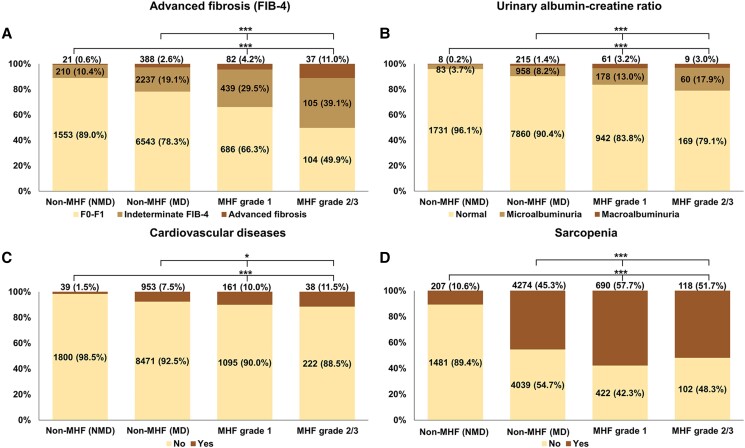
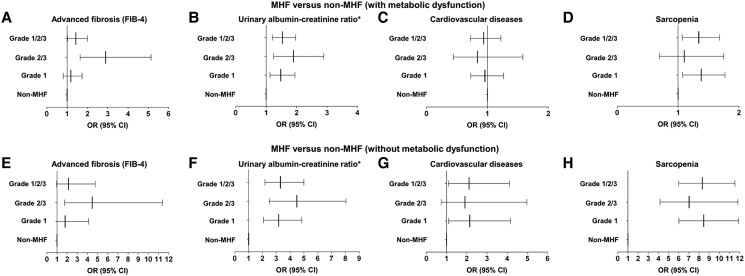
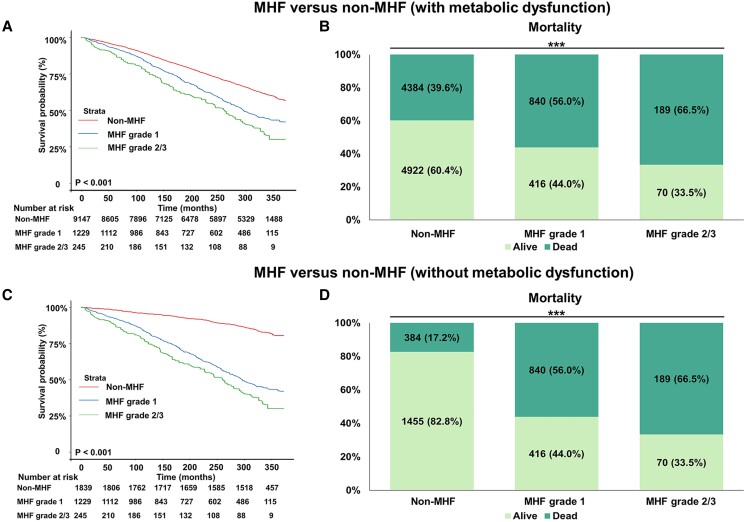
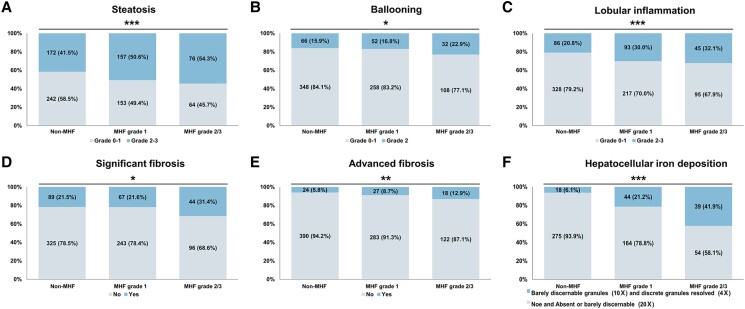
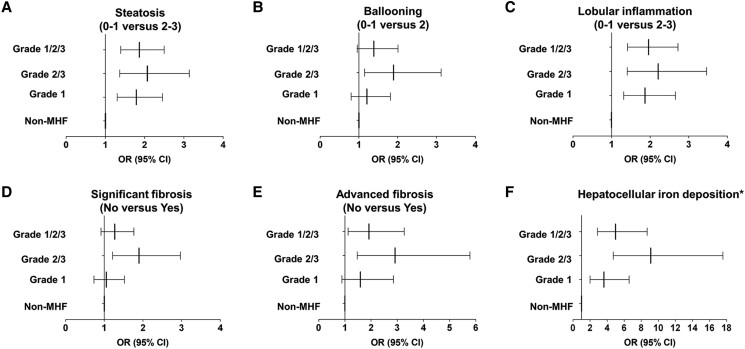
Results: In NHANES, compared with non-MHF with MD, MHF was related to higher risks of advanced fibrosis (P = .036), elevated albumin-creatinine ratio (UACR, P = .001), and sarcopenia (P = .013). Although the association between all grades of MHF and mortality was insignificant (P = .122), grades 2/3 was associated with increased mortality (P = .029). When comparing with non-MHF without MD, the harmful effects of MHF were more significant in mortality (P < .001), elevated UACR (P < .001), cardiovascular disease (P = .028), and sarcopenia (P < .001). In the PERSONS cohort, MHF was associated with more advanced grades of steatosis (P < .001), lobular inflammation (P < .001), advanced fibrosis (P = .017), and more severe hepatocellular iron deposition (P < .001).

Conclusion: Both in the general population and in at-risk individuals with MAFLD, MHF was related with poorer clinical outcomes.

Keywords: iron overload; metabolic dysfunction–associated fatty liver disease; metabolic hyperferritinemia; metabolic syndrome.


Figures

Figure 1.
Figure 1.
The clinical comorbidities according to the presence and severity of MHF in the NHANES III (from 1988 to 1994). The proportions of (A) advanced fibrosis, (B) urinary albumin–creatinine ratio, (C) cardiovascular disease, and (D) sarcopenia in MHF and non-MHF (with or without metabolic dysfunction). The data in the percentage column chart was real numbers (weighted proportion, %). *P < .05; **P < .005; ***P < .001. Abbreviations: MHF, metabolic hyperferritinaemia; MD, metabolic dysfunction; NMD, non-metabolic dysfunction; FIB-4, fibrosis-4.
Figure 2.
Figure 2.
The association between clinical comorbidities and MHF in the NHANES III (from 1988 to 1994). The association between (A, E) advanced fibrosis, (B, F) urinary albumin–creatinine ratio, (C, G) cardiovascular disease, (D, H) sarcopenia and MHF compared with non-MHF (with or without metabolic dysfunction) in adjusted logistic regression models. The weighted logistic regression models adjusting for ethnicity (non-Hispanic white as a reference), age (continuous), and sex (female as a reference) were used to estimate the odds ratio (OR) and 95% CI. (A) Advanced liver fibrosis (OR grade 1 1.184, 95% CI 0.807-1.737, P = .378; OR grade 2/3 2.897, 95% CI 1.635-5.133, P = .001; OR grade 1/2/3 = 1.431, 95% CI 1.025-1.998, P = .036), (B) urinary albumin–creatinine ratio (OR grade 1 1.480, 95% CI 1.124-1.949, P = .006; OR grade 2/3, 1.898 95% CI 1.244-2.894, P = .004; OR grade 1/2/3 1.536, 95% CI 1.200-1.967, P = .001), (C) cardiovascular disease (OR grade 1 0.959, 95% CI 0.728-1.264, P = .761; OR grade 2/3 0.835, 95% CI 0.441-1.582, P = .573; OR grade 1/2/3 0.938, 95% CI 0.720-1.222, P = .629), (D) sarcopenia (OR grade 1 = 1.379, 95% CI 1.074-1.771, P = .013; OR grade 2/3 1.101, 95% CI 0.693-1.750, P = .677; OR grade 1/2/3 = 1.340, 95% CI 1.067-1.681, P = .013), (E) advanced liver fibrosis (OR grade 1 = 1.799, 95% CI 0.785-4.127, P = .161; OR grade 2/3 = 4.467, 95% CI 1.752-11.390, P = .002; OR grade 1/2/3 2.130, 95% CI 0.952-4.766, P = .065), (F) urinary albumin–creatinine ratio (OR grade 1 3.175, 95% CI 2.080-4.847, P < .001; OR grade 2/3 = 4.484, 95% CI 2.496-8.053, P < .001; OR grade 1/2/3 3.298, 95% CI 2.177-4.997, P < .001), (G) cardiovascular disease (OR grade 1 2.147, 95% CI 1.105-4.172, P = .025; OR grade 2/3 1.909, 95% CI 0.733-4.976, P = .180; OR grade 1/2/3 2.115, 1.087-4.114, P = .028), (H) sarcopenia (OR grade 1 8.465, 95% CI 6.022-11.900, P < .001; OR grade 2/3 = 7.020, 95% CI 4.166-11.830, P < .001; OR grade 1/2/3 8.323, 95% CI 5.999-11.550, P < .001). *We used urinary albumin–creatinine ratio normal to mildly increased (<30 mg/g) as reference, and calculated the influence of MHF grades in elevated urinary albumin–creatinine ratio (≥30 mg/g). Abbreviations: MHF, metabolic hyperferritinaemia; FIB-4, fibrosis-4.
Figure 3.
Figure 3.
The weighted survival analysis of MHF and non-MHF (with or without metabolic dysfunction) in the NHANES III (from 1988 to 1994). The Kaplan–Meier curves of MHF and non-MHF (A, C) and the proportion of mortality in MHF and non-MHF (B, D). The data in the percentage column chart are real numbers (weighted percentage, %). *P < .05; **P < .005; ***P < .001. Abbreviations: MHF, metabolic hyperferritinaemia.
Figure 4.
Figure 4.
The proportion of liver histological features in patients with MAFLD with or without MHF in the PERSONS cohort. The proportion of (A) steatosis, (B) ballooning, (C) lobular inflammation, (D) significant fibrosis, (E) advanced fibrosis, and (F) hepatocellular iron deposition in MHF and non-MHF. The data in the percentage column chart are the numbers (percentage, %). The P values are P for trend: *P trend < .05; **P trend < .005; ***P trend < .001. Abbreviations: MHF, metabolic hyperferritinaemia; MAFLD, metabolic dysfunction-associated fatty liver disease.
Figure 5.
Figure 5.
The association of liver histological features and MHF in patients with MAFLD in the PERSONS cohort. The association between (A) steatosis, (B) ballooning, (C) lobular inflammation, (D) significant fibrosis, (E) advanced fibrosis, (F) hepatocellular iron deposition, and MHF compared with non-MHF. The logistic regression models adjusting for age (continuous) and sex (female as a reference) were used to estimate the odds ratio (OR) and 95% CI. (A) steatosis (OR grade 1 1.787, 95% CI 1.301-2.454, P < .001; OR grade 2/3 2.068, 95% CI 1.363-3.138, P = .001; OR grade 1/2/3 1.865, 95% CI 1.392-2.499, P < .001), (B) ballooning (OR grade 1 1.205, 95% CI 0.800-1.814, P = .372; OR grade 2/3 1.891, 95% CI 1.146-3.120, P = .013; OR grade 1/2/3 1.385, 95% CI 0.956-2.006, P = .085), (C) lobular inflammation (OR grade 1 1.868, 95% CI 1.314-2.656, P = .001; OR grade 2/3 = 2.208 1.407-3.463, P = .001; OR grade 1/2/3 1.960, 95% CI 1.413-2.719, P < .001), (D) significant fibrosis (OR grade 1 1.056, 95% CI 0.733-1.522, P = .768; OR grade 2/3 1.900, CI 1.216-2.970, P = .005; OR grade 1/2/3 1.270, 95% CI 0.914-1.764, P = .154), (E) advanced fibrosis (OR grade 1 1.592, 95% CI 0.888-2.855, P = .118; OR grade 2/3 2.914, 95% CI 1.471-5.774, P = .002; OR grade 1/2/3 1.917, 95% CI 1.126-3.264], P = .017), (F) hepatocellular iron deposition (OR grade 1 3.626 , 95% CI 1.999-6.579, P < .001; OR grade 2/3 9.109, 95% CI 4.723-17.568, P < .001; OR grade 1/2/3 4.985, 95% CI 2.862-8.682, P < .001). *None and absent or barely discernable (20×) vs barely discernable granules (10×) and discrete granules resolved (4×). Abbreviations: MAFLD, metabolic dysfunction-associated fatty liver disease; MHF, metabolic hyperferritinaemia.

References

    1. Knovich MA, Storey JA, Coffman LG, et al. Ferritin for the clinician. Blood Rev. 2009;23(3):95‐104. - PMC - PubMed
    1. Joshi JG, Clauberg M. Ferritin: an iron storage protein with diverse functions. Biofactors. 1988;1(3):207‐212. - PubMed
    1. Yu L, Yan J, Zhang Q, et al. Association between serum ferritin and blood lipids: influence of diabetes and hs-CRP levels. J Diabetes Res. 2020;2020:4138696. - PMC - PubMed
    1. Aust SD. Ferritin as a source of iron and protection from iron-induced toxicities. Toxicol Lett. 1995;82–83:941‐944. - PubMed
    1. Cullis JO, Fitzsimons EJ, Griffiths WJ, et al. Investigation and management of a raised serum ferritin. Br J Haematol. 2018;181(3):331‐340. - PubMed

Publication types