. 2023 Nov 24:14:1290688.
doi: 10.3389/fimmu.2023.1290688. eCollection 2023.

A SARS-CoV-2 NSP7 homolog of a Treg epitope suppresses CD4+ and CD8+ T cell memory responses

Affiliations

A SARS-CoV-2 NSP7 homolog of a Treg epitope suppresses CD4+ and CD8+ T cell memory responses

S M Shahjahan Miah et al. Front Immunol. .

Abstract

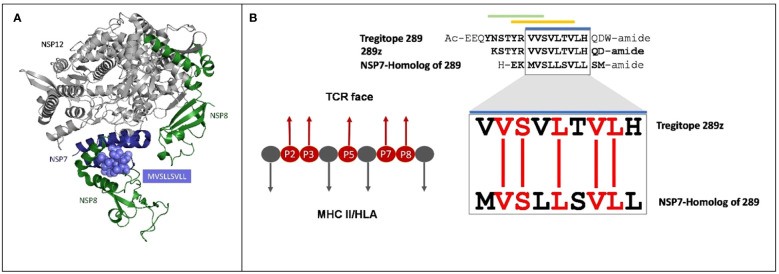
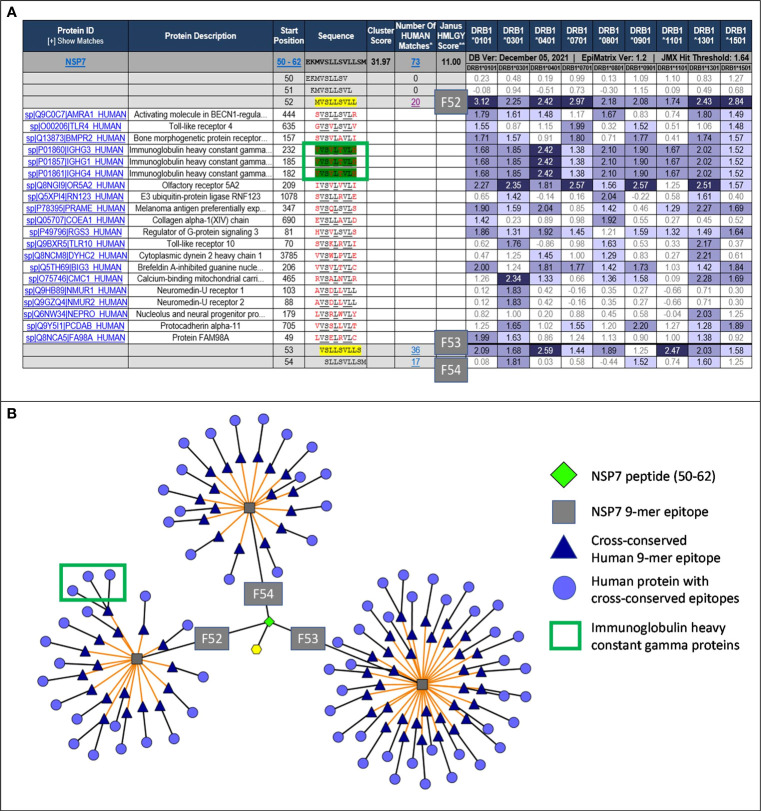
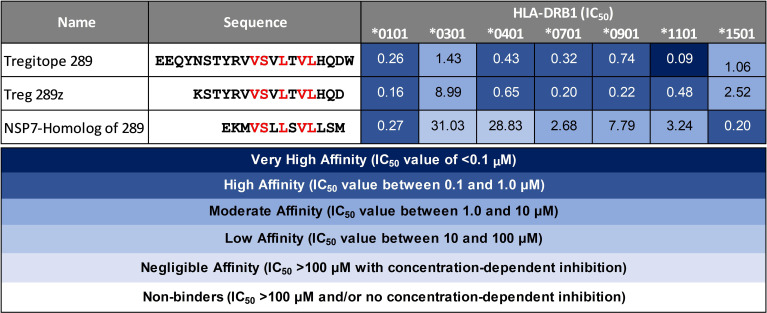
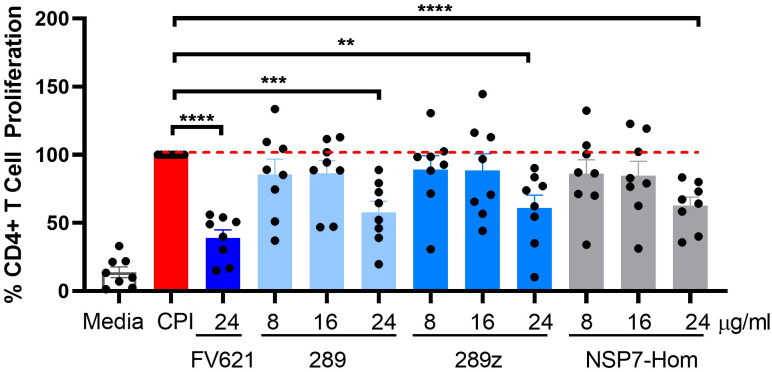
Pathogens escape host defenses by T-cell epitope mutation or deletion (immune escape) and by simulating the appearance of human T cell epitopes (immune camouflage). We identified a highly conserved, human-like T cell epitope in non-structural protein 7 (NSP7) of SARS-CoV-2, RNA-dependent RNA polymerase (RdRp) hetero-tetramer complex. Remarkably, this T cell epitope has significant homology to a T regulatory cell epitope (Tregitope) previously identified in the Fc region of human immunoglobulin G (IgG) (Tregitope 289). We hypothesized that the SARS-CoV-2 NSP7 epitope (NSP7-289) may induce suppressive responses by engaging and activating pre-existing regulatory T cells. We therefore compared NSP7-289 and IgG Tregitopes (289 and 289z, a shorter version of 289 that isolates the shared NSP7 epitope) in vitro. Tregitope peptides 289, 289z and NSP7-289 bound to multiple HLA-DRB1 alleles in vitro and suppressed CD4+ and CD8+ T cell memory responses. Identification and in vitro validation of SARS-CoV-2 NSP7-289 provides further evidence of immune camouflage and suggests that pathogens can use human-like epitopes to evade immune response and potentially enhance host tolerance. Further exploration of the role of cross-conserved Tregs in human immune responses to pathogens such as SARS-CoV-2 is warranted.

Keywords: SARS-CoV-2; Tregitope; immune camouflage; immunogenicity; nsp7; tolerance.


Conflict of interest statement

ADG is the senior officer and shareholder of, and SM, SL, MM, CB and AHG are employees of EpiVax, Inc., a privately-owned biotechnology company located in Providence, RI. LM is a former employee of EpiVax, Inc. All of these authors acknowledge that there is a potential conflict of interest related to their employment status and/or ownership relationship with EpiVax and attest that the work contained in this research report is free of any bias that might be associated with the commercial goals of the company. This study received funding from EpiVax. The funder had the following involvement with the study: All in vitro and bioinformatics studies were performed after group discussion and decision making by the authors, and funded by the internal research funds of the EpiVax company.

Figures

Figure 1
Figure 1
Cross-conservation of the NSP7 predicted T cell epitope with Tregitope 289. (A) NSP7 shown in the context of the RNA-dependent RNA polymerase structure where it forms a complex with two NSP8s and one NSP12 (pdb id 7BV1) (24). NSP7 peptide residues are represented as purple spheres (MVSLLSVLL) within the NSP7 ribbon structure. Graphic was adapted from structure of the nsp12-nsp7-nsp8 complex obtained from the PDB (https://www.rcsb.org/ on Sept 5th, 2023). (B) Alignment of the human Tregitope peptide sequences Tregitope 289 and 289z to the NSP7-homolog sequence. The TCR-facing residues in the HLA binding pocket (P2, P3, P5, P7 and P8) of Tregitope 289z are shown in red and are 100% conserved with NSP7.
Figure 2
Figure 2
JanusMatrix analysis and TCR-Epitope Network for NSP7. (A) JanusMatrix analysis showing the cross conservation of SARS-CoV-2-NSP7 peptide with human proteins for Frame 52 (F52). The green box highlights the epitope in NSP7 containing TCR residues (underlined) cross-conserved with the Tregitope 289 sequence within the IgG1 constant region. See Supplement Figure S1 for a fully expanded JanusMatrix analysis for all three NSP7 9-mer epitopes (F52, F53 and F54). (B) Cytoscape of JanusMatrix analysis showing the TCR-Epitope network of SARS-CoV-2-NSP7 peptide and its TCR cross-conservation with other human proteins. F52, F53, and F54 denote the 9-mer frames in the NSP7 sequence that contain epitopes that are highly cross-conserved with human epitopes, as illustrated in this figure.
Figure 3
Figure 3
HLA-DRB1 binding of SARS-CoV-2-NSP7 peptide alongside IgG Tregitopes 289 and 289z for comparison. Selected SARS-CoV-2-NSP7 peptide was evaluated for HLA-DRB1 binding in vitro and the calculated IC50 values are shown. The SARS-CoV-2-NSP7 peptide exhibited binding across multiple alleles tested (DRB1*01:01, *03:01, *04:01, *07:01, *09:01, *11:01, and *15:01). A seven-point competition assay using a validated control peptide was performed; color coding reflects binding affinity. IC50 was determined by interpolation. IgG Tregitope 289 and 289z also bind to all of the tested alleles.
Figure 4
Figure 4
Comparison of the inhibition of CD4+ recall response by SARS-CoV-2-NSP7-homolog of 289 peptide with IgG-derived Tregitopes 289 and 289z in the TTBSA. PBMCs from healthy donors were stimulated with 0.5 µg/ml of TT alone or with FV621 or increasing concentrations of 289, 289z or SARS-CoV-2-NSP7 peptide (8, 16 and 24 μg/ml). Proliferation of CD4+ T cells was measured six days post-stimulation by flow cytometry using a CFSE dilution parameter. (A) Left panel shows the gating of CD4+ T cells. See Supplement Figure S2 for the detailed gating strategy. The right panel shows representative flow plots for one donor indicating the dose effect on the proliferation of CD4+ T cells with increasing concentrations of SARS-CoV-2-NSP7 peptide. (B, C) Graphs show the percent of CD4+ T cell proliferation (B) and the percent of CD4+ T cell activation (CD25hi cells) (C) for each peptide tested in the assay, compared to TT stimulation alone. FV621 was used as a positive control for suppressed proliferation (12). Data in the graphs are normalized to TT stimulation at 100% proliferation or activation (0% suppression), and the percent suppression by each concentration of each test peptide can be determined by comparison. Data shown are the cumulative results of 10 donors. P values * = <0.05, ** = <0.01, *** = <0.0002 and **** = <0.0001 represent statistical significance between Tregitope stimulation vs. TT using a two-tailed t test.
Figure 5
Figure 5
Inhibition of antigen-specific CD4+ recall response by SARS-CoV-2-NSP7-homolog of 289 peptide. PBMCs from convalescent donors were stimulated with 5.0 µg/ml of CPI alone or with increasing concentrations of 289, 289z or SARS-CoV-2-NSP7 peptide (8, 16 and 24μg/ml) for 7 days. FV621 was used at 24μg/ml for positive control of the experiment. Proliferation of CD4+ T cells was measured at day 7 by flow cytometry using a CFSE dilution parameter. Data in the graph are normalized to CPI stimulation at 100% proliferation and combined from two experiments. Data shown are the cumulative results of 8 donors. P values ** = <0.01, *** = <0.0002 and **** = <0.0001 represents statistical significance between Tregitope stimulation vs. CPI using a two-tailed t test.
Figure 6
Figure 6
Effect of SARS-CoV-2-NSP7 peptide on CD8+ T cell response in PBMCs from healthy donors stimulated with CEF peptides. PBMCs from healthy donors were stimulated with 0.5 µg/ml of CEF alone or in combination with FV621 or increasing concentrations of 289, 289z or SARS-CoV-2 NSP7 peptide (10, 20 and 40μg/ml). Proliferation of CD8+ T cells were measured six days post-stimulation by flow cytometry based on CFSE dilution. (A) Left panel shows the gating of CD8+ T cells. In the right panel, representative flow plots display the dose effect on the proliferation of CD8+ T cells resulting from increasing concentrations of SARS-CoV-2-NSP7-homolog peptide. (B, C) Graphs show the (%) proliferation of CD8+ T cells for each peptide tested in the assay, compared against CEF stimulation alone so that percent inhibition can be calculated or inferred. FV621 was used as a positive control as it has demonstrated consistent suppression of CEF response across donors in our previous publication (12). Original data is presented in panel B, and data normalized for CEF stimulation as 100% proliferation in panel C. The percent inhibition of CD8+ T cell proliferation for each peptide at each concentration tested in the assay compared to CEF stimulation alone. Data are combined from five donors in the experiment. P values * = <0.05, ** = <0.01 and *** = <0.0002 represent statistical significance vs. CEF stimulation alone using a two-tailed t test.

Similar articles

Cited by

References

    1. Worldometer.info . Worldometer COVID-19 data (2023). Available at: https://www.worldometers.info/coronavirus/.
    1. Rydyznski Moderbacher C, Ramirez SI, Dan JM, Grifoni A, Hastie KM, Weiskopf D, et al. . Antigen-specific adaptive immunity to SARS-coV-2 in acute COVID-19 and associations with age and disease severity. Cell (2020) 183:996–1012.e19. doi: 10.1016/j.cell.2020.09.038 - DOI - PMC - PubMed
    1. Zhao J, Zhao J, Mangalam AK, Channappanavar R, Fett C, Meyerholz DK, et al. . Airway memory CD4 + T cells mediate protective immunity against emerging respiratory coronaviruses. Immunity (2016) 44:1379–91. doi: 10.1016/j.immuni.2016.05.006 - DOI - PMC - PubMed
    1. De Groot AS, De Groot P, He Y. ICoVax 2013: the 3rd ISV pre-conference computational vaccinology workshop. BMC Bioinf (2014) 15:I1. doi: 10.1186/1471-2105-15-S4-I1 - DOI - PMC - PubMed
    1. He L, De Groot AS, Gutierrez AH, Martin WD, Moise L, Bailey-Kellogg C. Integrated assessment of predicted MHC binding and cross-conservation with self reveals patterns of viral camouflage. BMC Bioinf (2014) 15 Suppl 4:S1. doi: 10.1186/1471-2105-15-S4-S1 - DOI - PMC - PubMed

Publication types