

Assessing the differences of two vineyards soils' by NIR spectroscopy and chemometrics
- PMID: 38125488
- PMCID: PMC10731239
- DOI: 10.1016/j.heliyon.2023.e23000
Assessing the differences of two vineyards soils' by NIR spectroscopy and chemometrics
Abstract
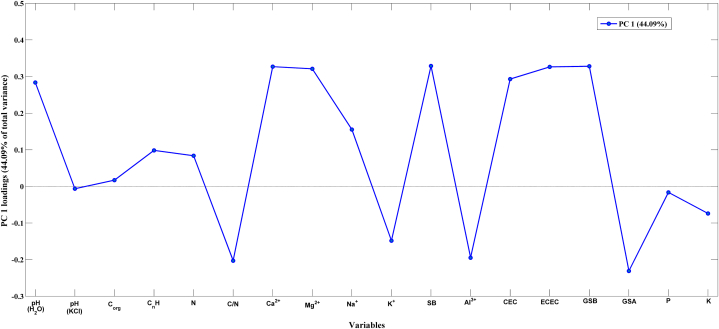
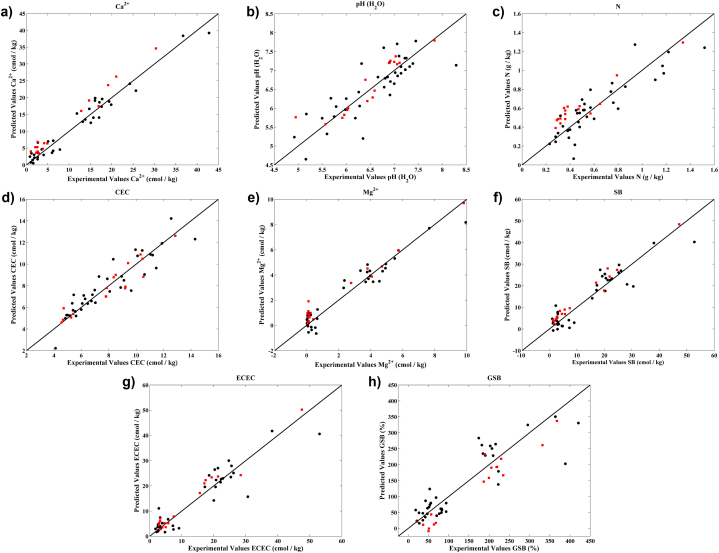
Soil properties influence greatly the status of vine plants which consequently influences the quality of wine. Therefore, in the context of viticulture management, it is extremely important to assess the physical and chemical parameters of vineyards soils. In this study, the soils of two vineyards were analysed by near-infrared (NIR) spectroscopy and established analytical reference procedures. The main objective of this study was to verify if NIR spectroscopy is a potential tool to discriminate the soils of both vineyards as well as to quantify differences of soil's parameters. For that, a total of eight sampling spots were selected at each vineyard taking into consideration the soil type and sampled at different depths. The data analysis was performed using analysis of variance (ANOVA), principal component analysis (PCA) and partial least squares discriminant analysis (PLS-DA) and partial least squares (PLS) regression. The ANOVA results revealed that 12 out of the 18 parameters analysed through the reference procedures can be considered statistically different (p < 0.05). Regarding PCA, the obtained results revealed a clear separation between the scores of both vineyards either considering NIR spectra or the chemical parameters. The PLS-DA model was able to obtain 100 % of correct predictions for the discrimination of both vineyards. PLS regression analysis using NIR spectra revealed R2P and RER values higher than 0.85 and 10, respectively, for 8 (pH (H2O), N, Ca2+, Mg2+, SB, CEC, ECEC and GSB) of the 18 chemical parameters evaluated. Concluding, these results demonstrate that it is possible to discriminate the soils of the different vineyards through NIR spectroscopy as well as to quantify several chemical parameters through soils NIR spectra in a rapid, accurate, cost-effective, simple and environmentally friendly way when compared to the reference procedures.
Keywords: Chemometrics; NIR spectroscopy; PCA; PLS; PLS-DA; Soils.
© 2023 Published by Elsevier Ltd.
Conflict of interest statement
The authors declare that they have no known competing financial interests or personal relationships that could have appeared to influence the work reported in this paper.
Figures


Similar articles
-
A comparative study on classification of edible vegetable oils by infrared, near infrared and fluorescence spectroscopy combined with chemometrics.Spectrochim Acta A Mol Biomol Spectrosc. 2023 Mar 5;288:122120. doi: 10.1016/j.saa.2022.122120. Epub 2022 Nov 17. Spectrochim Acta A Mol Biomol Spectrosc. 2023. PMID: 36473296
-
PLS-DA and Vis-NIR spectroscopy based discrimination of abdominal tissues of female rabbits.Spectrochim Acta A Mol Biomol Spectrosc. 2022 Apr 15;271:120887. doi: 10.1016/j.saa.2022.120887. Epub 2022 Jan 11. Spectrochim Acta A Mol Biomol Spectrosc. 2022. PMID: 35063825
-
Lipid Profile Quantification and Species Discrimination of Pine Seeds through NIR Spectroscopy: A Feasibility Study.Foods. 2022 Dec 6;11(23):3939. doi: 10.3390/foods11233939. Foods. 2022. PMID: 36496747 Free PMC article.
-
A comparative study of MIR and NIR spectral models using ball-milled and sieved soil for the prediction of a range soil physical and chemical parameters.Spectrochim Acta A Mol Biomol Spectrosc. 2022 Oct 15;279:121441. doi: 10.1016/j.saa.2022.121441. Epub 2022 May 30. Spectrochim Acta A Mol Biomol Spectrosc. 2022. PMID: 35667135
-
Testing of the region of Murcia soils by near infrared diffuse reflectance spectroscopy and chemometrics.Talanta. 2009 Apr 30;78(2):388-98. doi: 10.1016/j.talanta.2008.11.041. Epub 2008 Dec 3. Talanta. 2009. PMID: 19203599
Cited by
-
Integrating digital twins with neural networks for adaptive control of automotive suspension systems.Sci Rep. 2025 Apr 1;15(1):11078. doi: 10.1038/s41598-025-91243-1. Sci Rep. 2025. PMID: 40169713 Free PMC article.
References
-
- Tesic D., et al. Environmental effects on cv Cabernet Sauvignon (Vitis vinifera L.) grown in Hawke's Bay, New Zealand.: 1. Phenology and characterisation of viticultural environments. Aust. J. Grape Wine Res. 2008;8:15–26.
-
- Costantini E.A.C., et al. Soil and climate functional characters for grape ripening and wine quality of "Vino Nobile di Montepulciano". First Ishs Workshop on Strategies to Optimize Wine Grape Quality. 1996;(427):45–55.
-
- Rossel R.A.V., Chen C. Digitally mapping the information content of visible-near infrared spectra of surficial Australian soils. Rem. Sens. Environ. 2011;115(6):1443–1455.
-
- Catarino S., et al. Rare earths data for geographical origin assignment of wine: a Portuguese case study. Bull. OIV. 2011;84:333–346.
-
- Greenough J., Longerich H.P., Jackson S. Element fingerprinting of okanagan valley wines using ICPMS: relationships between wine composition, vineyard, and wine color. Aust. J. Grape Wine Res. 2008;3:75–83.
LinkOut - more resources
Full Text Sources
Miscellaneous
