. 2023 Nov 4:15:100346.
doi: 10.1016/j.jpi.2023.100346. eCollection 2024 Dec.

Comparative evaluation of slide scanners, scan settings, and cytopreparations for digital urine cytology

Affiliations

Comparative evaluation of slide scanners, scan settings, and cytopreparations for digital urine cytology

Jen-Fan Hang et al. J Pathol Inform. .

Abstract

Background: Acquiring well-focused digital images of cytology slides with scanners can be challenging due to the 3-dimensional nature of the slides. This study evaluates performances of whole-slide images (WSIs) obtained from 2 different cytopreparations by 2 distinct scanners with 3 focus modes.

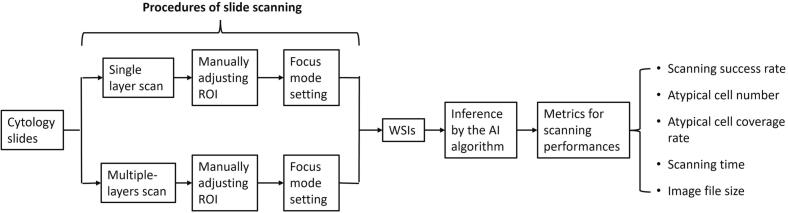
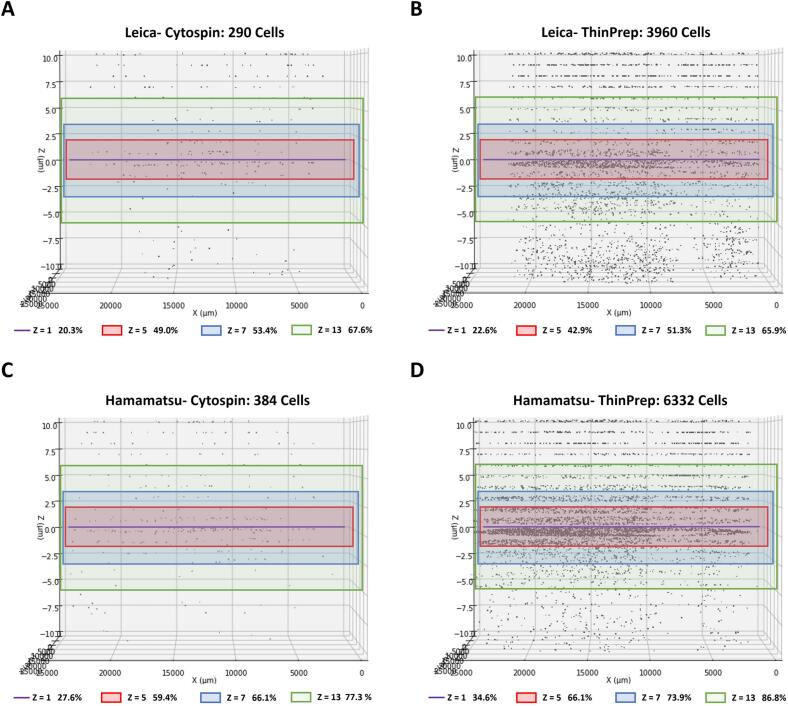
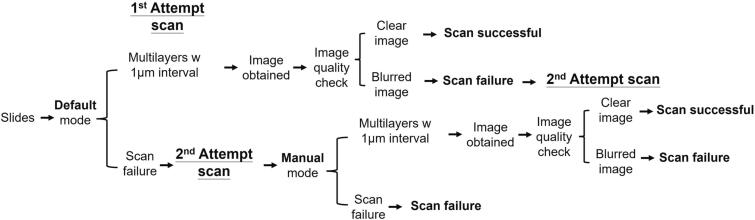
Methods: Fourteen urine specimens were collected from patients with urothelial carcinoma. Each specimen was equally divided into 2 portions, prepared with Cytospin and ThinPrep methods and scanned for WSIs using Leica (Aperio AT2) and Hamamatsu (NanoZoomer S360) scanners, respectively. The scan settings included 3 focus modes (default, semi-auto, and manual) for single-layer scanning, along with a manual focus mode for 21 Z-layers scanning. Performance metrics were evaluated including scanning success rate, artificial intelligence (AI) algorithm-inferred atypical cell numbers and coverage rate (atypical cell numbers in single or multiple Z-layers divided by the total atypical cell numbers in 21 Z-layers), scanning time, and image file size.

Results: The default mode had scanning success rates of 85.7% or 92.9%, depending on the scanner used. The semi-auto mode increased success to 92.9% or 100%, and manual even further to 100%. However, these changes did not affect the standardized median atypical cell numbers and coverage rates. The selection of scanners, cytopreparations, and Z-stacking influenced standardized median atypical cell numbers and coverage rates, scanning times, and image file sizes.

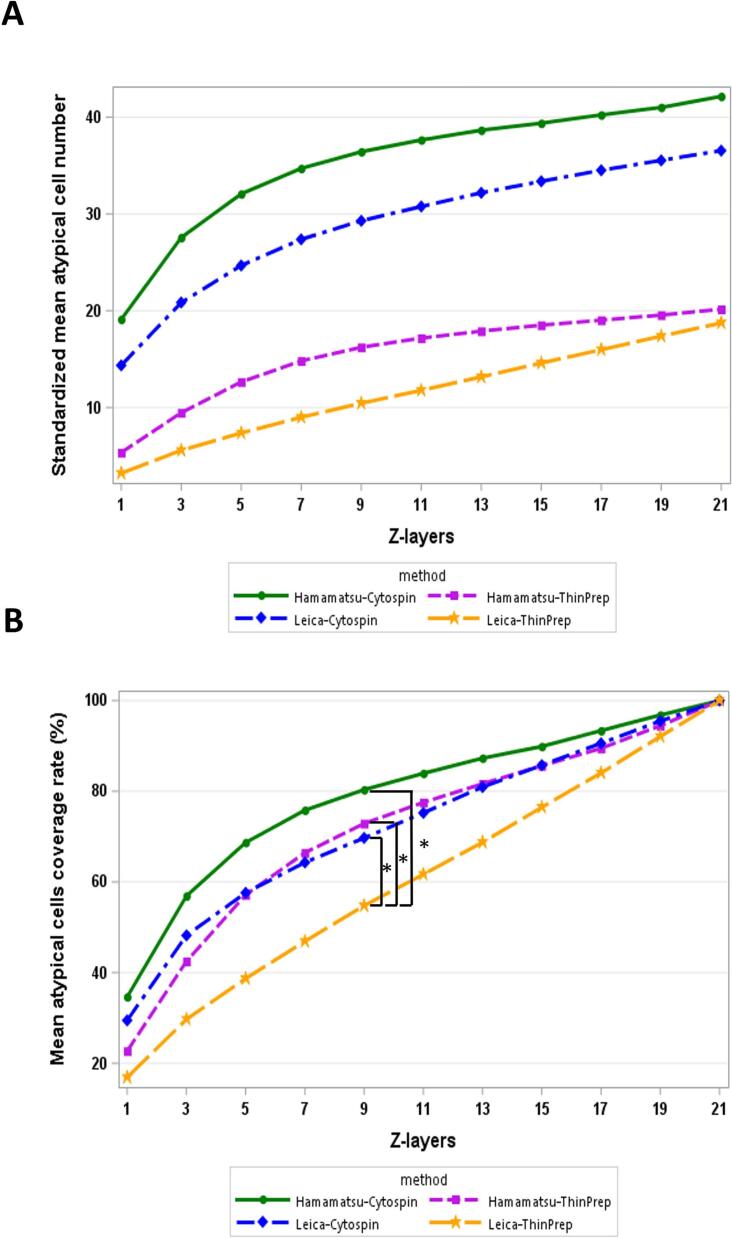
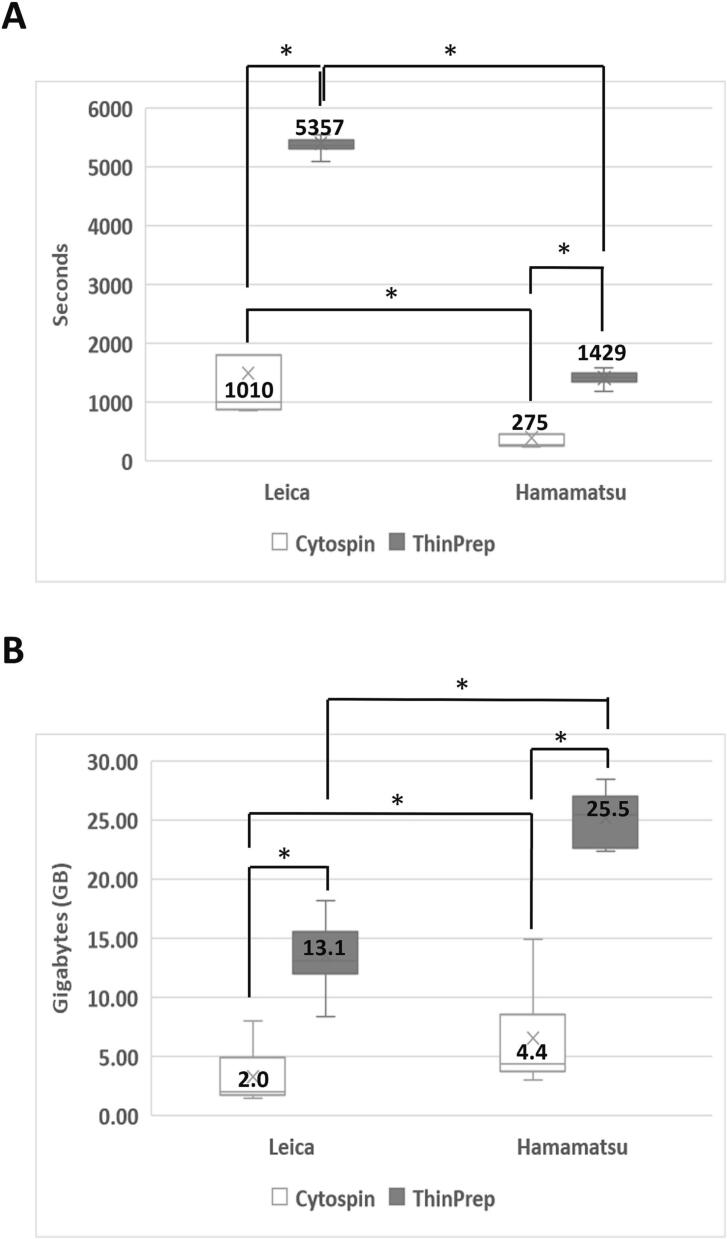
Discussion: Both scanners showed satisfactory scanning. We recommend using semi-auto or manual focus modes to achieve a scanning success rate of up to 100%. Additionally, a minimum of 9-layer Z-stacking at 1 μm intervals is required to cover 80% of atypical cells. These advanced focus methods do not impact the number of atypical cells or their coverage rate. While Z-stacking enhances the AI algorithm's inferred quantity and coverage rates of atypical cells, it simultaneously results in longer scanning times and larger image file sizes.

Keywords: Artificial intelligence; Digital cytopathology; Urine cytology; Whole-slide image; Z-stacking.


Conflict of interest statement

The authors declare the following financial interests/personal relationships which may be considered as potential competing interests: Tien-Jen Liu reports financial support was provided by AIxMed, Inc. Tien-Jen Liu reports a relationship with AIxMed, Inc. that includes: employment. Wei-Lei Yang, Cheng-Hung Yeh, Chi-Bin Li, En-Yu Hsu and Po-Yen Hung reports financial support was provided by AIxMed, Inc. Wei-Lei Yang, Cheng-Hung Yeh, Chi-Bin Li, En-Yu Hsu and Po-Yen Hung reports a relationship with AIxMed, Inc. that includes: employment.

Figures

Fig. 1
Fig. 1
Flowchart of the study examining various focus modes and Z-stack scan settings using cytology slides. The slides were scanned with Leica and Hamamatsu digital scanners to produce WSI using different settings: (1) selecting between the single or 21 Z-layer scan mode; (2) manually adjusting the region of interest (ROI); (3) selecting a focus mode (default, semi-auto, or manual) and scanning the slide to generate WSI; (4) applying the artificial intelligence (AI) algorithm to determine the number and location of atypical cells in each WSI, whether in single or multiple layers; (5) analyzing metrics for scanning performance, such as scanning success rate, atypical cell numbers and coverage rate, scanning time, and image file size.
Fig. 2
Fig. 2
3D plots to visualize the distribution of AI-inferred atypical cells in representative paired sample slides scanned using 2 digital scanners. The upper panel shows a Cytospin slide (A) and a paired ThinPrep slide (B) scanned by the Leica scanner. The lower panel displays a Cytospin slide (C) and a paired ThinPrep slide (D) scanned by the Hamamatsu scanner. In the 3D slide plots, each black dot represents the location of an atypical cell. The horizontal axis designates the slide's relative distance (μm), and the vertical axis represents the Z-axis distance (μm). Line or rectangle area colors indicate scan ranges of single (Z=1, purple line) and multiple Z-layers (Z=5, red rectangle area; Z=7, blue rectangle area; Z=13, green rectangle area). Each Z-layer indicates the coverage rate of atypical cells defined as the ratio of atypical cell numbers in single or multiple Z-layers to the total number of atypical cells across all 21 Z-layers.
Fig. 3
Fig. 3
The graphs of mean response curve were used to illustrate the relationship between the number of Z-layers and either standardized mean atypical cell numbers (A) or coverage rate (B) across the 4 groups: Hamamatsu-Cytospin (represented by a solid green line), Leica-Cytospin (represented by a blue dashed line), Hamamatsu-ThinPrep (represented by a purple dashed line), and Leica-ThinPrep (represented by an orange dashed line). (A) A consistent pattern across all groups was observed where standardized mean atypical cell numbers increased with the number of Z-layers. (B) Upon utilizing a random intercept model for analysis, only the Leica-ThinPrep group exhibited a significant increase in the trend with the rising number of Z-layers, compared to the other 3 groups. *Statistically significant difference (P<.05)
Fig. 4
Fig. 4
Comparison of scanning time and image file size of different cytopreparation WSIs using 2 distinct scanners with manual focus mode and 21 Z-layer scan settings. The median scanning time (A) and image file size (B) were obtained from 10 paired Cytospin (represented by the white color bar) and ThinPrep (represented by the gray color bar) slides, scanned respectively by Leica and Hamamatsu digital scanners. *Statistically significant difference (P<.05)
Fig. 5
Fig. 5
Recommended urine cytology slide scanning workflow. In the first attempt, users should use the “default” mode to scan the urine cytology slides, utilizing at least 9 scanning layers (depending on the specific scanner and cytopreparation slides) with a 1 μm interval between each layer. If a slide image is successfully obtained on the first attempt, users must conduct an image quality assessment, determining the scan as either “clear” (indicating no artifacts or distortions in the image) and hence “successful,” or “blur” (highlighting any noticeable distortion or lack of clarity), designating the scan as a “failure” and requiring a second scan using the “manual” mode. If the initial scan does not meet the quality standards, a second attempt should be undertaken using the “manual” mode, maintaining a 1 μm interval between multilayer scans. Following this attempt, users should once again assess the image quality to ascertain whether the scan can be deemed “successful” with a clear image or “failure” with a blurry output, denoting the slide as unsuitable for further scanning. This 2-step approach is designed to enhance the quality of slide images making them fit for clinical interpretation.

References

    1. Lee R.E., McClintock D.S., Laver N.M., Yagi Y. Evaluation and optimization for liquid-based preparation cytology in whole slide imaging. J Pathol Inform. 2011;2:46. - PMC - PubMed
    1. da Cunha Santos G., Saieg M.A. Preanalytic specimen triage: smears, cell blocks, cytospin preparations, transport media, and cytobanking. Cancer Cytopathol. Jun 2017;125(S6):455–464. - PubMed
    1. Wojcik E.M., Kurtycz D.F.I., Rosenthal D.L. We’ll always have Paris The Paris System for Reporting Urinary Cytology 2022. J Am Soc Cytopathol. Mar-Apr 2022;11(2):62–66. - PubMed
    1. Nojima S., Terayama K., Shimoura S., et al. A deep learning system to diagnose the malignant potential of urothelial carcinoma cells in cytology specimens. Cancer Cytopathol. May 12 2021;129(12):984–995. - PubMed
    1. Kaneko M., Tsuji K., Masuda K., et al. Urine cell image recognition using a deep-learning model for an automated slide evaluation system. BJU Int. Jun 18 2021;130(2):235–243. - PubMed

LinkOut - more resources