. 2022:2:237-249.
doi: 10.1109/ojuffc.2022.3212342. Epub 2022 Oct 5.

Acoustic Molecular Imaging Beyond the Diffraction Limit In Vivo

Affiliations

Acoustic Molecular Imaging Beyond the Diffraction Limit In Vivo

Thomas M Kierski et al. IEEE Open J Ultrason Ferroelectr Freq Control. 2022.

Abstract

Ultrasound molecular imaging (USMI) is a technique used to noninvasively estimate the distribution of molecular markers in vivo by imaging microbubble contrast agents (MCAs) that have been modified to target receptors of interest on the vascular endothelium. USMI is especially relevant for preclinical and clinical cancer research and has been used to predict tumor malignancy and response to treatment. In the last decade, methods that improve the resolution of contrast-enhanced ultrasound by an order of magnitude and allow researchers to noninvasively image individual capillaries have emerged. However, these approaches do not translate directly to molecular imaging. In this work, we demonstrate super-resolution visualization of biomarker expression in vivo using superharmonic ultrasound imaging (SpHI) with dual-frequency transducers, targeted contrast agents, and localization microscopy processing. We validate and optimize the proposed method in vitro using concurrent optical and ultrasound microscopy and a microvessel phantom. With the same technique, we perform a proof-of-concept experiment in vivo in a rat fibrosarcoma model and create maps of biomarker expression co-registered with images of microvasculature. From these images, we measure a resolution of 23 μm, a nearly fivefold improvement in resolution compared to previous diffraction-limited molecular imaging studies.

Keywords: Molecular imaging; superharmonic imaging; ultrasound; ultrasound contrast agents; ultrasound localization microscopy.


Conflict of interest statement

CONFLICTS OF INTEREST F. Stuart Foster and Paul A. Dayton are inventors on a patent describing dual-frequency imaging, which is now licensed to Perkin Elmer. Thomas M. Kierski, Isabel G. Newsome, Gianmarco F. Pinton, and Paul A. Dayton are inventors on a patent describing dual-frequency ultrasound localization microscopy.

Figures

FIGURE 1.
FIGURE 1.
A diagram of the dual-frequency system with a color-coded rendering of the transducer. In this representation, arrows denote the direction of signal flow. The transducer is composed of an 18 MHz linear array (red) and two additional 1.7 MHz elements (blue). The low-frequency elements are held in place on either side of the linear array using a custom 3-D printed bracket. The linear array is operated normally for B-mode imaging, and superharmonic imaging is performed by transmitting with the low-frequency elements and receiving with the high-frequency array. All radiofrequency data is digitized and recorded with a high-frequency Vantage 256 scanner.
FIGURE 2.
FIGURE 2.
A flowchart outlining the steps for molecular ultrasound localization microscopy. (a) B-mode images are interleaved between (b) superharmonic contrast images. (c) Microbubbles are detected in the contrast images and localized. (d) Displacements are measured from the B-modes, and used to correct the coordinates in (c). Motion correction is only performed for in vivo imaging. A microbubble is considered bound if it persists locally (after motion correction, if applicable) for 12 or more consecutive time points.
FIGURE 3.
FIGURE 3.
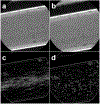
Optical comparison of control and biotinylated contrast agents in a microvessel phantom coated with avidin. Top row: bubbles near the upper wall of the tube after 3 min of flotation for control (a) and biotin (b) trials. Bottom row: Standard deviation images generated from 1 second of optical data captured after introducing flow of saline for control (c) and biotinylated (d) microbubbles. Streaks in the standard deviation image result from bubble movement.
FIGURE 4.
FIGURE 4.
Example super-resolution molecular images from control and targeted trials in a microflow phantom. (a) Processing data for the unmodified (control) contrast agent yields no detections. (b) The interaction between the biotinylated microbubbles and the avidin coating produces numerous localizations after processing (localizations are blurred for visualization only).
FIGURE 5.
FIGURE 5.
Measuring the correlation between optical and dual-frequency ultrasound bubble counts. Counting bubbles in optical and ultrasound videos across a range of different MCA concentrations suggests that the ultrasound bubble count scales linearly with respect to the ground truth bubble density.
FIGURE 6.
FIGURE 6.
Resolution measurements of the dual-frequency transducer in SpHI mode. The original resolution of the superharmonic imaging device was empirically determined by measuring the point spread function repeatedly within a region of interest over 400 independent images of bubbles floating in a water tank. The mean axial and lateral FWHM values were 73 ± 7 μm and 130 ± 17 μm, respectively.
FIGURE 7.
FIGURE 7.
Super-resolution ultrasound molecular imaging in three rodent fibrosarcomas. (a-c) B-mode (standard ultrasound) images from the center of each tumor captured with the high-frequency elements of the dual-frequency array (dynamic range = 40 dB). (d-f) Maximum intensity projections generated from dual-frequency superharmonic images acquired across the tumor volumes (dynamic range = 30 dB). (g-i) Maximum intensity projections created with superharmonic ultrasound localization microscopy (gray colormap) with super-resolved molecular signaling overlaid (warm colormap, localizations are blurred to improve visibility, true size is smaller). Scale bars are 1 mm. (j-l) 2 mm x 3.5 mm selections from each ULM image showing microvascular and biomarker detail. Scale bars are 250 μm. Images in the same column are the same tumor.
FIGURE 8.
FIGURE 8.
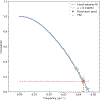
Fourier ring correlation plot for ULM image of rat fibrosarcoma vasculature. Single-image FRC plot corresponding to the centermost microvascular image from the center of the tumor in Fig. 7b. This plot was created using the open-source library linked to the publication by Koho and colleagues [39].
FIGURE 9.
FIGURE 9.
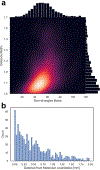
Vessel segmentation from tumor images allows for quantification of tortuosity metrics. (a) Kernel density plot of distance metric and sum-of-angles metric for all segmented vessels after removal of outliers (n = 698). (b) Histogram of distances between each segmented vessel and the nearest molecular localization.
FIGURE 10.
FIGURE 10.
Estimated degrees of vessel reconstruction (DOR) for each tumor. Box charts show the distributions of DOR values calculated from individual slices of the tumor volumes, grouped by subject from Fig. 7. The mean DOR values in order for each tumor are 0.69, 0.51, and 0.59.

References

    1. Hanahan D and Weinberg RA, “Hallmarks of cancer: The next generation,” Cell, vol. 144, no. 5, pp. 646–674, 2011, doi:10.1016/j.cell.2011.02.013. - DOI - PubMed
    1. Jain RK and Carmeliet P, “SnapShot: Tumor angiogenesis,” Cell, vol. 149, no. 6, 2012, Art. no. 1408.e1, doi: 10.1016/j.cell.2012.05.025. - DOI - PubMed
    1. Sigrist RM, Liau J, El Kaffas A, Chammas MC, and Willmann JK, “Ultrasound elastography: Review of techniques and clinical applications,” Theranostics, vol. 7, no. 5, pp. 1303–1329, 2017. - PMC - PubMed
    1. Oglat AA, Matjafri MZ, Suardi N, Oqlat MA, Abdelrahman MA, and Oqlat AA, “A review of medical Doppler ultrasonography of blood flow in general and especially in common carotid artery,” J. Med. Ultrasound, vol. 26, no. 1, pp. 3–13, Jan. 2018. - PMC - PubMed
    1. Tang MX et al., “Quantitative contrast-enhanced ultrasound imaging: A review of sources of variability,” Interface Focus, vol. 1, no. 4, pp. 520–539, 2011. - PMC - PubMed

LinkOut - more resources