

Al Promotion of In2O3 for CO2 Hydrogenation to Methanol
- PMID: 38125979
- PMCID: PMC10728901
- DOI: 10.1021/acscatal.3c04620
Al Promotion of In2O3 for CO2 Hydrogenation to Methanol
Abstract
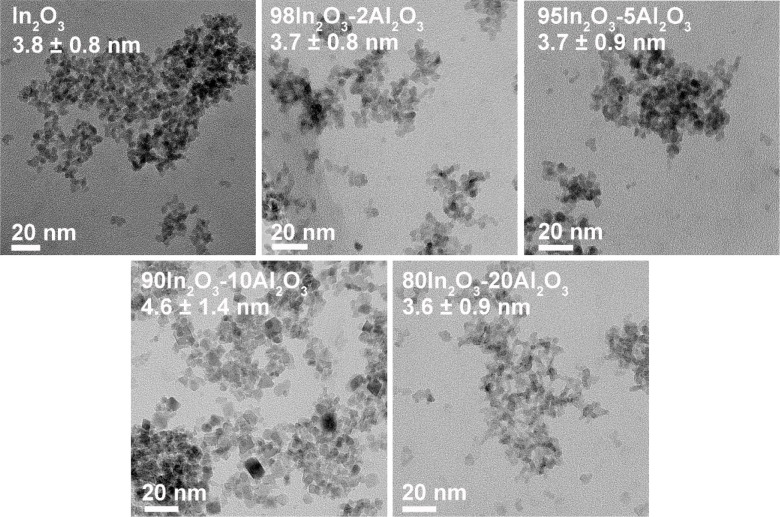
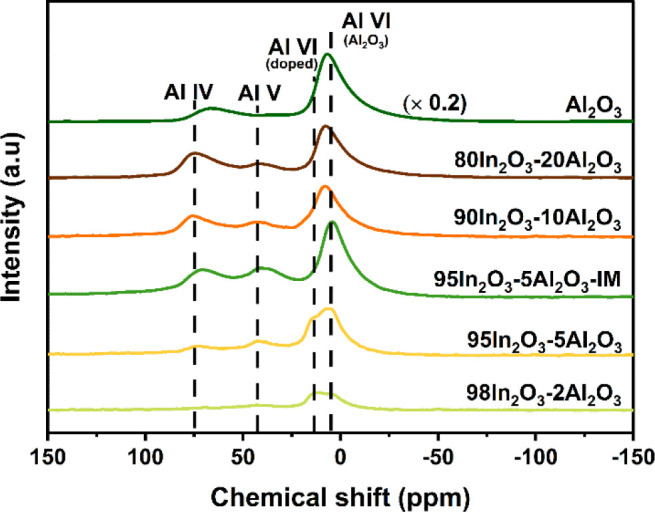
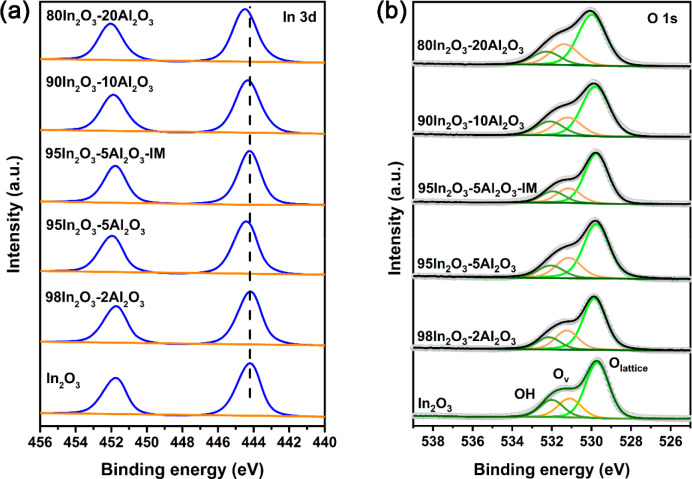
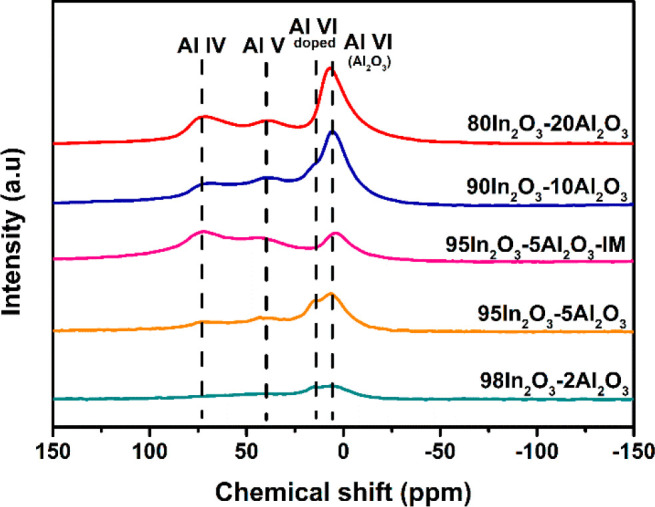
In2O3 is a promising catalyst for the hydrogenation of CO2 to methanol, relevant to renewable energy storage in chemicals. Herein, we investigated the promoting role of Al on In2O3 using flame spray pyrolysis to prepare a series of In2O3-Al2O3 samples in a single step (0-20 mol % Al). Al promoted the methanol yield, with an optimum being observed at an Al content of 5 mol %. Extensive characterization showed that Al can dope into the In2O3 lattice (maximum ∼ 1.2 mol %), leading to the formation of more oxygen vacancies involved in CO2 adsorption and methanol formation. The rest of Al is present as small Al2O3 domains at the In2O3 surface, blocking the active sites for CO2 hydrogenation and contributing to higher CO selectivity. At higher Al content (≥10 mol % Al), the particle size of In2O3 decreases due to the stabilizing effect of Al2O3. Nevertheless, these smaller particles are prone to sintering during CO2 hydrogenation since they appear to be more easily reduced. These findings show subtle effects of a structural promoter such as Al on the reducibility and texture of In2O3 as a CO2 hydrogenation catalyst.
© 2023 The Authors. Published by American Chemical Society.
Conflict of interest statement
The authors declare no competing financial interest.
Figures


Similar articles
-
Boosting oxygen vacancies by modulating the morphology of Au decorated In2O3 with enhanced CO2 hydrogenation activity to CH3OH.J Environ Sci (China). 2024 Jun;140:91-102. doi: 10.1016/j.jes.2023.05.010. Epub 2023 May 20. J Environ Sci (China). 2024. PMID: 38331518
-
Effect of reduction pretreatment on the structure and catalytic performance of Ir-In2O3 catalysts for CO2 hydrogenation to methanol.J Environ Sci (China). 2024 Jun;140:2-11. doi: 10.1016/j.jes.2023.01.018. Epub 2023 Jan 27. J Environ Sci (China). 2024. PMID: 38331500
-
Construction of Ni/In2O3 Integrated Nanocatalysts Based on MIL-68(In) Precursors for Efficient CO2 Hydrogenation to Methanol.ACS Appl Mater Interfaces. 2024 Apr 3;16(13):16186-16202. doi: 10.1021/acsami.3c19311. Epub 2024 Mar 22. ACS Appl Mater Interfaces. 2024. PMID: 38516696
-
Recent Advances of Indium Oxide-Based Catalysts for CO2 Hydrogenation to Methanol: Experimental and Theoretical.Materials (Basel). 2023 Mar 31;16(7):2803. doi: 10.3390/ma16072803. Materials (Basel). 2023. PMID: 37049097 Free PMC article. Review.
-
Recent Advances in Carbon Dioxide Adsorption, Activation and Hydrogenation to Methanol using Transition Metal Carbides.ChemSusChem. 2022 Nov 8;15(21):e202201183. doi: 10.1002/cssc.202201183. Epub 2022 Sep 26. ChemSusChem. 2022. PMID: 36036640 Review.
References
-
- Dang S.; Yang H.; Gao P.; Wang H.; Li X.; Wei W.; Sun Y. A review of research progress on heterogeneous catalysts for methanol synthesis from carbon dioxide hydrogenation. Catal. Today 2019, 330, 61–75. 10.1016/j.cattod.2018.04.021. - DOI
-
- Behrens M.; Studt F.; Kasatkin I.; Kühl S.; Hävecker M.; Abild-Pedersen F.; Zander S.; Girgsdies F.; Kurr P.; Kniep B.-L.; Tovar M.; Fischer R. W.; Nørskov J. K.; Schlögl R. The Active Site of Methanol Synthesis over Cu/ZnO/Al2O3 Industrial Catalysts. Science 2012, 336 (6083), 893–897. 10.1126/science.1219831. - DOI - PubMed
-
- Fichtl M. B.; Schlereth D.; Jacobsen N.; Kasatkin I.; Schumann J.; Behrens M.; Schlögl R.; Hinrichsen O. Kinetics of deactivation on Cu/ZnO/Al2O3 methanol synthesis catalysts. Appl. Catal., A 2015, 502, 262–270. 10.1016/j.apcata.2015.06.014. - DOI
-
- Sun J. T.; Metcalfe I. S.; Sahibzada M. Deactivation of Cu/ZnO/Al2O3 Methanol Synthesis Catalyst by Sintering. Ind. Eng. Chem. Res. 1999, 38 (10), 3868–3872. 10.1021/ie990078s. - DOI
LinkOut - more resources
Full Text Sources