. 2023 Dec 20;10(12):231066.
doi: 10.1098/rsos.231066. eCollection 2023 Dec.

A mixed-method approach to determining contact matrices in the Cox's Bazar refugee settlement

Affiliations

A mixed-method approach to determining contact matrices in the Cox's Bazar refugee settlement

Joseph Walker et al. R Soc Open Sci. .

Abstract

Contact matrices are an important ingredient in age-structured epidemic models to inform the simulated spread of the disease between subgroups of the population. These matrices are generally derived using resource-intensive diary-based surveys and few exist in the Global South or tailored to vulnerable populations. In particular, no contact matrices exist for refugee settlements-locations under-served by epidemic models in general. In this paper, we present a novel, mixed-method approach for deriving contact matrices in populations, which combines a lightweight, rapidly deployable survey with an agent-based model of the population informed by census and behavioural data. We use this method to derive the first set of contact matrices for the Cox's Bazar refugee settlement in Bangladesh. To validate our approach, we apply it to the UK population and compare our derived matrices with well-known contact matrices collected using traditional methods. Our findings demonstrate that our mixed-method approach successfully addresses some of the challenges faced by traditional and agent-based approaches to deriving contact matrices. It also shows potential for implementation in resource-constrained environments. This work therefore contributes to a broader aim of developing new methods and mechanisms of data collection for modelling disease spread in refugee and internally displaced person (IDP) settlements and better serving these vulnerable communities.

Keywords: contact matrices; individual-based model; simulation.


Conflict of interest statement

We declare we have no competing interests.

Figures

Figure 1.
Figure 1.
Demography of each camp modelled in June-Cox. The population of men is shown in blue, women in red and the proportion of adults to children is represented by the higher and lower portion of each bar, respectively. In June-Cox, we combine Camp-20 and the Camp-20 extension together forming camp ‘20 + Ex’.
Figure 2.
Figure 2.
Kutapalong–Batukhali Expansion Site and digital twin geographical and location information. Upper left: map of Bangladesh showing location of the Cox’s Bazar refugee settlement. Upper right: map of the modelled Expansion Site with three geographical layers. Lower left: modelled distribution centres in the Expansion Site. Lower right: detailed view of Camp 4 showing six types of modelled locations implemented in the June-Cox digital twin. Basemaps from [22,23].
Figure 3.
Figure 3.
The mean probability P to attend certain venues in any weekday 2 h time-step interval Δt by age for left, men; right, women.
Figure 4.
Figure 4.
Contact matrices from the UK validation procedure. Left: the derived input interaction matrix, UNCMR for ‘households’ for contacts between K, ‘kids’ less than 18; Y, ‘young adults’ 18–25; A, ‘adults’ 26–65; O, ‘old adults’ greater than 65. Centre: the simulated age-binned PNCMR matrix with entries C^ij from June-UK. Right: the BBC Pandemic project [29] ‘all home’ contact matrix, C, with entries cij. The simulated matrix and the survey matrix share the same colour map for ease of comparison. The input interaction matrix has its own so that the colour map has suitable contrast over the full range of number of contacts.
Figure 5.
Figure 5.
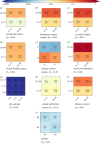
Two pairs of UNCMR for the virtual venues determined in prior work [5] (left) and the June-Cox virtual survey in the same coarse population bins (right), including the Canberra distance between them.
Figure 6.
Figure 6.
The UNCMR from the light weight survey data (left) and June-Cox virtual survey UNCM (right), with the relative Canberra distances. We set ‘community centres’ and ‘distribution centres’ identical to ‘female friendly spaces’ and ‘non-food distribution centres’, respectively.
Figure 7.
Figure 7.
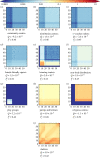
The reciprocal normalized contact matrices (UNCMR) by age as simulated in June-Cox. Note that the data inputs in (g,j) stem from a previous survey.
Figure 8.
Figure 8.
The population normalized contact matrices (PNCMR) by age as simulated in June-Cox. Note that the data inputs in (g,j) stem from a previous survey.
Figure 9.
Figure 9.
The normalized venue contact matrices (UNCMV) by input survey subgroups as simulated in June-Cox. Note that the data inputs in (g,j) stem from a previous survey.
Figure 10.
Figure 10.
The normalized contact matrices (UNCM) by age as simulated in June-Cox. Note that the data inputs in (g,j) stem from a previous survey.
Figure 11.
Figure 11.
The normalized venue contact matrices (UNCMV) by age as simulated in June-Cox. Note that the data inputs in (g,j) stem from a previous survey.
Figure 12.
Figure 12.
The normalized venue contact matrices (PNCM) by age as simulated in June-Cox. Note that the data inputs in (g,j) stem from a previous survey.
Figure 13.
Figure 13.
The normalized venue contact matrices (PNCMV) by age as simulated in June-Cox. Note that the data inputs in (g,j) stem from a previous survey.
Figure 14.
Figure 14.
Contact matrices from the UK validation procedure. Left: the derived input interaction matrix, UNCMR for ‘companies’ and ‘schools’, where the labels ‘W’ refers to ‘workers’, ‘S’ students, ‘T’, teachers. Centre: the simulated age-binned PNCMR matrix with entries C^ij from June-UK. Right: the BBC Pandemic project ‘all home’ contact matrix, C, with entries cij. The simulated matrices and the survey matrices share the same colour map for ease of comparison. The input interaction matrix has its own so that the colour maps have suitable contrast over the full range of number of contacts.
Figure 15.
Figure 15.
The normalized venue contact matrices (PNCMV) by age as simulated in June-UK.
Figure 16.
Figure 16.
The unique person attendance rates per day (left) and by time of day (right) for the virtual venue. The green shading represents the discrete time-step bins of the simulation. June can in general distinguish between days of the week however in June-Cox we only model differences between weekend and weekdays.
Figure 17.
Figure 17.
Quarterly hour binned histograms of the light weight survey responses. The total response count of men is shown in blue, women in red and the proportion of adults to children is represented by the higher and lower portion of each bar respectively. The survey equates ‘community centres’ and ‘distribution centres’ to ‘female friendly spaces’ and ‘non-food distribution centres’, respectively.
Figure 18.
Figure 18.
The population pyramid of Cox’s Bazar across all camps [46,47]. Male population is shown on the left in blue and female on the right in red. The percentage of the population of each category is quoted.
Figure 19.
Figure 19.
Figure of proportion of household types. Note that not all of these groups are mutually exclusive. Green represents the reconstruction in June and blue the reported data (if available). Those groups where data was unavailable are reported in the figure for completeness. June-Cox data reported with scaled error bars of the standard deviation over 20 independent household clustering.
Figure 20.
Figure 20.
Figure of key shelter properties. Left: distribution of household family sizes. Middle: distribution of shelter sizes. Right: proportion of one- and two-household shelters. Green bars represent the reconstruction in June and blue bars are the reported data (if available). June-Cox data reported with scaled error bars of the standard deviation over 20 independent household clustering.
Figure 21.
Figure 21.
Figure of microscopic household properties. Left: distribution of household male female age gap in houses containing only two adults in the range 24–49. Middle: distribution adult child age gaps in households containing one adult (24–49) and the eldest child (0–18). Right: distribution of number of children by household. Green represents the reconstruction in June-Cox and black dashed lines the reported mean data (if available). June-Cox data reported with scaled error bars of the standard deviation over 20 independent household clustering.

References

    1. Fine PEM, Clarkson JA. 1982. Measles in England and Wales—I: an analysis of factors underlying seasonal patterns. Int. J. Epidemiol. 11, 5-14. ( 10.1093/ije/11.1.5) - DOI - PubMed
    1. Anderson RM, May RM. 1985. Age-related changes in the rate of disease transmission: implications for the design of vaccination programmes. Epidemiol. Infect. 94, 365-436. ( 10.1017/S002217240006160X) - DOI - PMC - PubMed
    1. Aylett-Bullock J, et al. 2022. Epidemiological modelling in refugee and internally displaced people settlements: challenges and ways forward. BMJ Glob. Health 7, e007822. ( 10.1136/bmjgh-2021-007822) - DOI - PMC - PubMed
    1. Altare C, Kahi V, Ngwa M, Goldsmith A, Hering H, Burton A, Spiegel P. 2019. Infectious disease epidemics in refugee camps: a retrospective analysis of UNHCR data (2009–2017). J. Glob. Health Rep. 3, e2019064. ( 10.29392/joghr.3.e2019064) - DOI
    1. Aylett-Bullock J, et al. 2021. Operational response simulation tool for epidemics within refugee and IDP settlements: a scenario-based case study of the Cox’s Bazar settlement. PLoS Comput. Biol. 17, e1009360. ( 10.1371/journal.pcbi.1009360) - DOI - PMC - PubMed

LinkOut - more resources