. 2024 Feb 7;14(2):jkad272.
doi: 10.1093/g3journal/jkad272.

Gene dosage adaptations to mtDNA depletion and mitochondrial protein stress in budding yeast

Affiliations

Gene dosage adaptations to mtDNA depletion and mitochondrial protein stress in budding yeast

Joshua T McNamara et al. G3 (Bethesda). .

Abstract

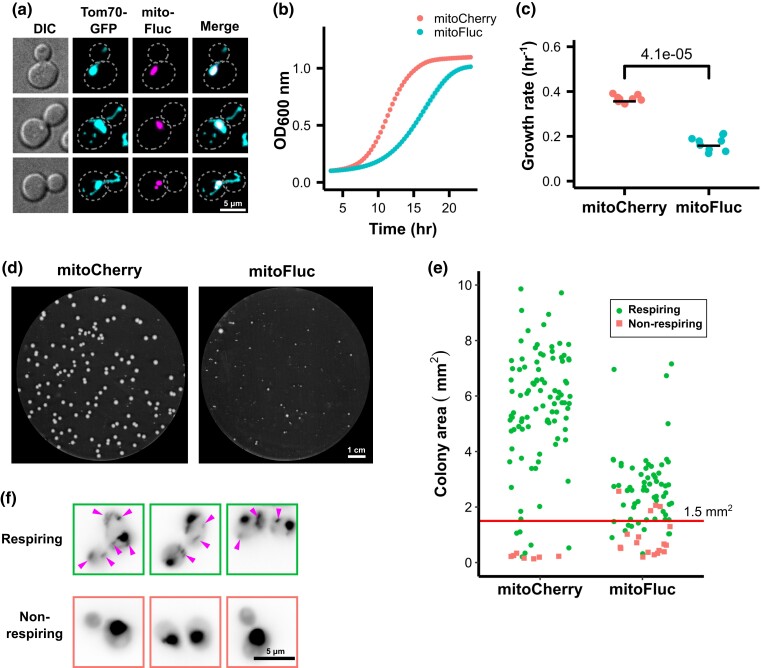
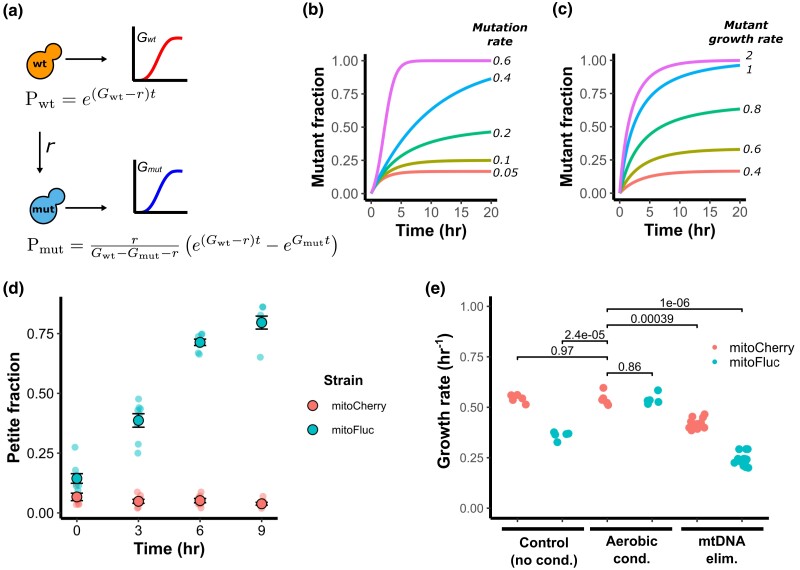
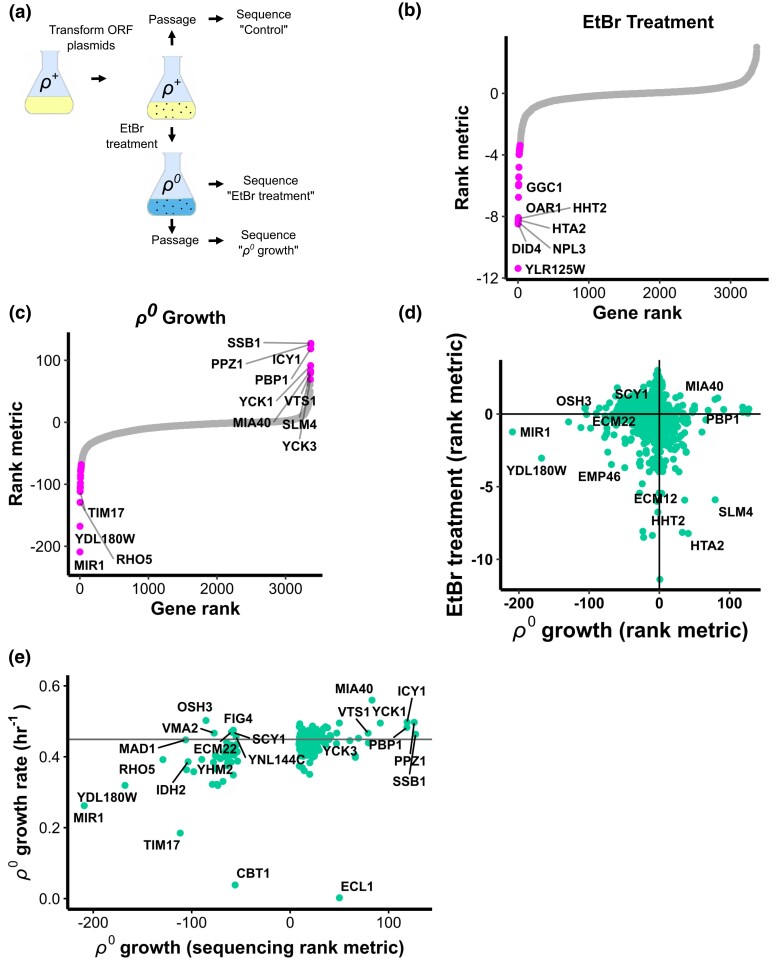
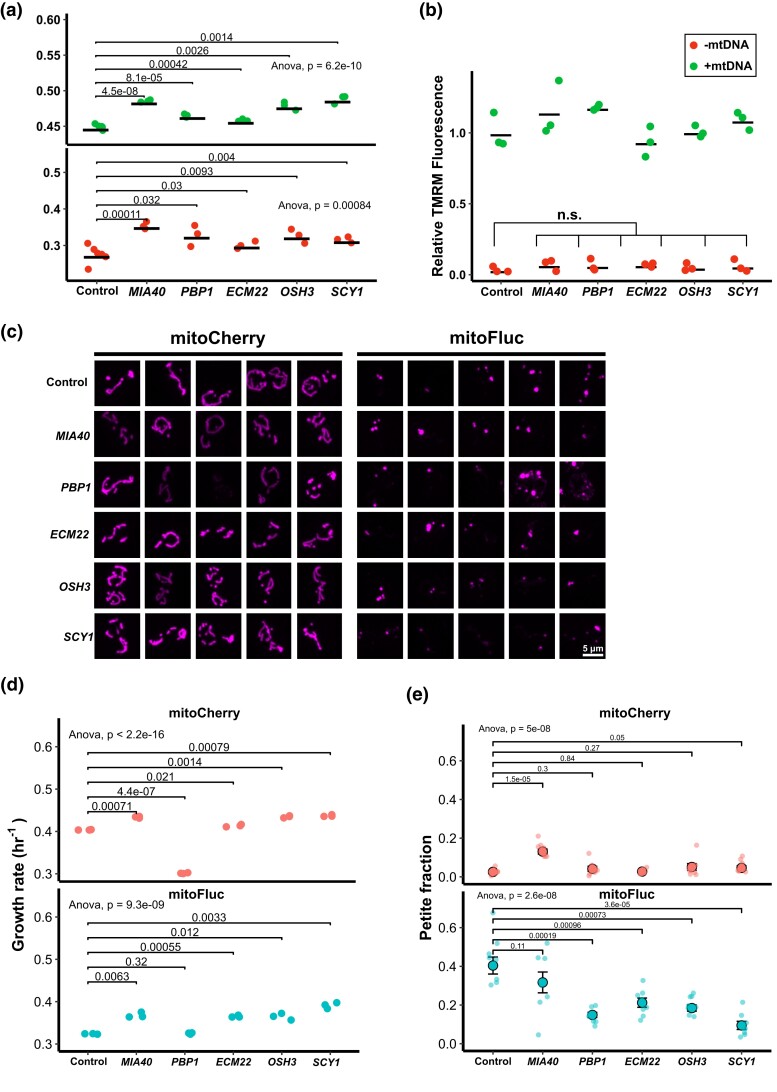
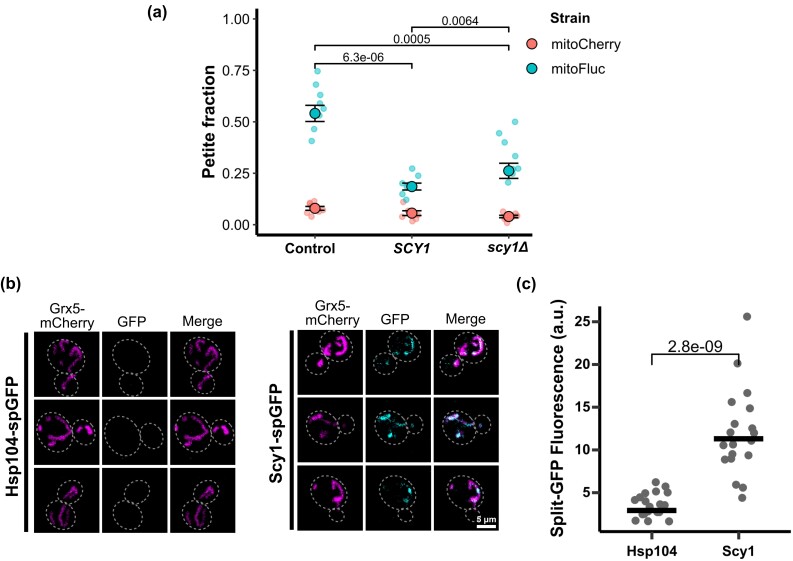
Mitochondria contain a local genome (mtDNA) comprising a small number of genes necessary for respiration, mitochondrial transcription and translation, and other vital functions. Various stressors can destabilize mtDNA leading to mtDNA loss. While some cells can survive mtDNA loss, they exhibit various deficiencies. Here, we investigated the impact of proteotoxicity on mitochondrial function by inducing mitochondrial unfolded protein stress in budding yeast. This led to rapid mtDNA loss, but aerobic conditioning imparted transient resistance to mitochondrial protein stress. We present a quantitative model of mtDNA loss in a growing cell population and measure its parameters. To identify genetic adaptations to mtDNA depletion, we performed a genome-wide screen for gene dosage increases that affect the growth of cells lacking mtDNA. The screen revealed a set of dosage suppressors that alleviate the growth impairment in mtDNA-deficient cells. Additionally, we show that these suppressors of mtDNA stress both bolster cell proliferation and prevent mtDNA loss during mitochondrial protein stress.

Keywords: copy number variation; functional genomics; mitochondria; mtDNA; protein aggregates; proteostasis; respiration; stress resistance.


Conflict of interest statement

Conflicts of interest The author(s) declare no conflicts of interest.

Figures

Fig. 1.
Fig. 1.
Mitochondrial unfolded protein stress impairs growth and induces mtDNA loss. a) Fluorescence image of yeast cells expressing an aggregation-prone, mitochondria-targeted synthetic protein (mitoFluc) tagged with mCherry and with the outer mitochondrial membrane protein Tom70 tagged with GFP. b) Growth curves of cells expressing either mitoCherry or mitoFluc. Optical density at 600 nm (OD600) was measured every 20 minutes; points represent means and shading (partly obscured) represents standard error of 8 biological replicates. c) Exponential growth rates of cells expressing either mitoCherry or mitoFluc. Constants determined by log-linear fit to the OD600 curves. Black bar indicates mean of 8 biological replicates. P value from 2-tailed t-test. d) YPD plate of yeast colonies expressing either mitoCherry or mitoFluc. e) Assay for respiratory competence by colony size. Each dot represents 1 yeast colony. After area measurement, colonies were patched on YPG plates to test for respiratory growth. Line at 1.5 mm2 indicates the threshold chosen to define the petite colony phenotype, which yields similar false-positive petite calls between the strains. Green circles represent respiring colonies, red squares represent non-respiring colonies. f) Representative images of cells from respiration-competent and respiration-negative colonies with DNA stained by DAPI. Magenta arrows indicate mtDNA nucleoids, and the large DAPI spots are cell nuclei.
Fig. 2.
Fig. 2.
Modeling and determination of mtDNA loss rate in a growing cell population. a) Schematic of 2-state model of mtDNA loss in a growing population. Gwt is the growth constant of the wild-type cells, Gmut is the growth constant of the mutated ρ0 cells, r is the rate of mtDNA loss, Pwt is the population size of wild-type cells, Pmut is the population size of mutant ρ0 cells, t is time since the foundation of a population. b) Simulated population proportion of mtDNA mutants for a range of mutation rates and c) mutant growth rates. d) Time-resolved assay of mtDNA loss during mitochondrial protein stress. Cultures were kept in exponential growth phase for experiment duration by dilution with new media to avoid selecting for respiring cells. Circles represent measured petite frequencies in independent biological replicates, black circles indicate the population-weighted mean petite fraction from 8 biological replicates, error bars represent simple SEM of petite frequencies between each replicate (unweighted). e) Effect of mitochondrial modifiers on growth rate. Dots indicate rates from independent biological replicates. P values are calculated from a 2-tailed t-test.
Fig. 3.
Fig. 3.
mtDNA-binding proteins are enriched in mitochondrial protein aggregates. a) Representative fluorescence images of either mitoCherry control cells or mitoFluc cells grown in YPD medium with various mtDNA-binding proteins tagged with GFP. b) Fluorescence micrograph of mtDNA-LacO LacI-3xGFP mitoCherry or mitoFluc cells stained with DAPI.
Fig. 4.
Fig. 4.
Genome-wide screen for dosage suppressors of mtDNA stress. a) Schematic of how 3 samples were prepared for barcode sequencing screen. b) Enrichment of gene dosage increase plasmids during EtBr treatment. Rank metric is the negative, base-10 logarithm of the raw P value associated with a gene's differential enrichment multiplied by the sign of the logarithm of its fold-change (i.e. negative for plasmid depleted and positive for enriched). Genes are rank ordered along the x axis. P values calculated from 3 biological replicates. Genes for which P < 0.05 after applying Benjamini–Hochberg (BH) correction for false discovery feature magenta dots. c) Enrichment of gene dosage increase plasmids during ρ0 growth. Plot elements as in B, except that points are magenta for P < 10−65 after BH correction. d) Comparison of EtBr and ρ0 growth experiments. e) Summary plot comparing ρ0 growth barcode sequencing screen and ρ0 growth rate screen results. Horizontal line indicates the growth rate of the control strain.
Fig. 5.
Fig. 5.
ρ 0 growth enhancers increase growth rate and reduce mtDNA loss during mitochondrial protein stress. a) Growth rates of ρ+ (green dots) and ρ0 (red dots) cells bearing gene dosage increase plasmids. Dots represent independent biological replicates, means are represented as black bars. P values from a 1-tailed t-test comparing the ρ0 growth rates. b) Assay of mitochondrial membrane potential by TMRM fluorescence. Dots indicate population mean fluorescence from independent biological replicates consisting of at least 10,000 cells each, measured by flow cytometry. Fluorescence levels normalized to the ρ+ control strain. Two-tailed t-test between the ρ0 control and each ρ0 group yielded P > 0.05 (not significant). c) Fluorescence micrograph of cells bearing gene dosage increase plasmids, expressing either mitoCherry or mitoFluc. d) Growth rates of cells bearing gene dosage increase plasmids in the presence and absence of mitochondrial protein stress. Significance figures are from a 2-tailed t-test between each group. e) mtDNA loss rate of cells bearing gene dosage increase plasmids during mitochondrial protein stress. Each dot represents petite fraction of an independent biological replicate. Black circles show population-weighted mean of 8 replicates for each genotype. Error bars represent simple, unweighted standard error between replicates. P values from 2-tailed t-tests between indicated genotypes.
Fig. 6.
Fig. 6.
SCY1 is a dosage-sensitive suppressor of mtDNA stress and is detected in the mitochondrial matrix. a) Petite frequency measurement by SCY1 gene dosage. Dots are the petite fraction of independent biological replicates. Black circles show the weighted mean for each group of 8 replicates. Error bars indicate unweighted standard error between replicates. P values from 2-tailed t-test between only the mitoFluc groups. b) Representative fluorescence images of split-GFP localization assay. c) Fluorescence quantification of split-GFP assay for mitochondrial localization. Each dot represents the sum of split-GFP pixel intensities within a mask created by thresholding the mitochondrial matrix marker of 1 cell. Black bars show group mean. P value from 2-tailed t-test.

Similar articles

Cited by

  • The micromammals.
    Forsburg SL. Forsburg SL. G3 (Bethesda). 2024 Jun 5;14(6):jkae073. doi: 10.1093/g3journal/jkae073. G3 (Bethesda). 2024. PMID: 38837137 Free PMC article.

References

    1. Akdoğan E, Tardu M, Garipler G, Baytek G, Kavakli İH, Dunn CD. 2016. Reduced glucose sensation can increase the fitness of Saccharomyces cerevisiae lacking mitochondrial DNA. PLOS ONE. 11(1):e0146511. doi:10.1371/journal.pone.0146511. - DOI - PMC - PubMed
    1. Ashar FN, Moes A, Moore AZ, Grove ML, Chaves PHM, Coresh J, Newman AB, Matteini AM, Bandeen-Roche K, Boerwinkle E, et al. . 2015. Association of mitochondrial DNA levels with frailty and all-cause mortality. J Mol Med Berl Ger. 93(2):177–186. doi:10.1007/s00109-014-1233-3. - DOI - PMC - PubMed
    1. Ashar FN, Zhang Y, Longchamps RJ, Lane J, Moes A, Grove ML, Mychaleckyj JC, Taylor KD, Coresh J, Rotter JI, et al. . 2017. Association of mitochondrial DNA copy number with cardiovascular disease. JAMA Cardiol. 2(11):1247–1255. doi:10.1001/jamacardio.2017.3683. - DOI - PMC - PubMed
    1. Bender A, Krishnan KJ, Morris CM, Taylor GA, Reeve AK, Perry RH, Jaros E, Hersheson JS, Betts J, Klopstock T, et al. . 2006. High levels of mitochondrial DNA deletions in substantia nigra neurons in aging and Parkinson disease. Nat Genet. 38(5):515–517. doi:10.1038/ng1769. - DOI - PubMed
    1. Birner R, Bürgermeister M, Schneiter R, Daum G. 2001. Roles of phosphatidylethanolamine and of its several biosynthetic pathways in Saccharomyces cerevisiae. Mol Biol Cell. 12(4):997–1007. doi:10.1091/mbc.12.4.997. - DOI - PMC - PubMed

Publication types

MeSH terms

LinkOut - more resources