. 2024 Feb;44(2):366-390.
doi: 10.1161/ATVBAHA.123.320279. Epub 2023 Dec 21.

Requirement of Site-Specific Tyrosine Phosphorylation of Cortactin in Retinal Neovascularization and Vascular Leakage

Affiliations

Requirement of Site-Specific Tyrosine Phosphorylation of Cortactin in Retinal Neovascularization and Vascular Leakage

Raj Kumar et al. Arterioscler Thromb Vasc Biol. 2024 Feb.

Abstract

Background: Retinal neovascularization is a major cause of vision impairment. Therefore, the purpose of this study is to investigate the mechanisms by which hypoxia triggers the development of abnormal and leaky blood vessels.

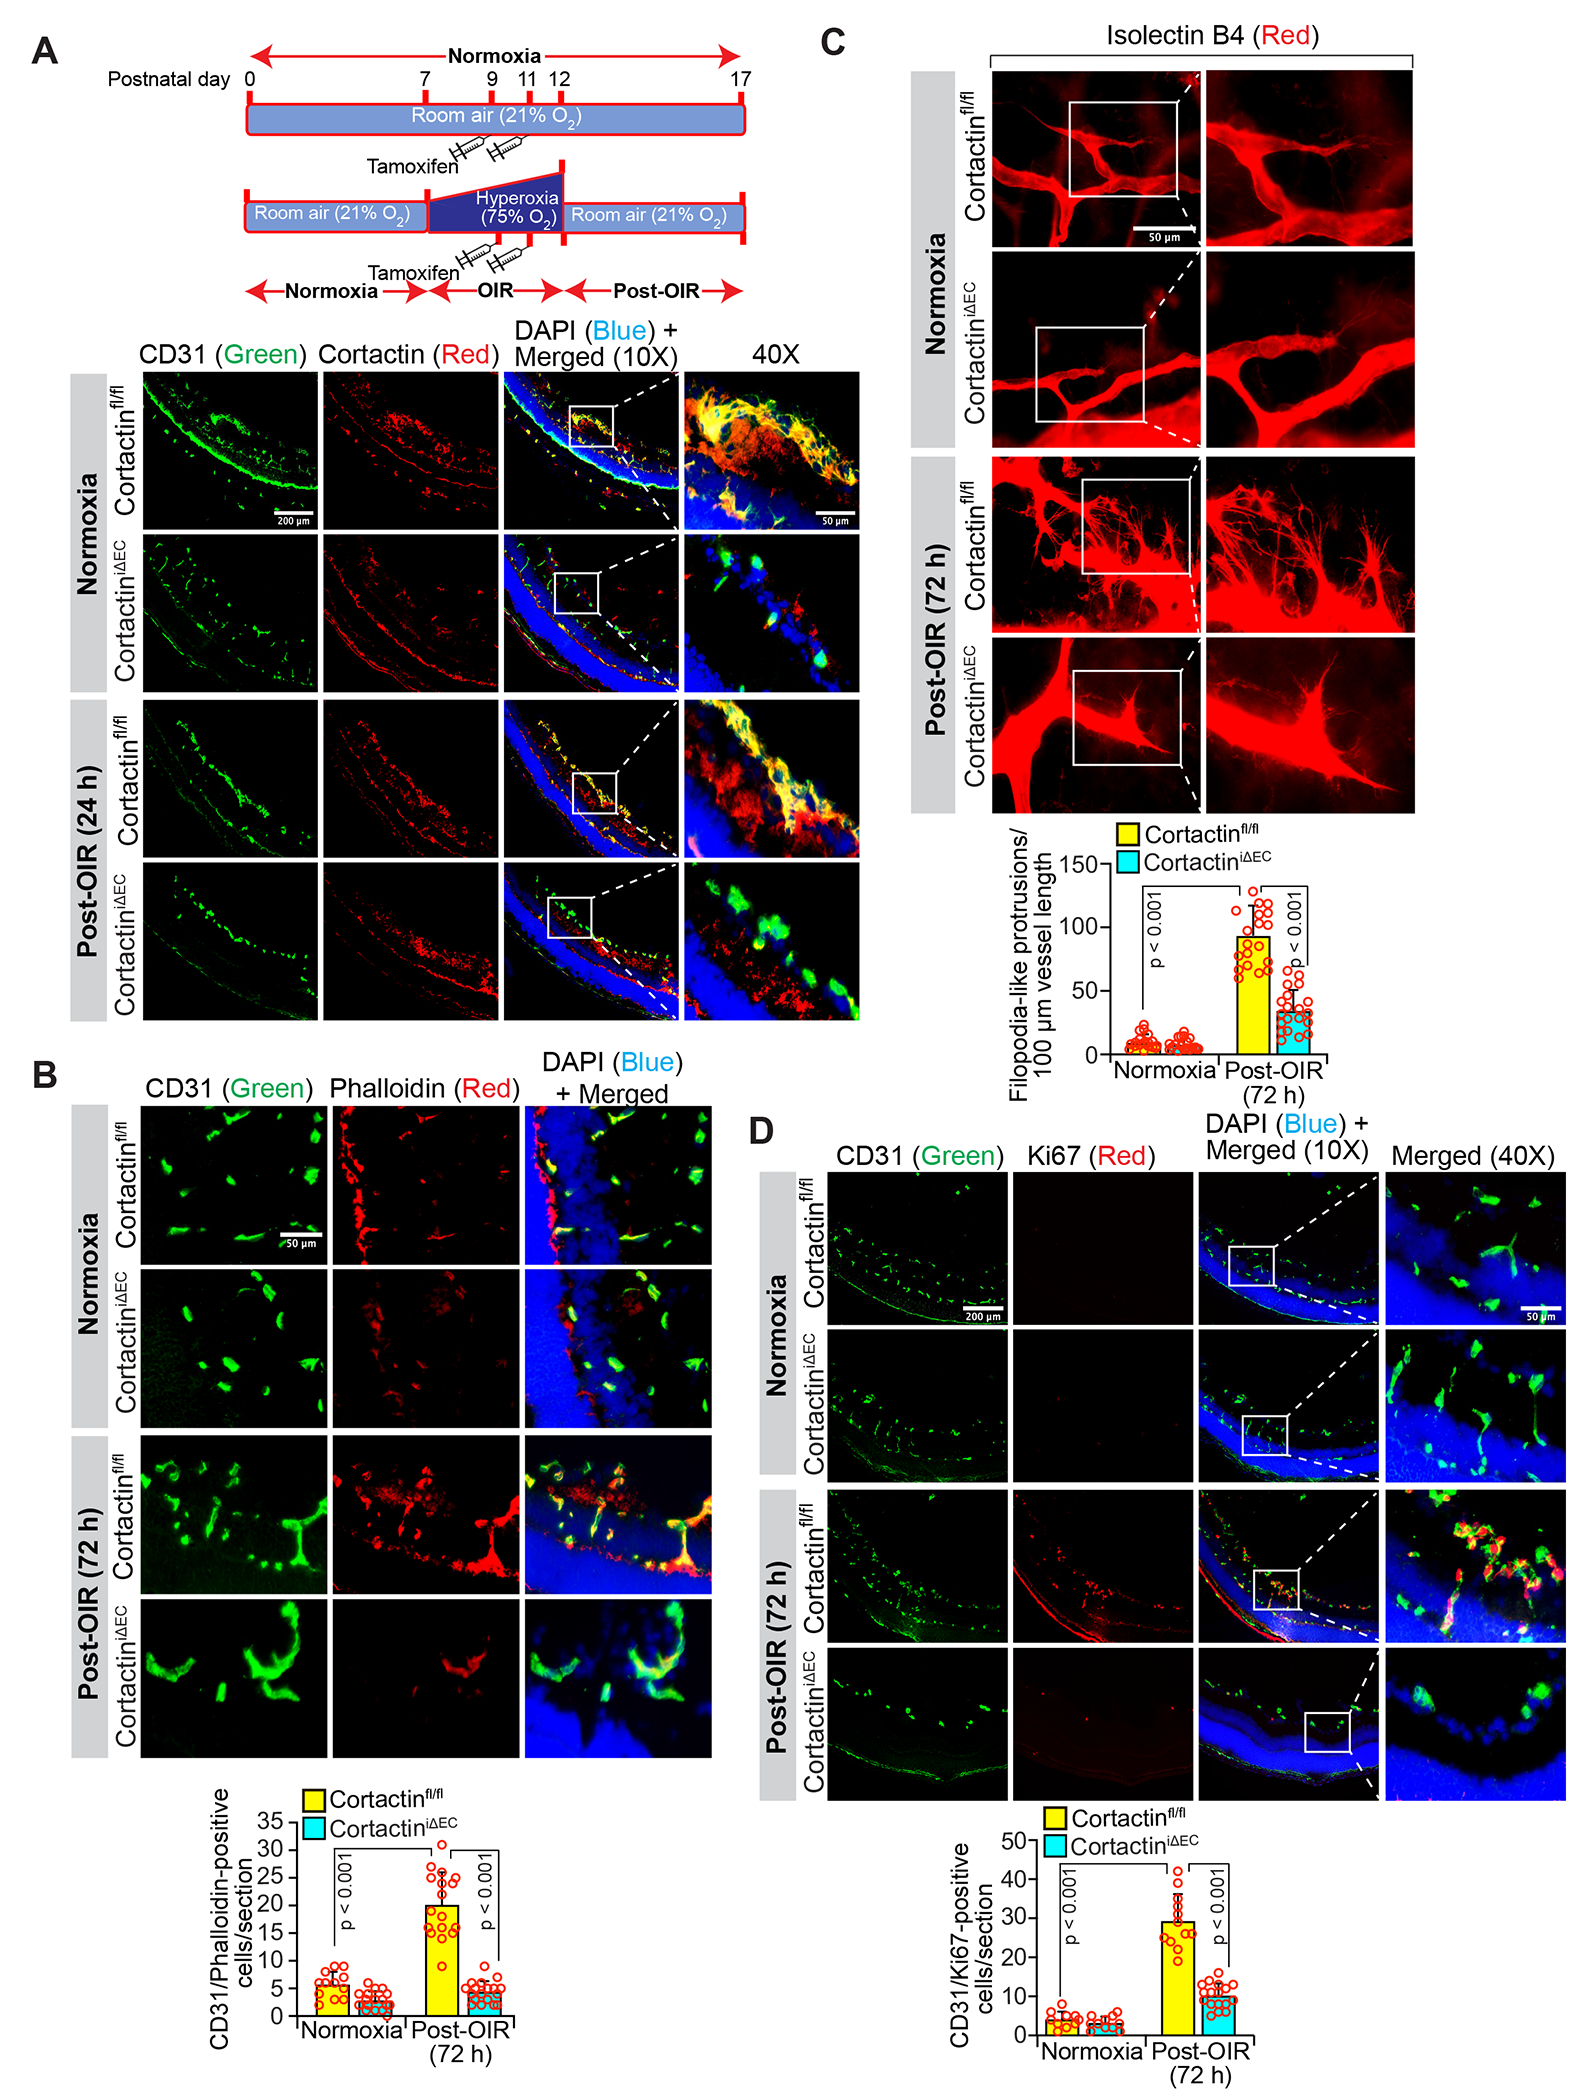
Methods: A variety of cellular and molecular approaches as well as tissue-specific knockout mice were used to investigate the role of Cttn (cortactin) in retinal neovascularization and vascular leakage.

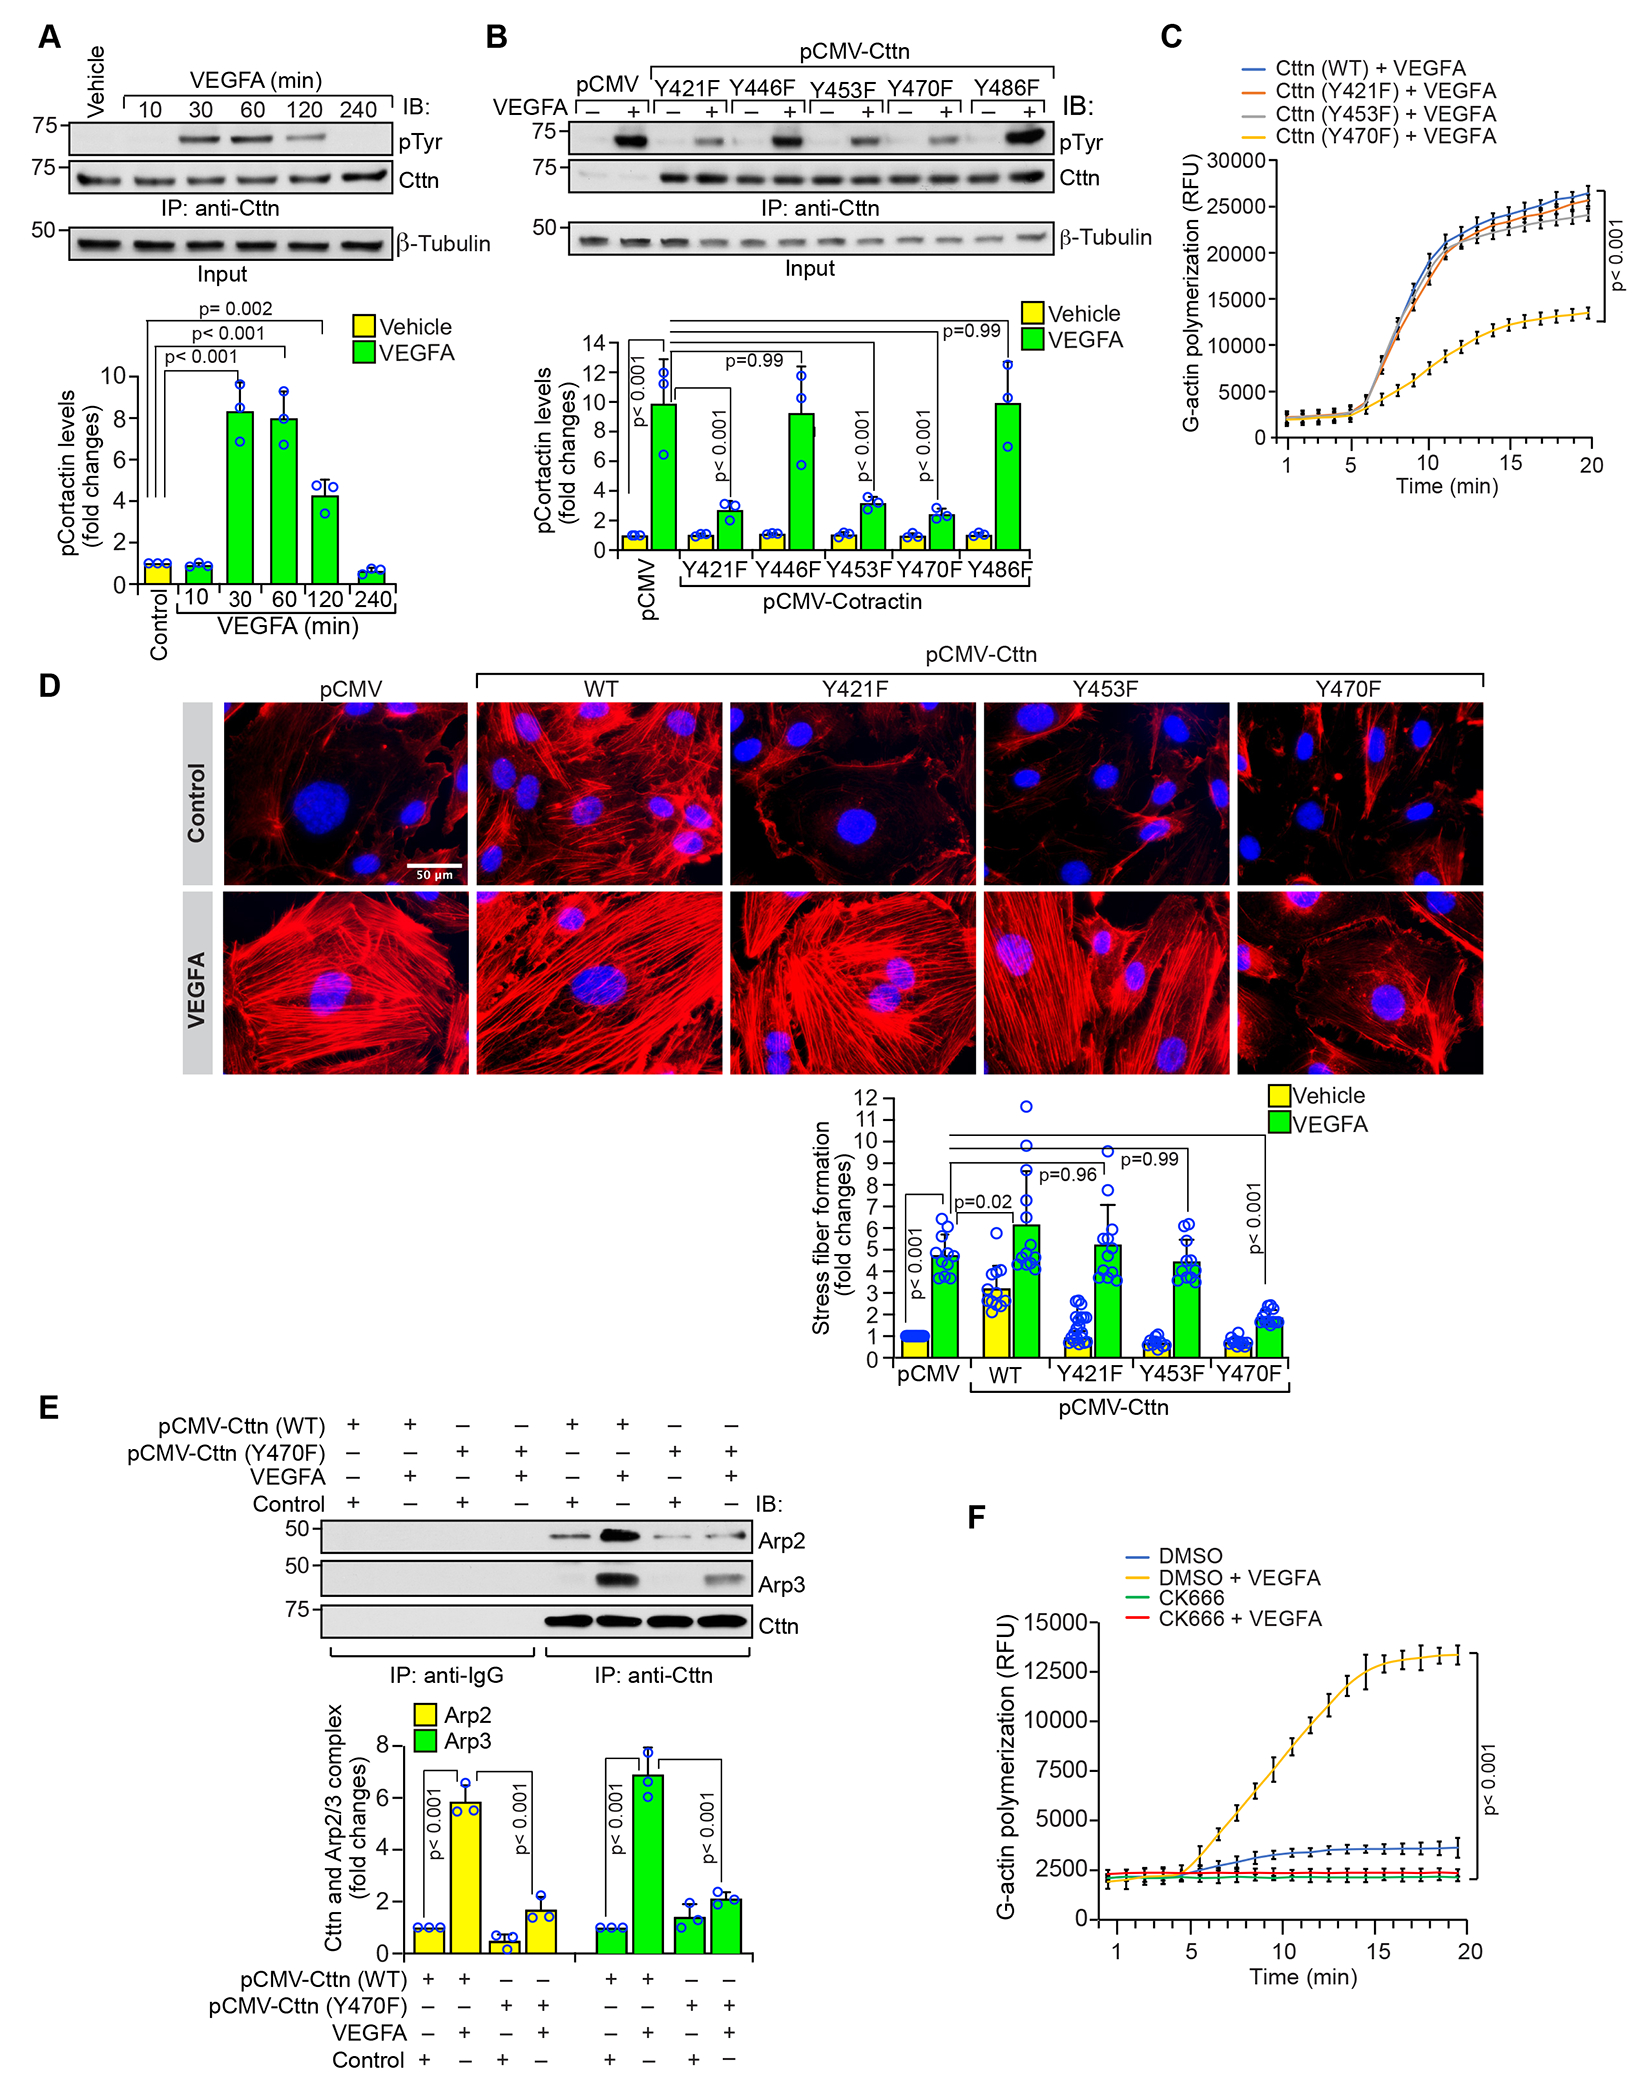
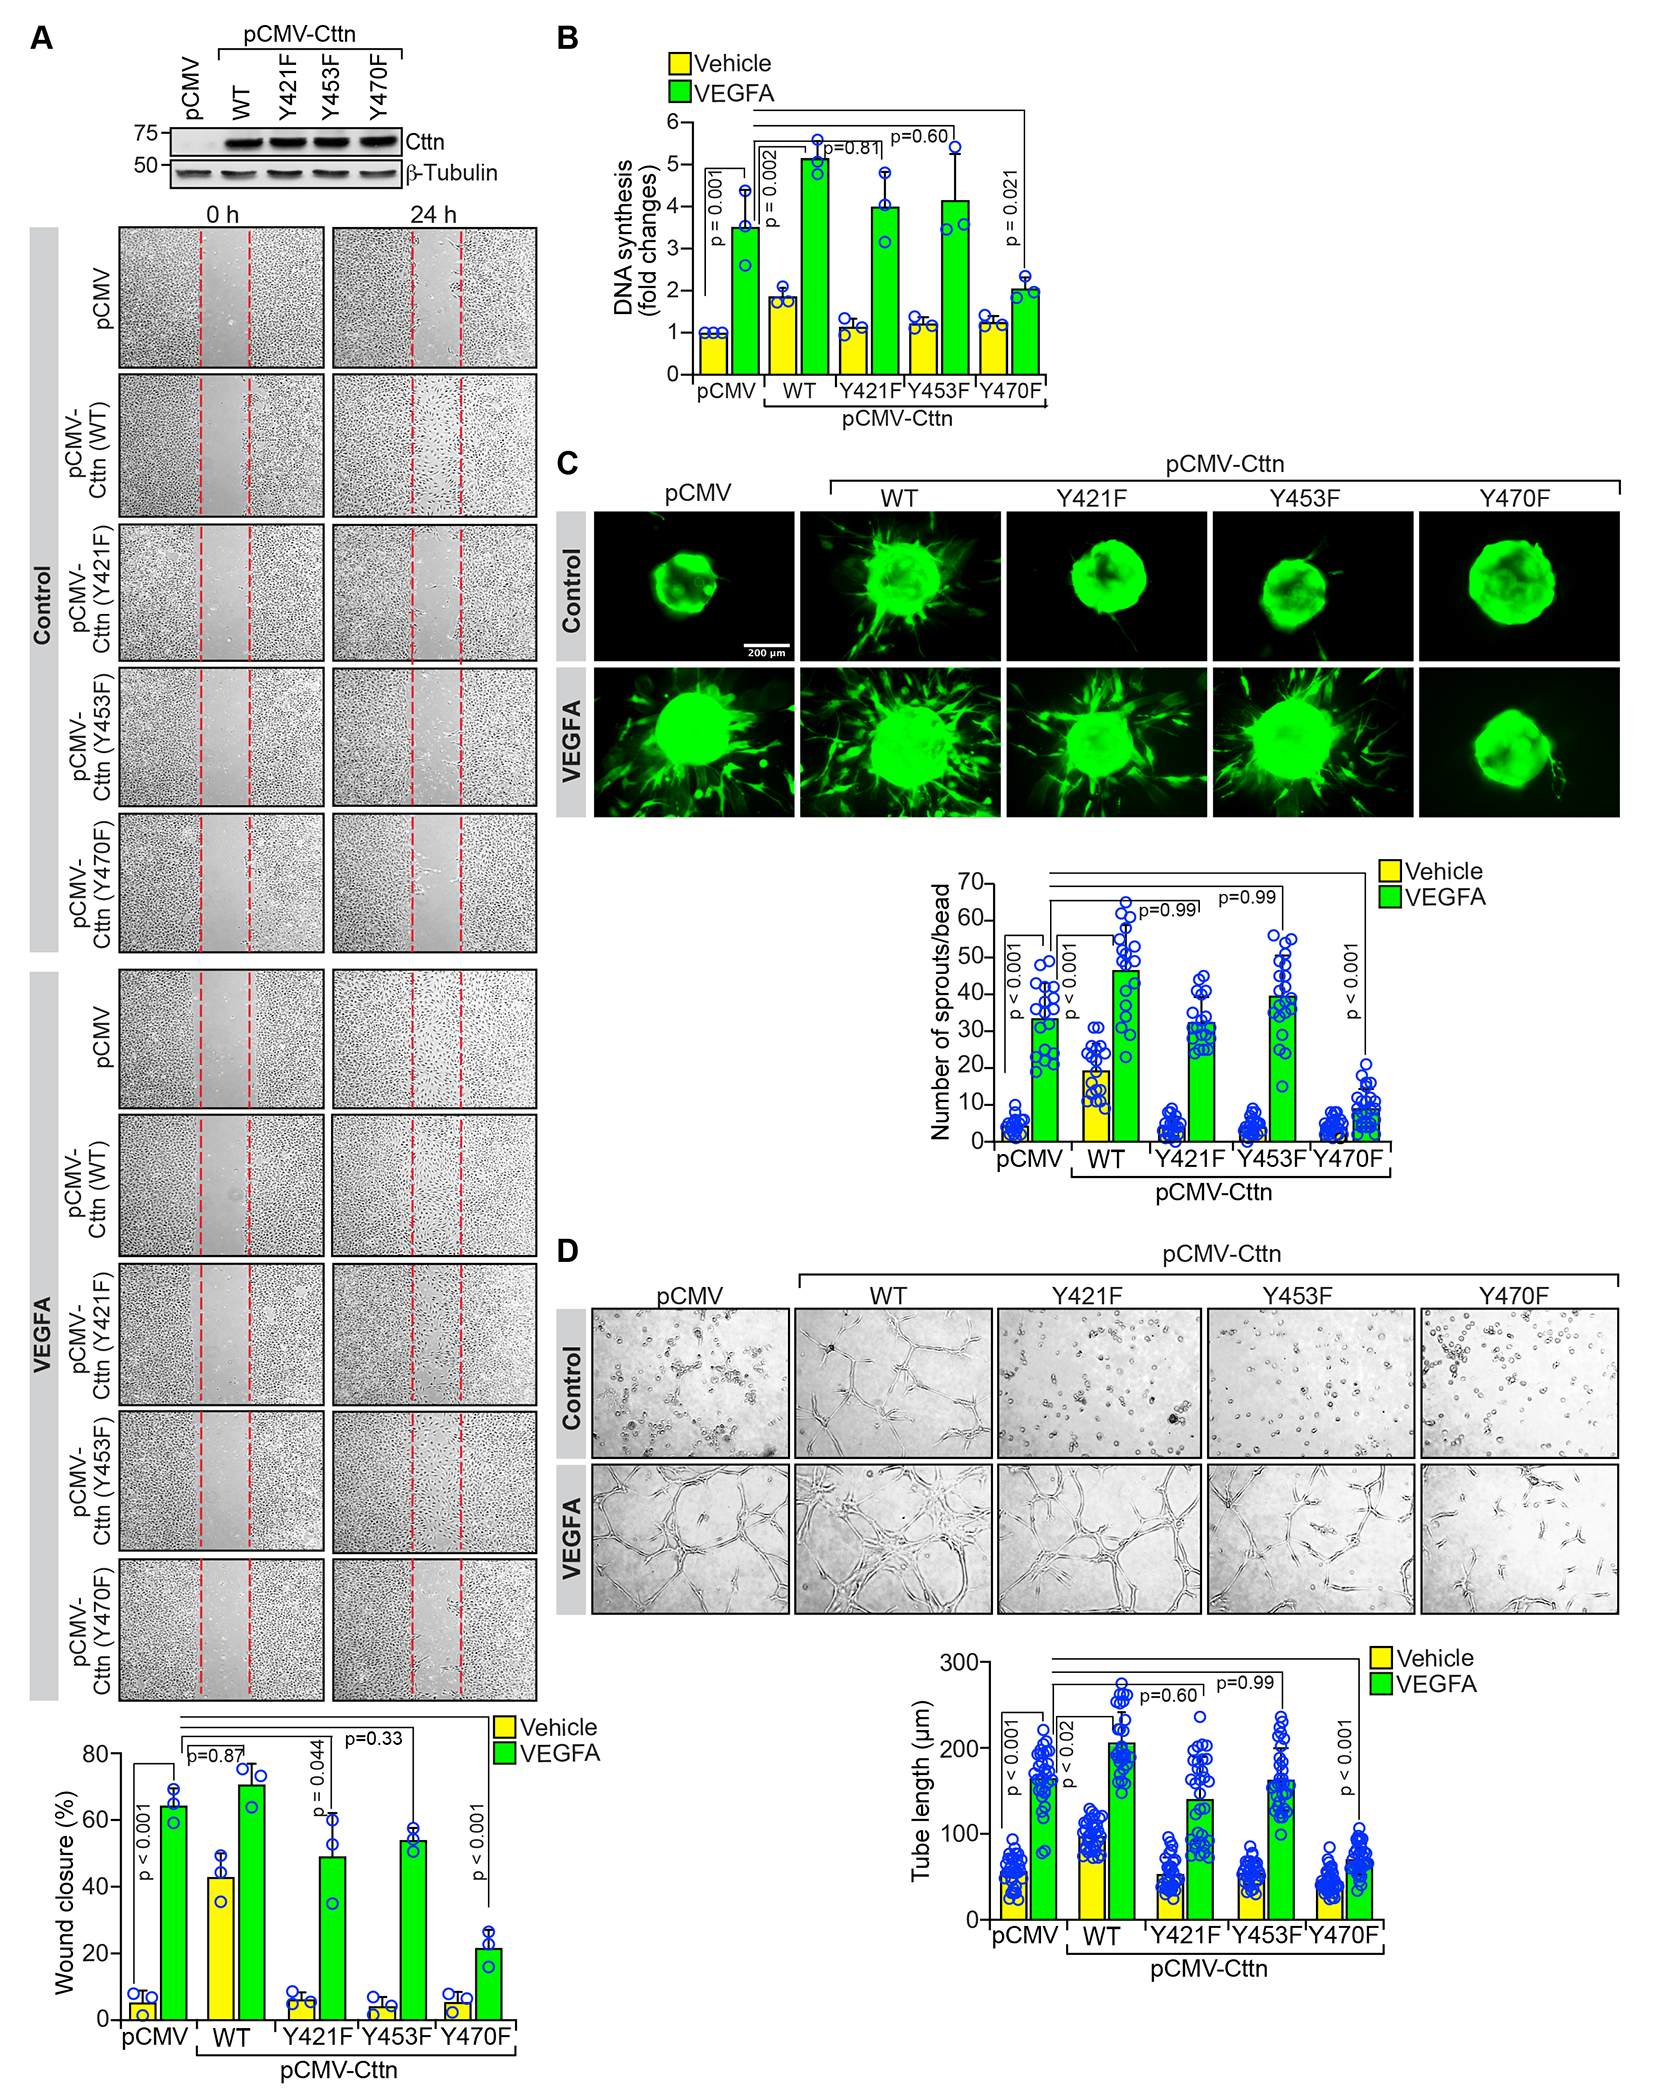
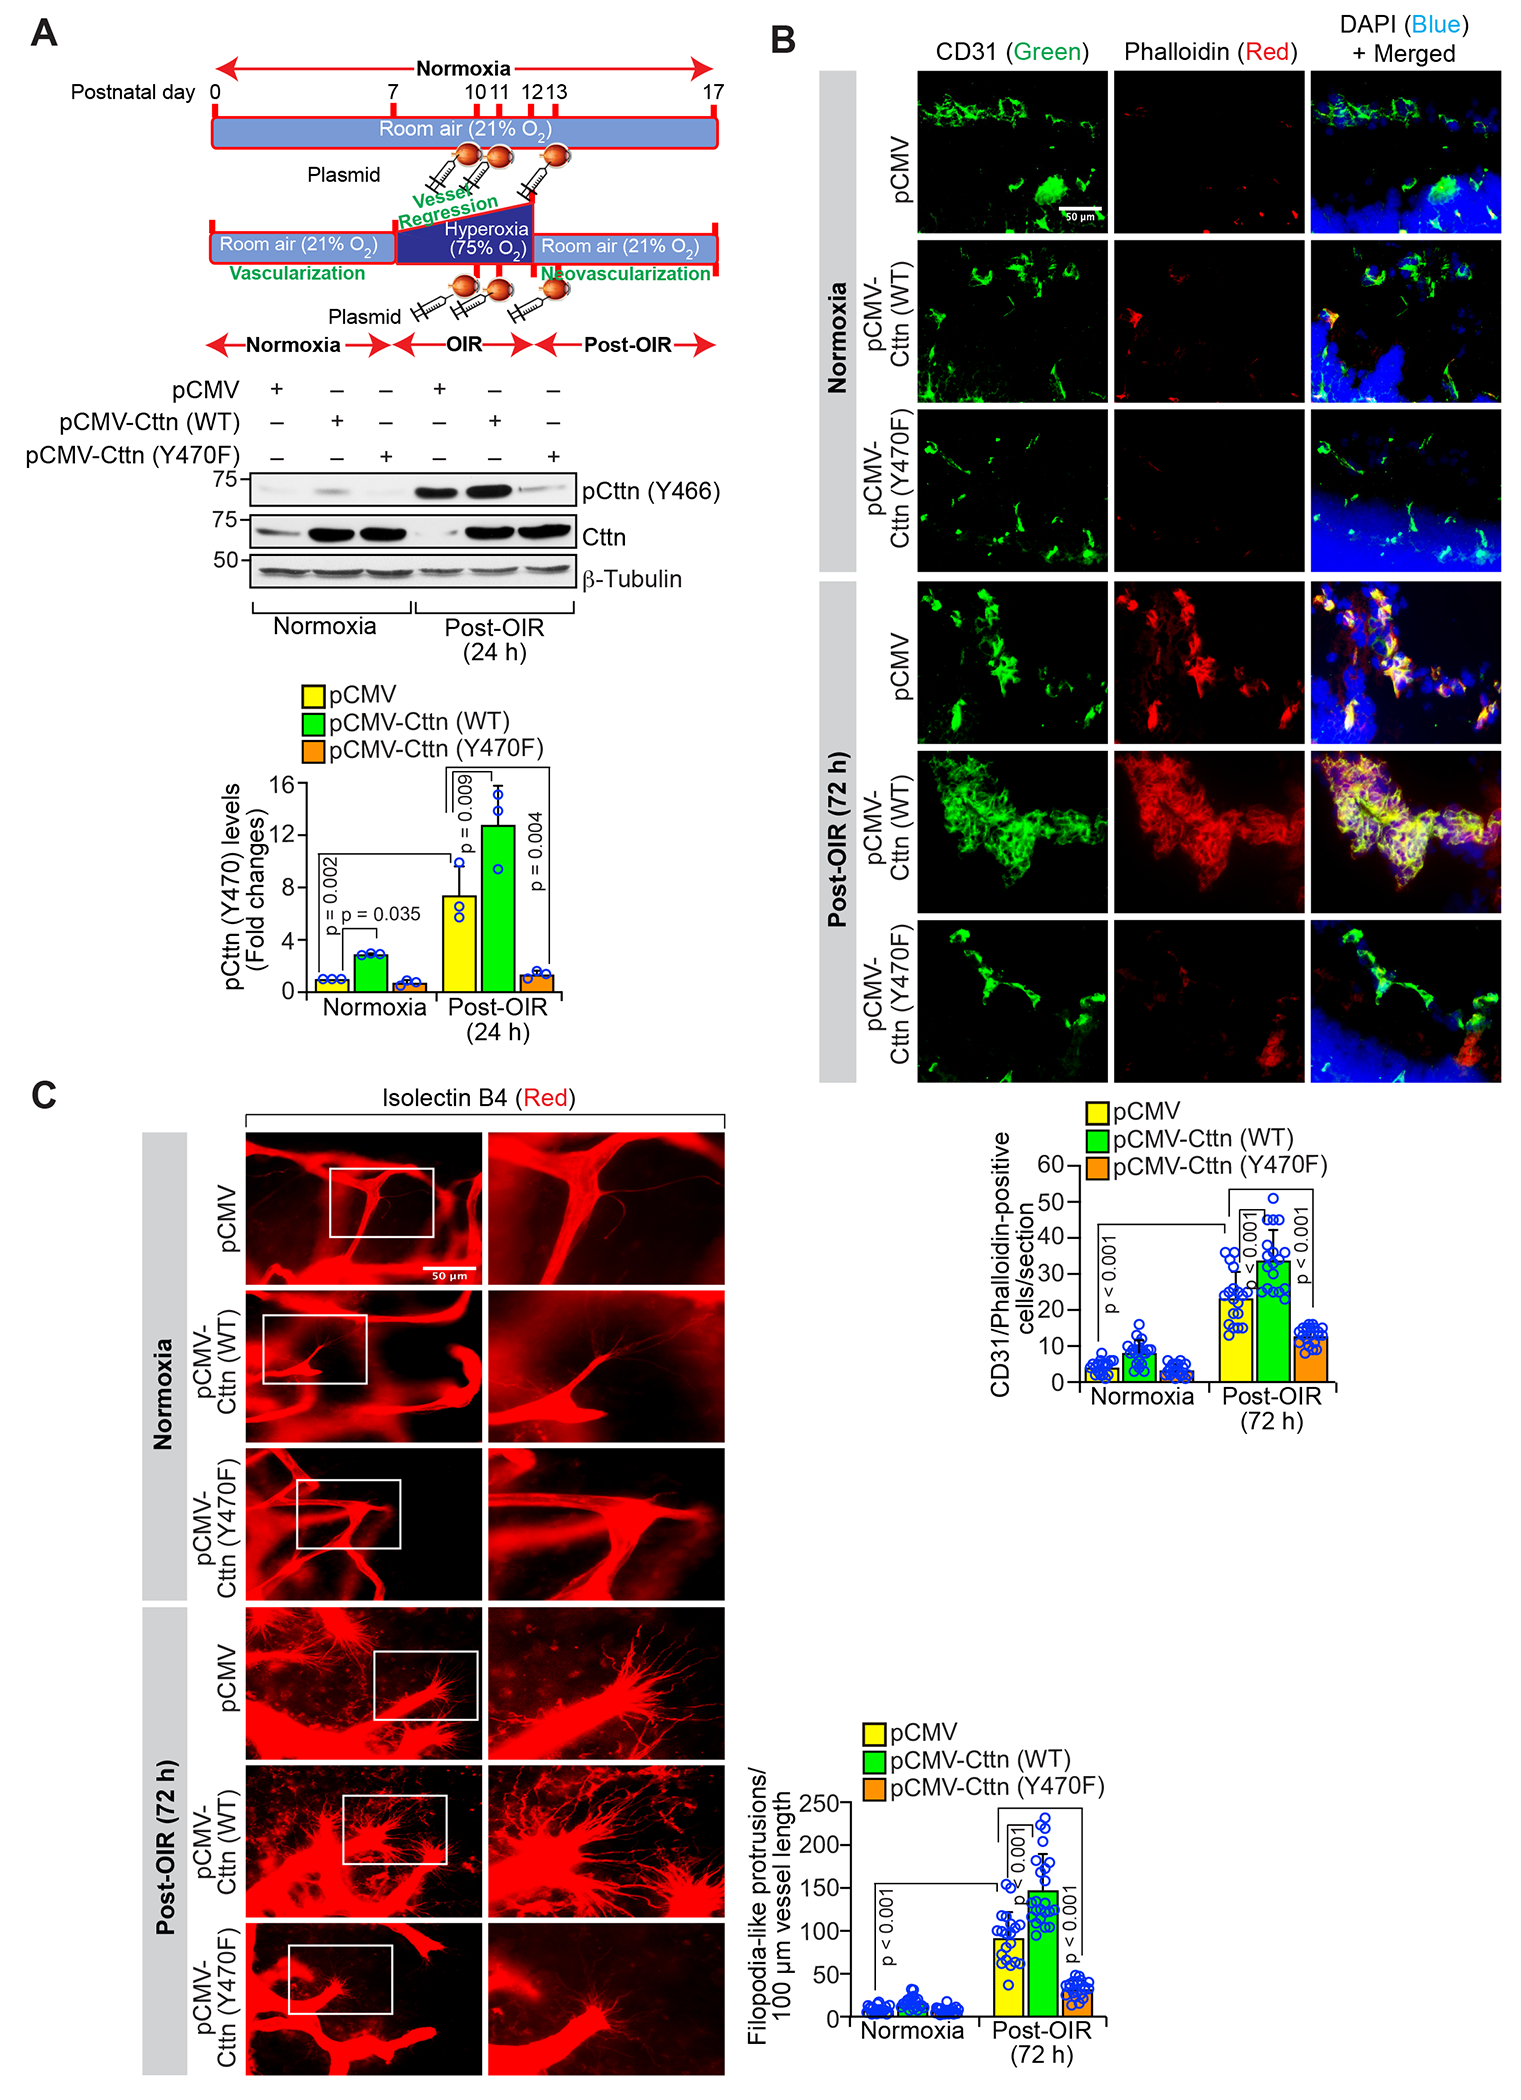
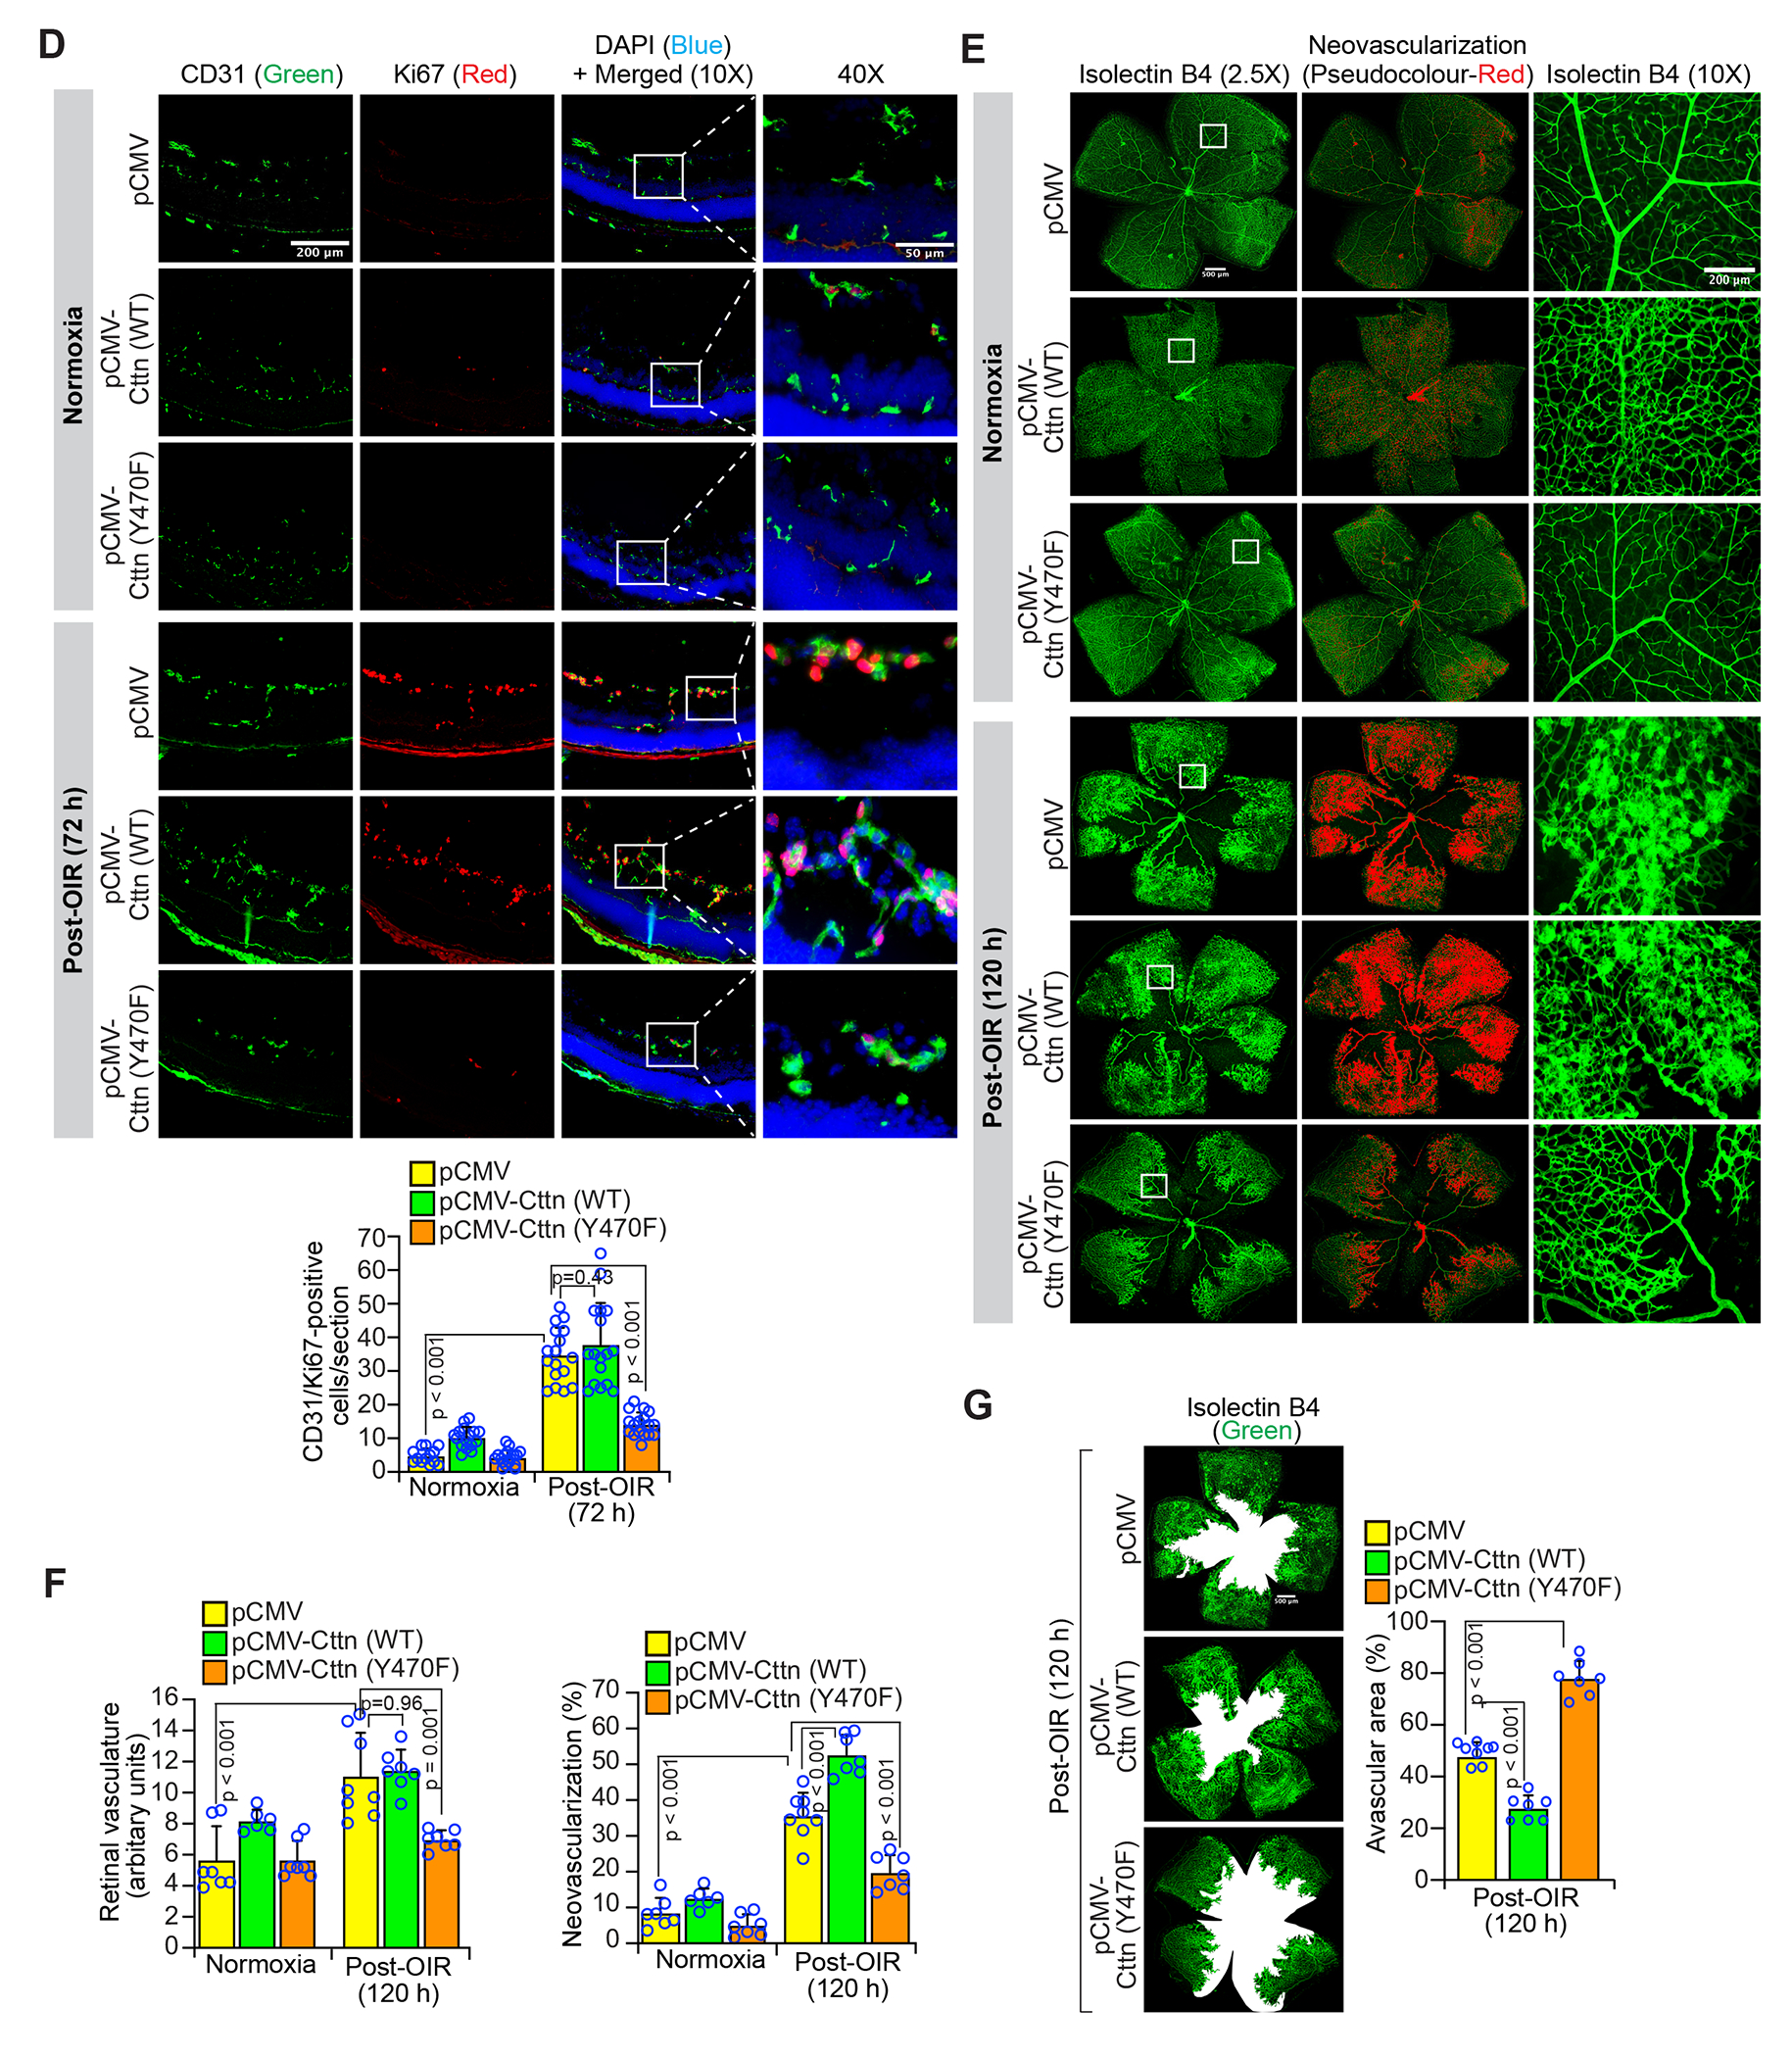
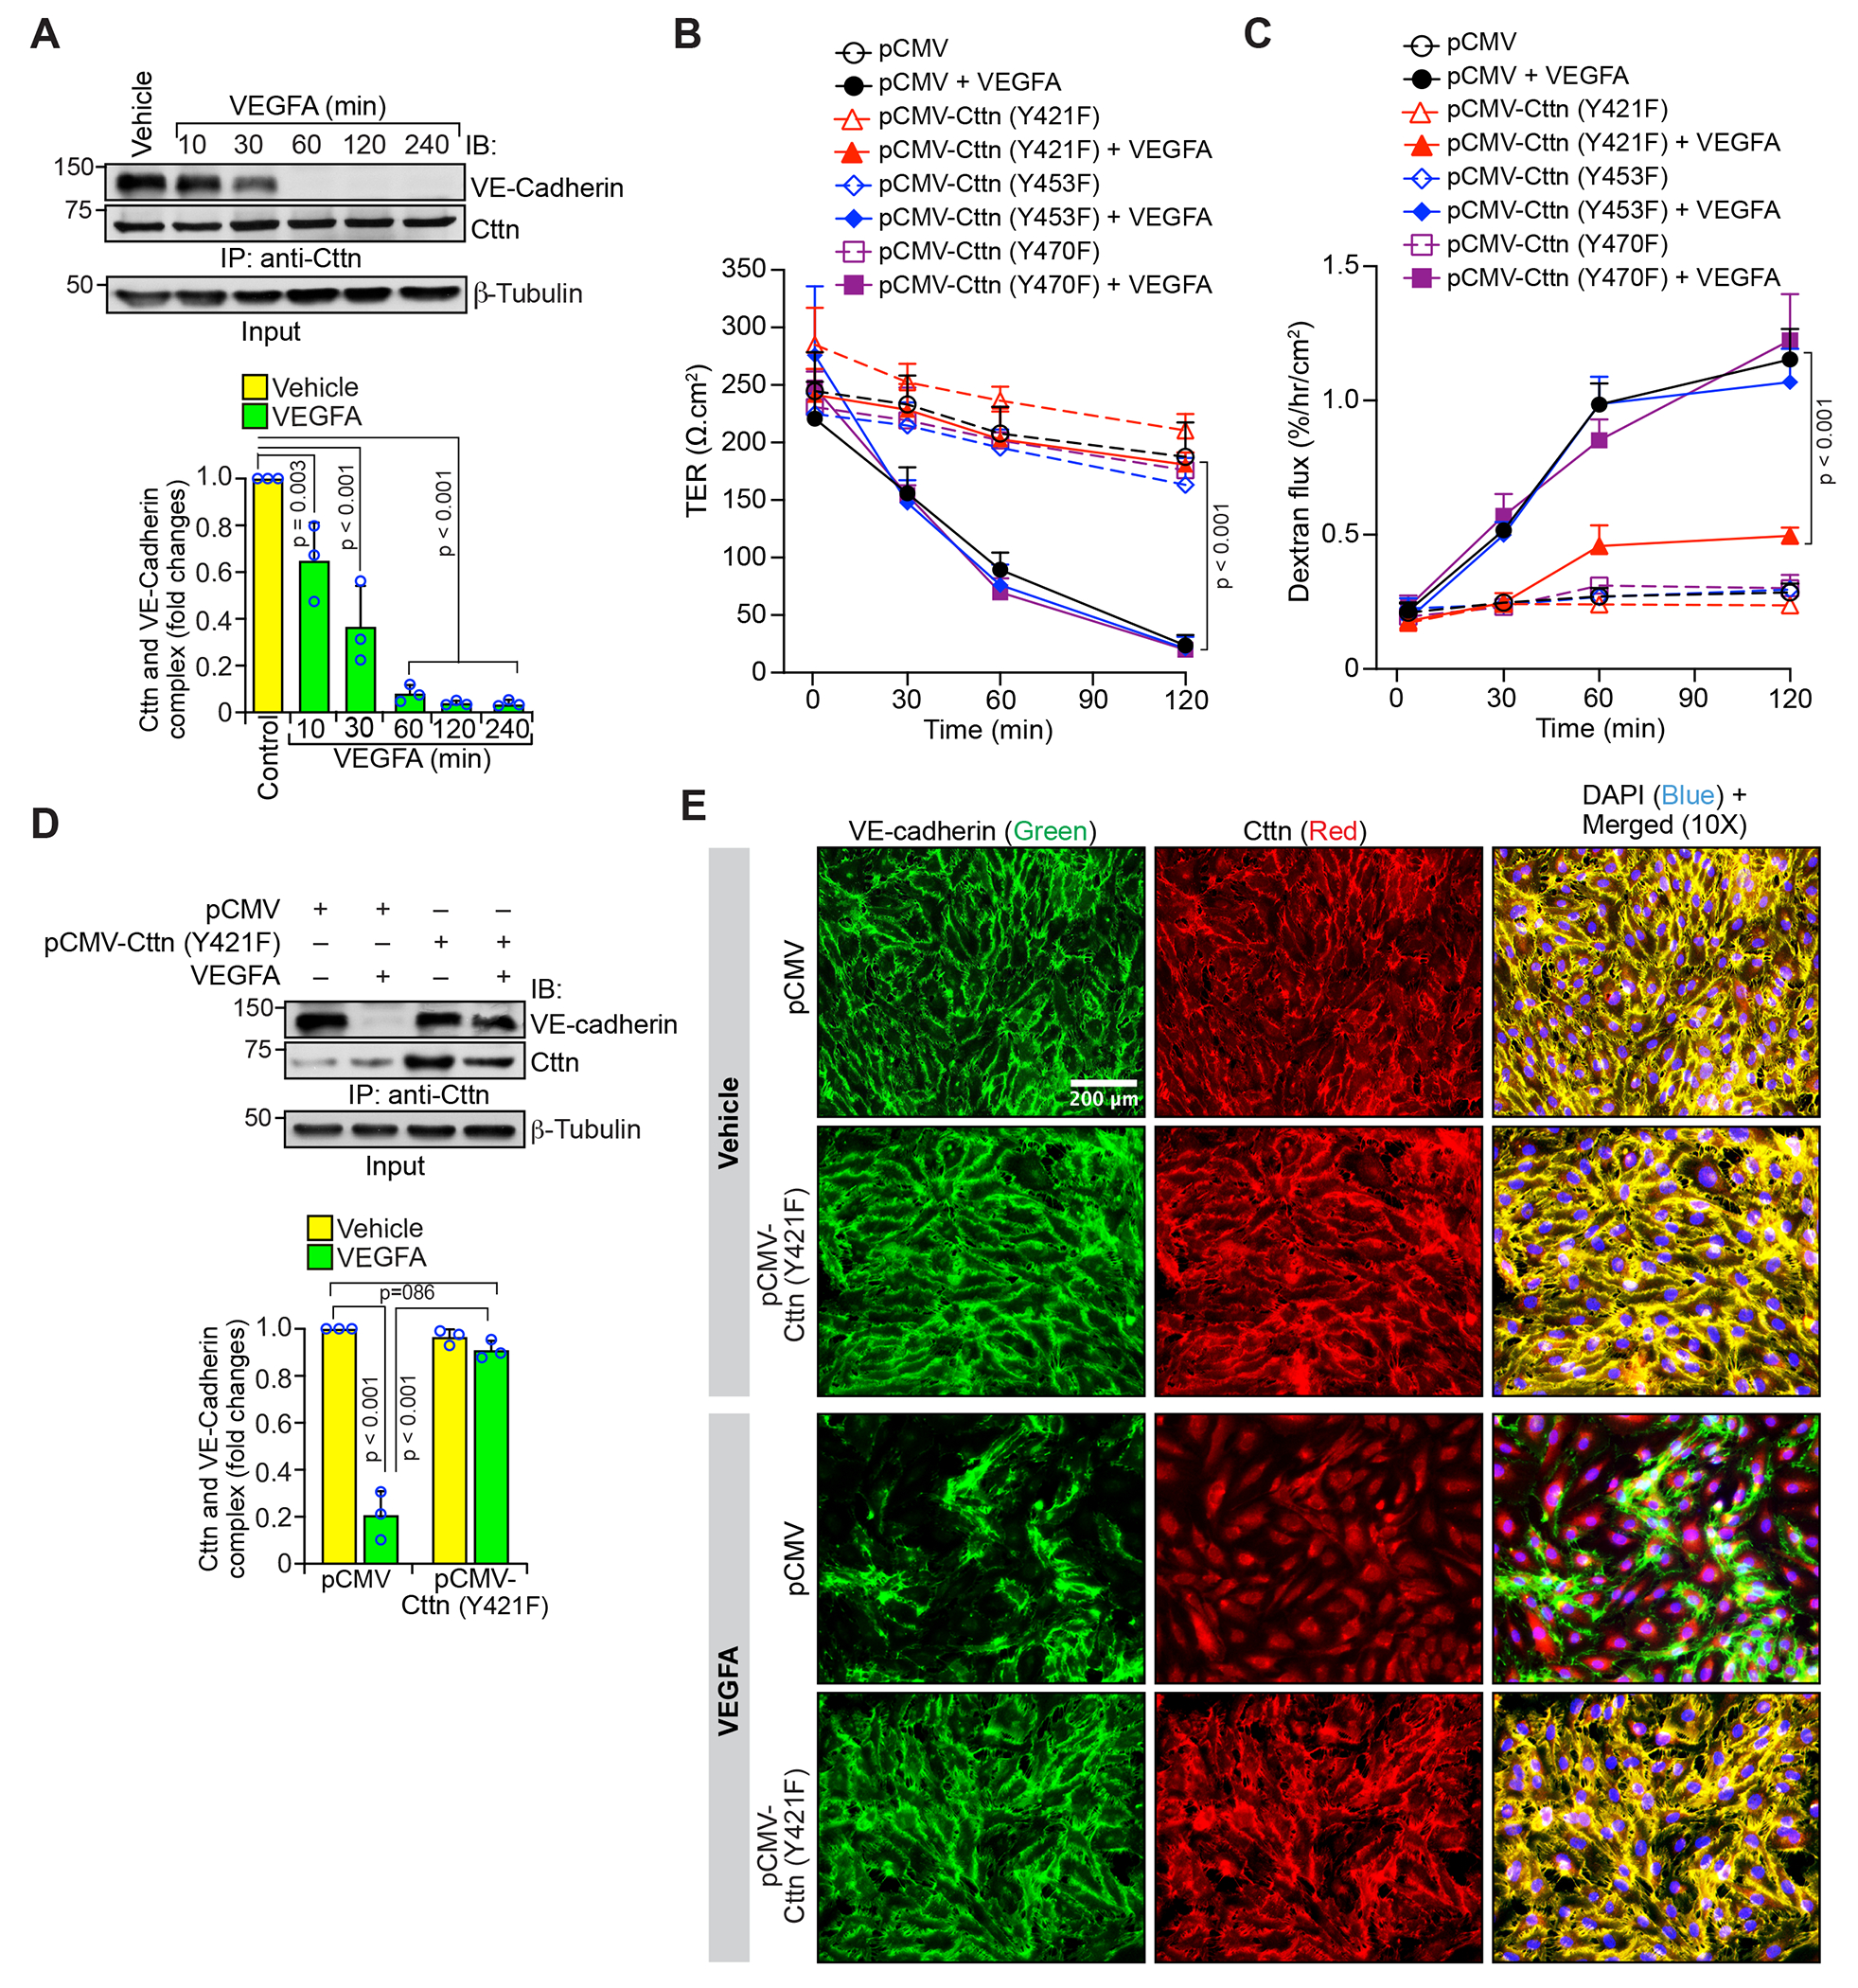
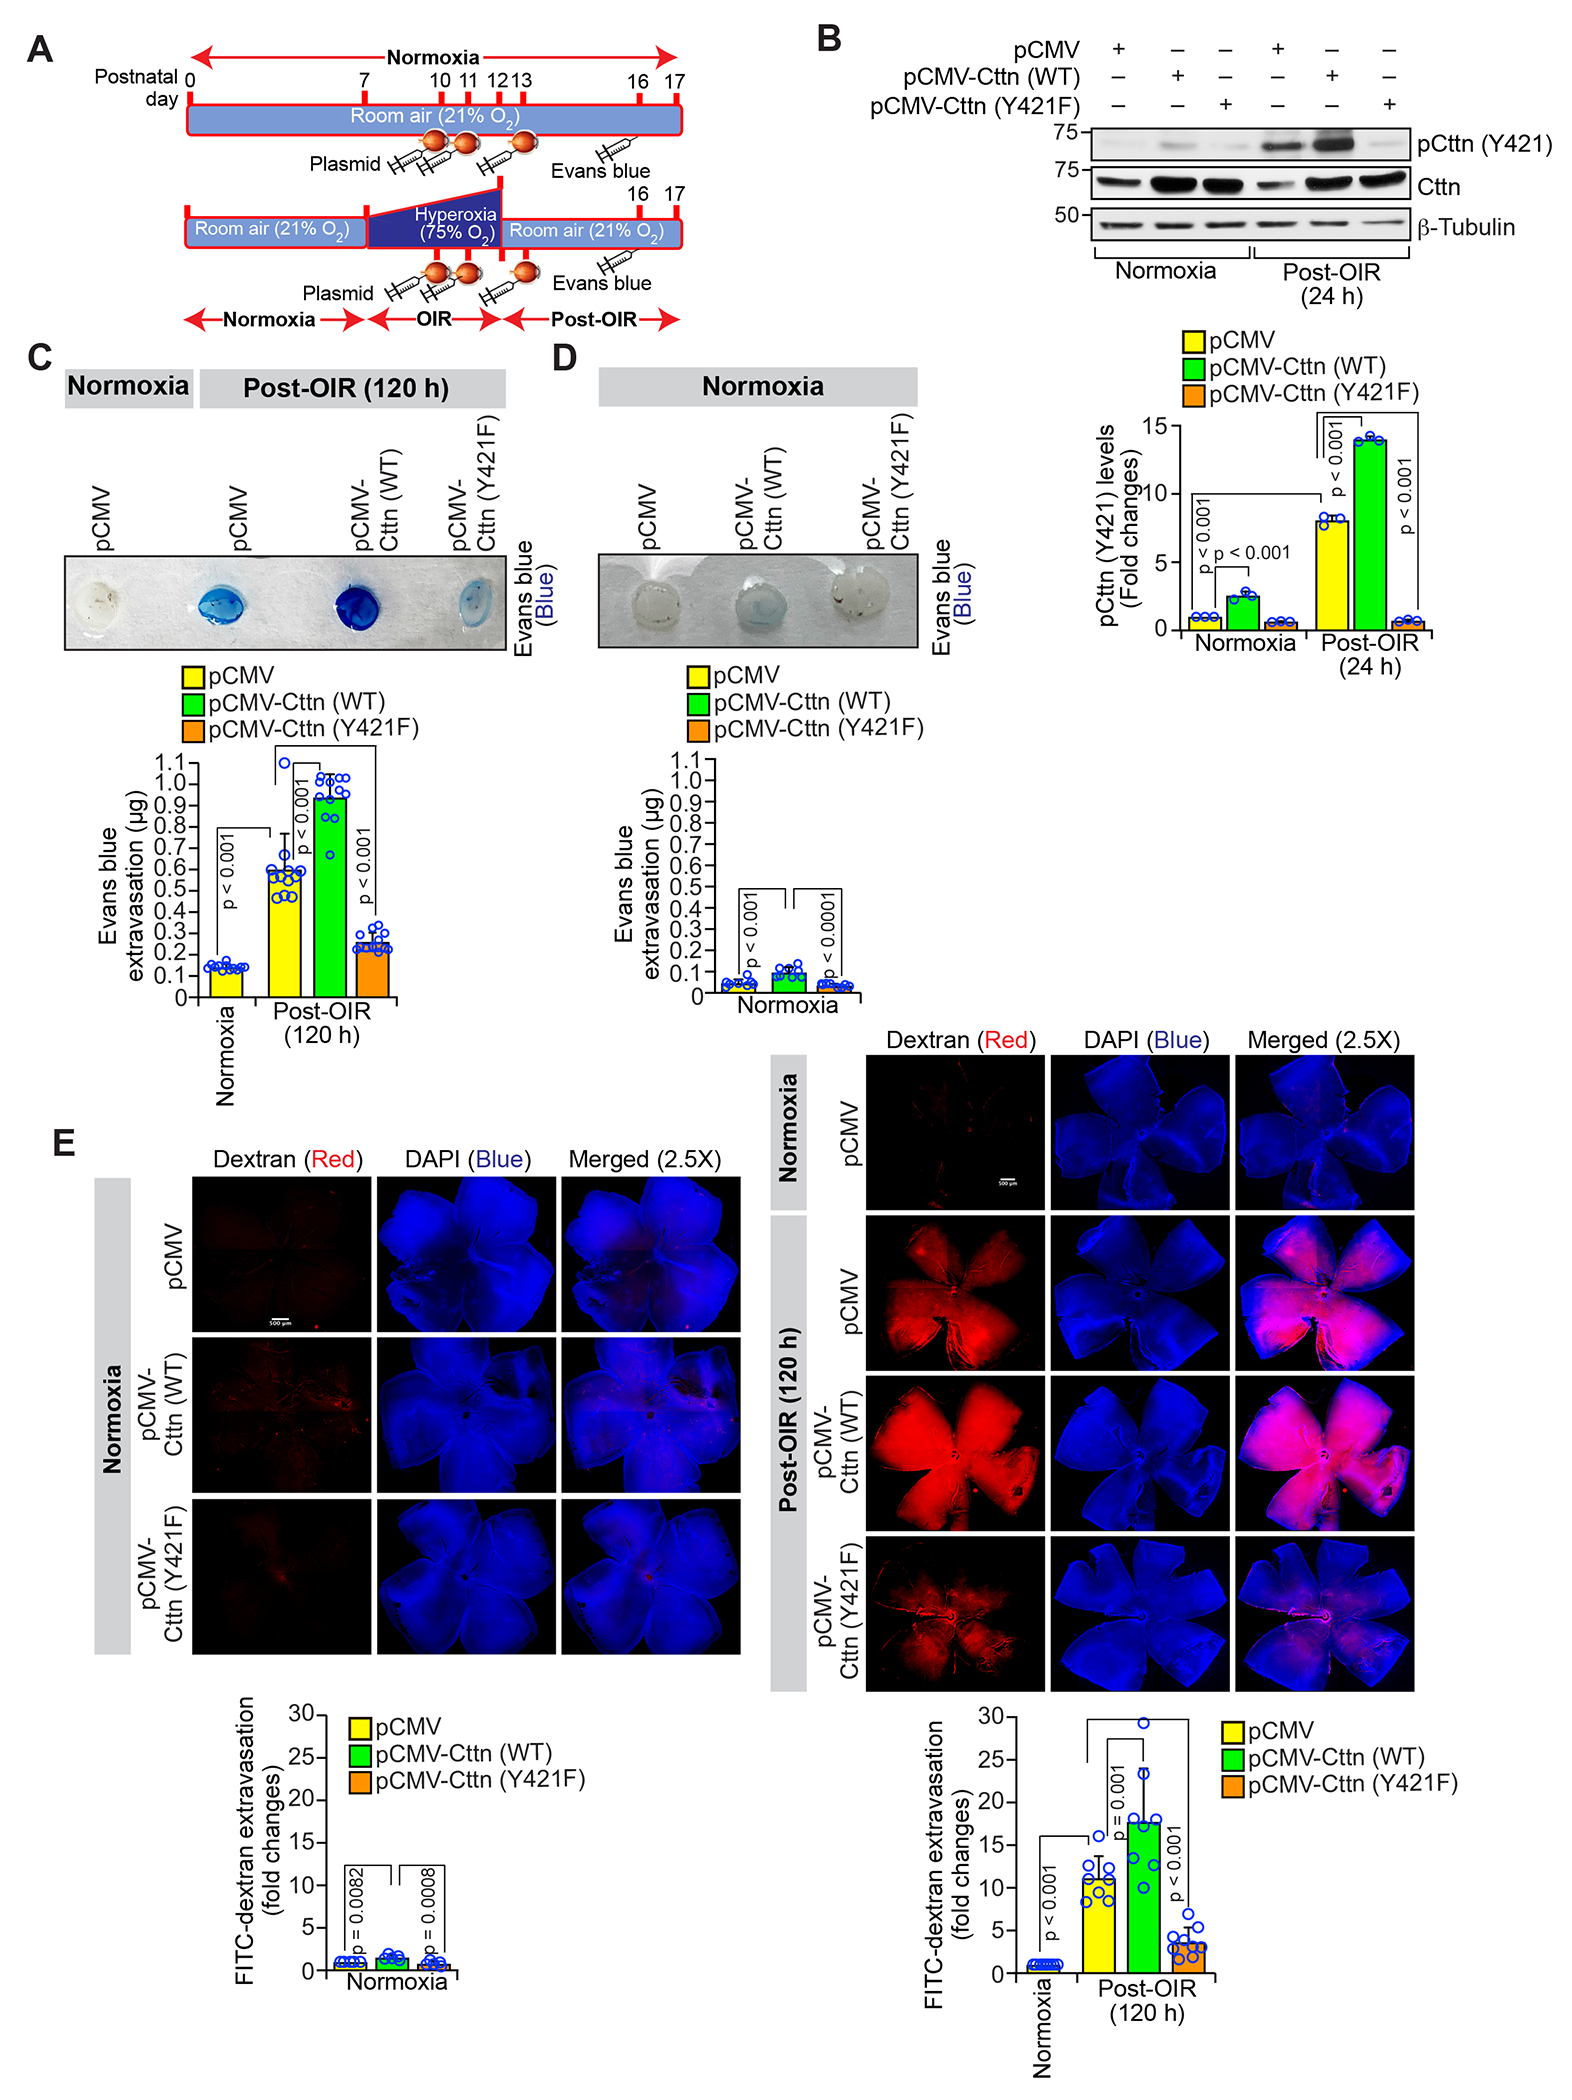
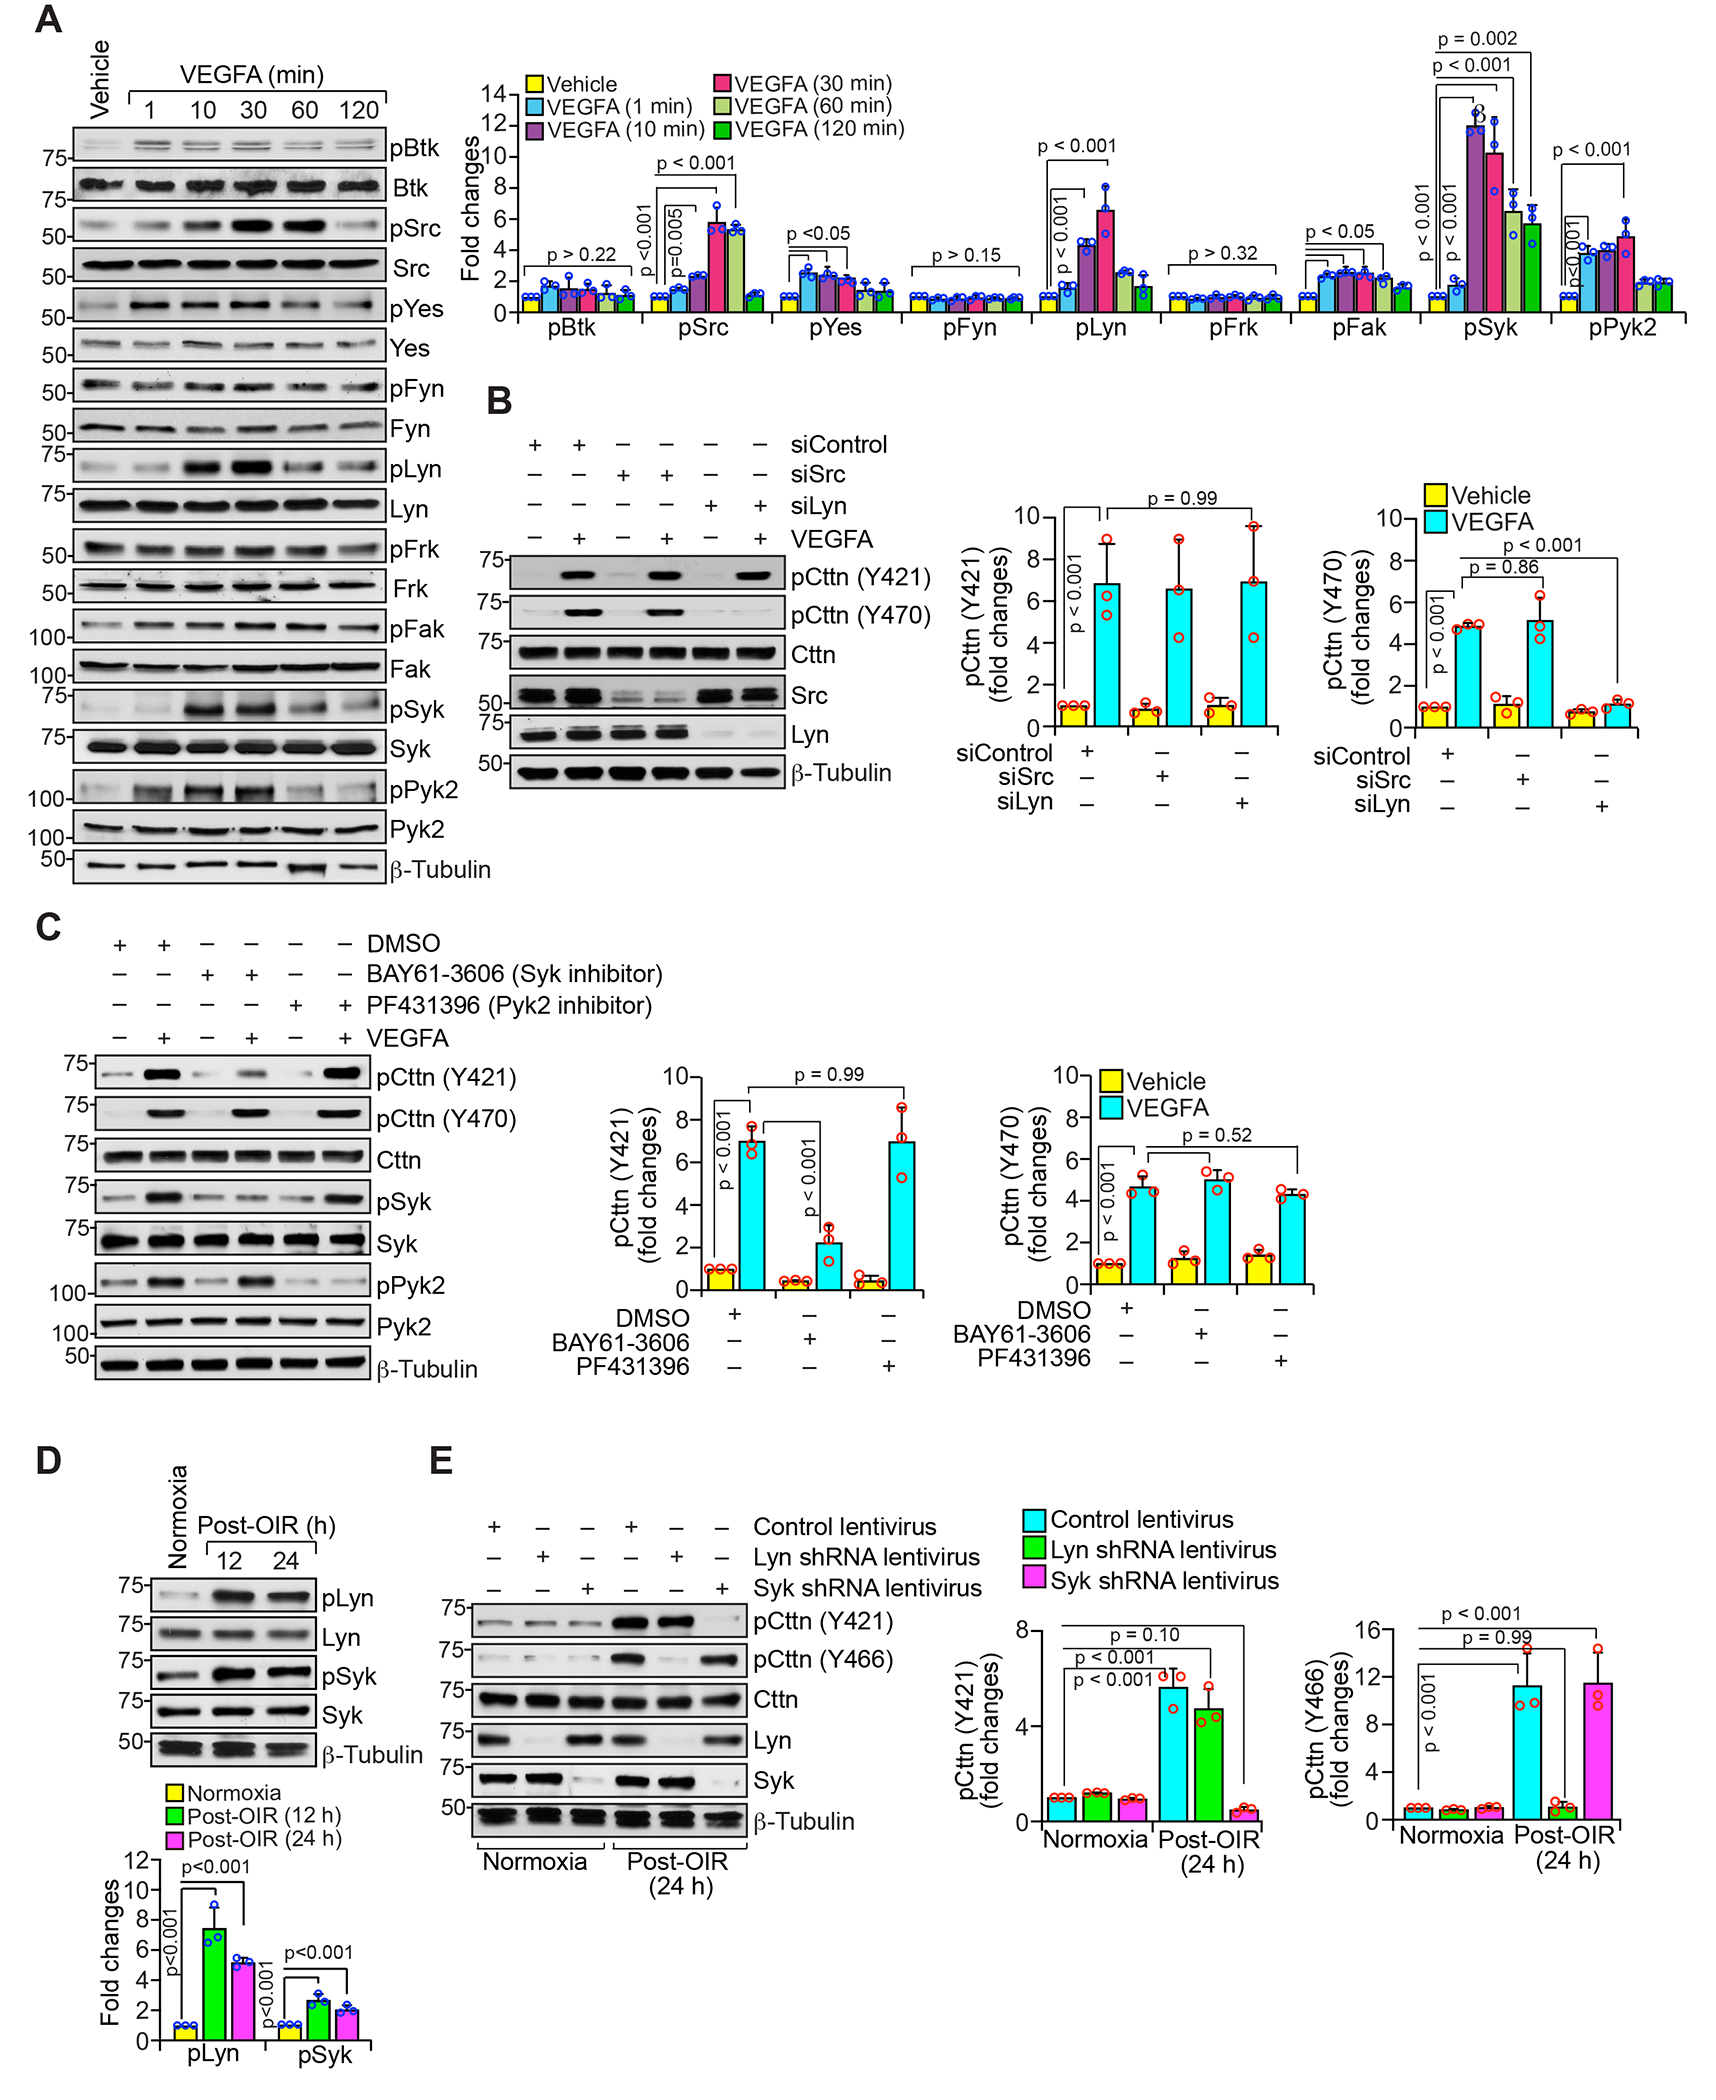
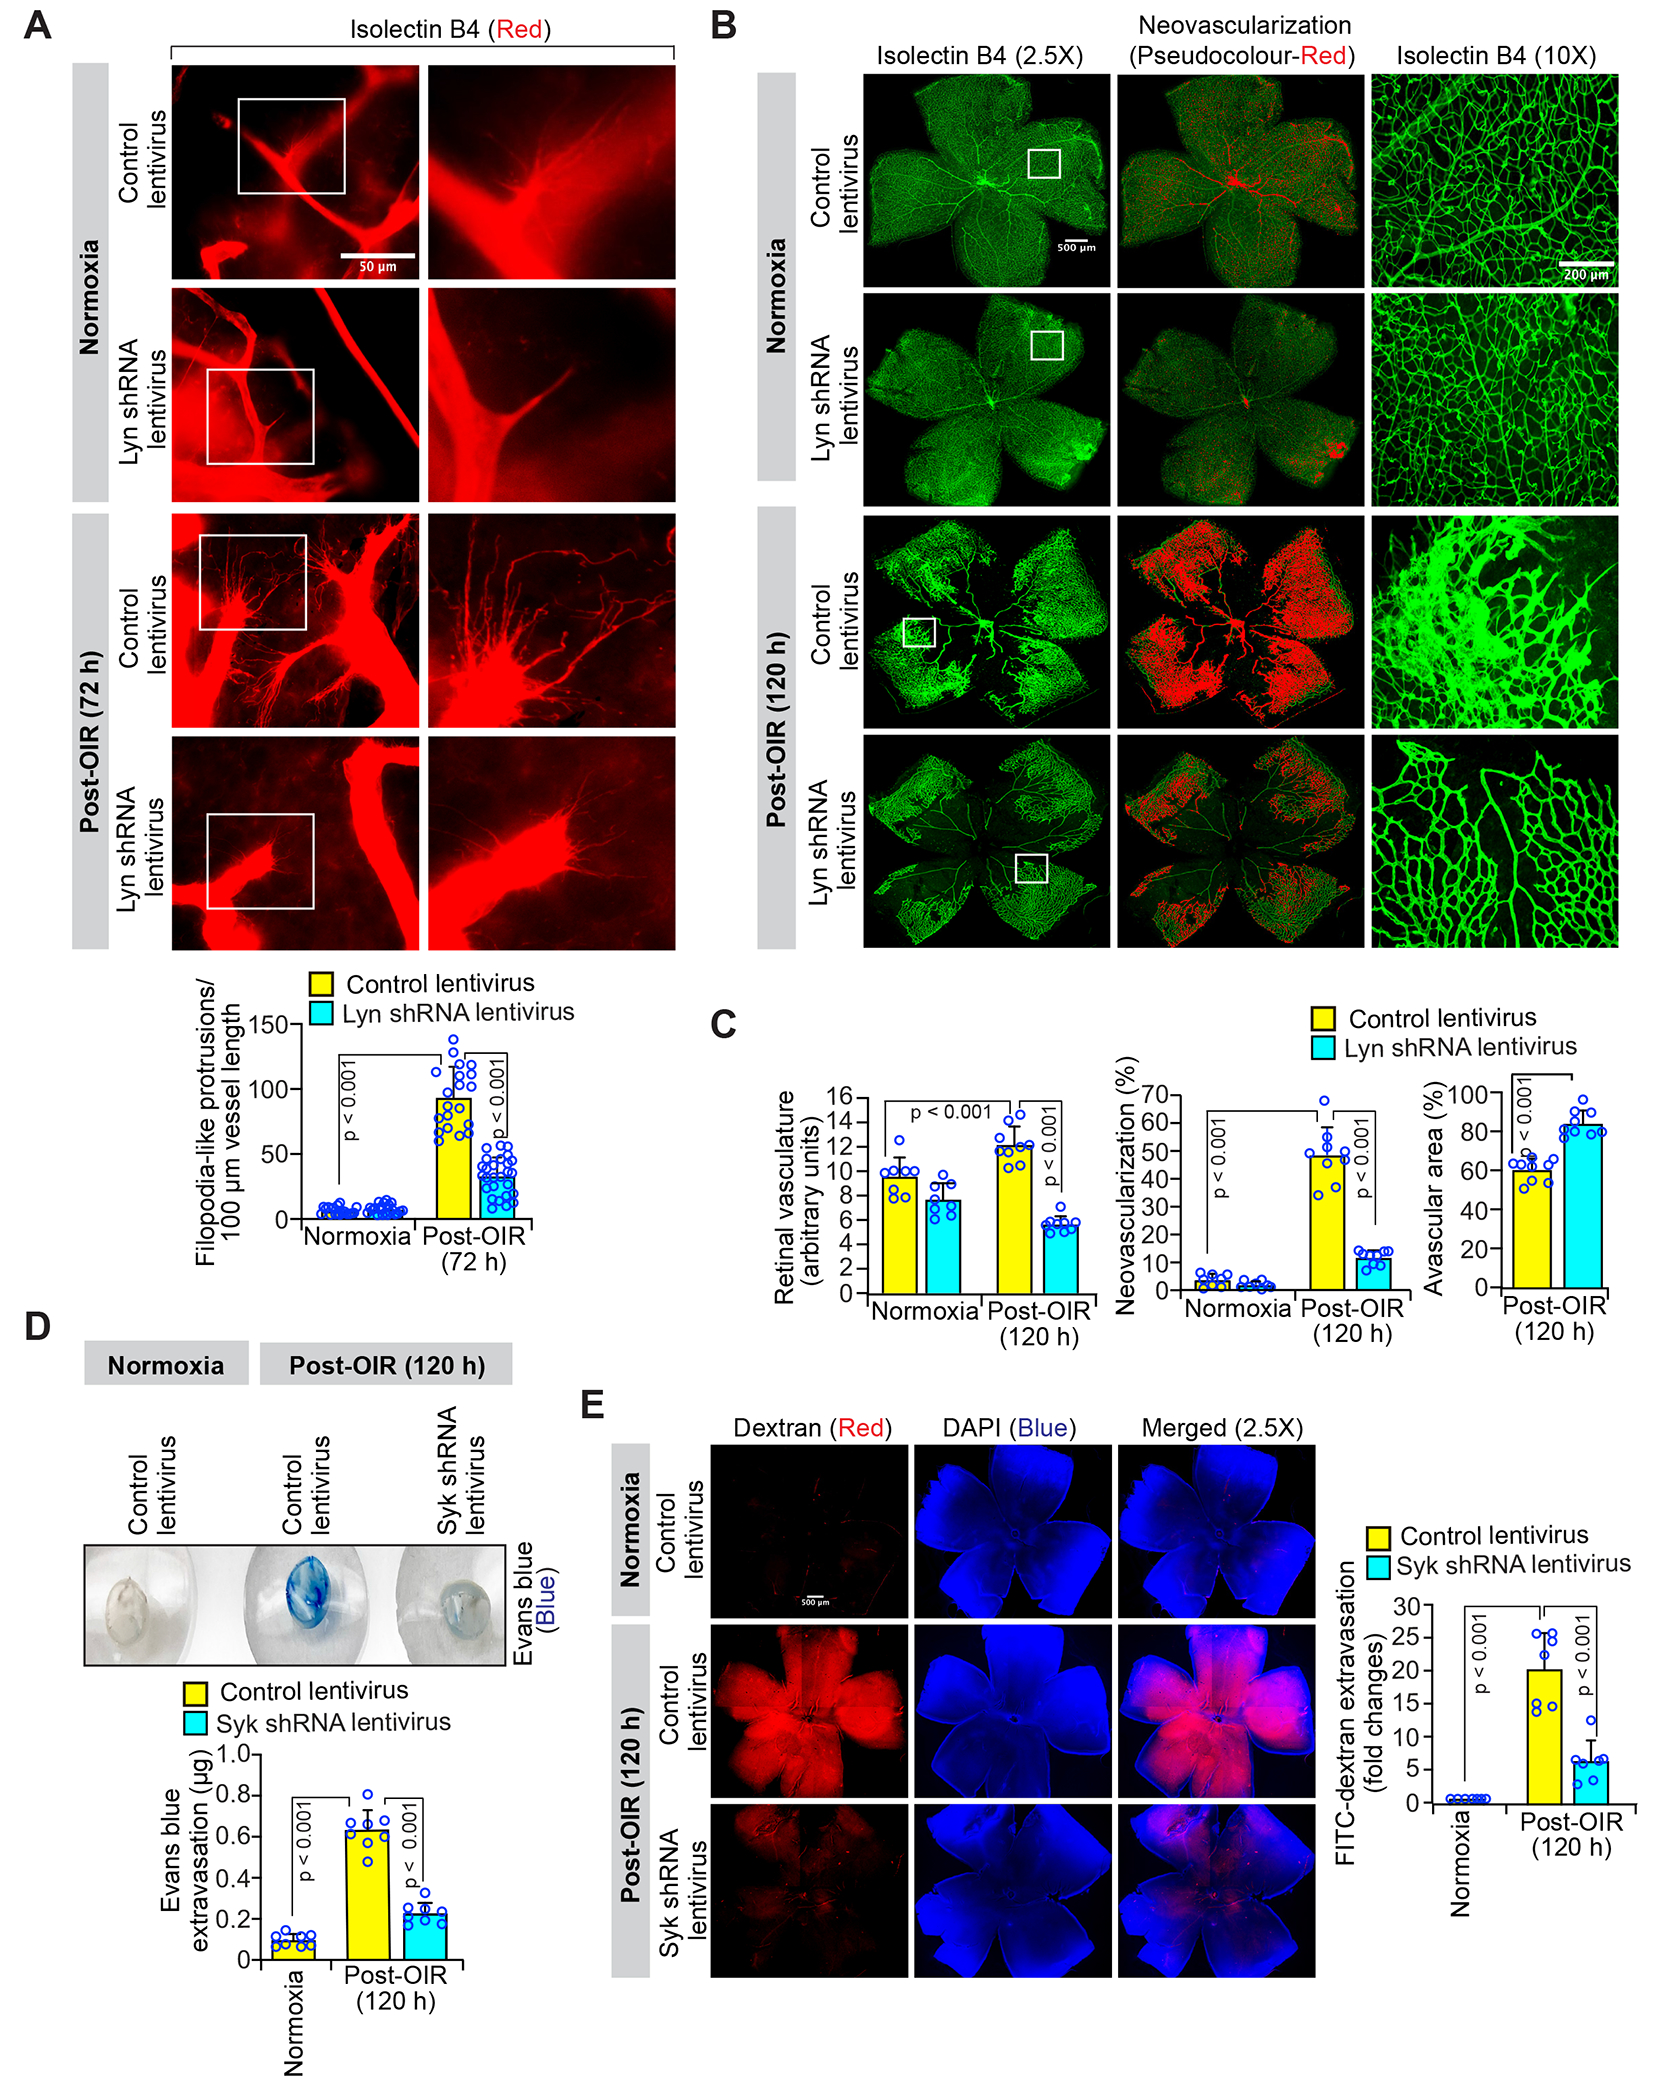
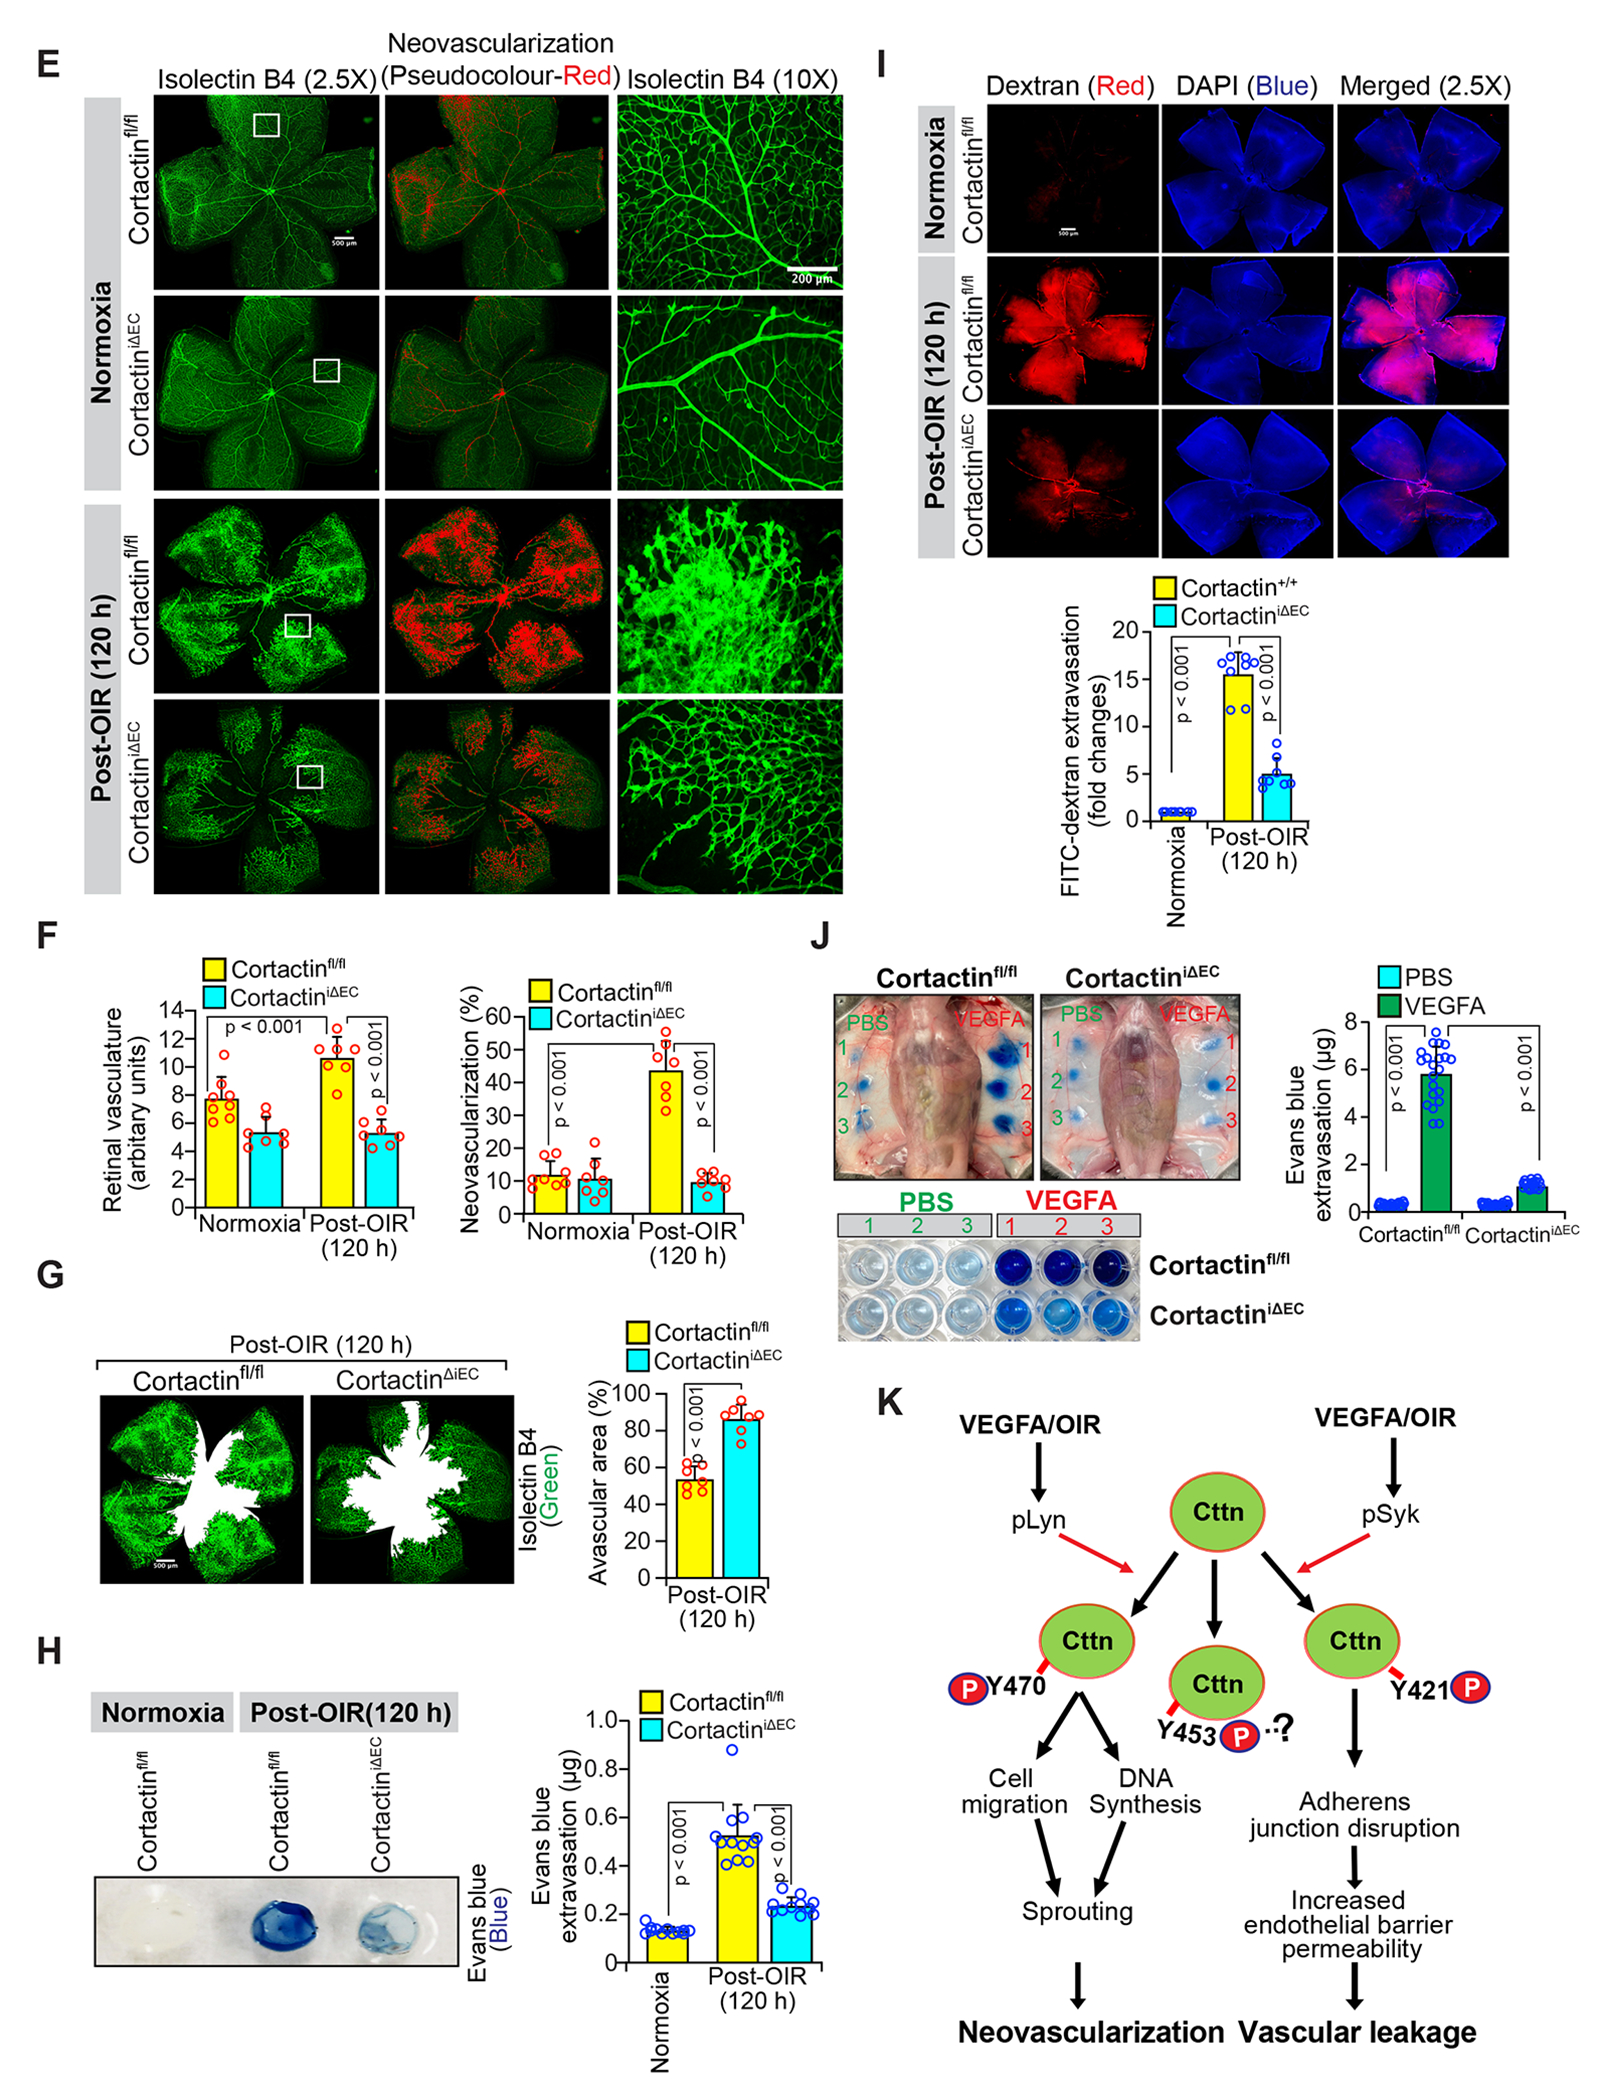
Results: We found that VEGFA (vascular endothelial growth factor A) stimulates Cttn phosphorylation at Y421, Y453, and Y470 residues in human retinal microvascular endothelial cells. In addition, we observed that while blockade of Cttn phosphorylation at Y470 inhibited VEGFA-induced human retinal microvascular endothelial cell angiogenic events, suppression of Y421 phosphorylation protected endothelial barrier integrity from disruption by VEGFA. In line with these observations, while blockade of Cttn phosphorylation at Y470 negated oxygen-induced retinopathy-induced retinal neovascularization, interference with Y421 phosphorylation prevented VEGFA/oxygen-induced retinopathy-induced vascular leakage. Mechanistically, while phosphorylation at Y470 was required for its interaction with Arp2/3 and CDC6 facilitating actin polymerization and DNA synthesis, respectively, Cttn phosphorylation at Y421 leads to its dissociation from VE-cadherin, resulting in adherens junction disruption. Furthermore, whereas Cttn phosphorylation at Y470 residue was dependent on Lyn, its phosphorylation at Y421 residue required Syk activation. Accordingly, lentivirus-mediated expression of shRNA targeting Lyn or Syk levels inhibited oxygen-induced retinopathy-induced retinal neovascularization and vascular leakage, respectively.

Conclusions: The above observations show for the first time that phosphorylation of Cttn is involved in a site-specific manner in the regulation of retinal neovascularization and vascular leakage. In view of these findings, Cttn could be a novel target for the development of therapeutics against vascular diseases such as retinal neovascularization and vascular leakage.

Keywords: cortactin; endothelial cells; neovascularization; vascular endothelial growth factor; vascular leakage.


Conflict of interest statement

Disclosures None.

Figures

Figure 1:
Figure 1:. VEGFA-induced actin polymerization requires cortactin phosphorylation at Y470 residue.
A. Quiescent HRMVECs were treated with vehicle or VEGFA (40 ng/ml) for the indicated time points, and equal amounts of protein from control and each treatment were immunoprecipitated with anti-cortactin antibody, followed by analysis of immunocomplexes by WB using pTyr antibody. The blot was normalized for cortactin total protein. B. HRMVECs that were transfected with empty vector or the indicated Cttn phospho Tyr mutant vector were synchronized, treated with vehicle or VEGFA for 30 min, and equal amounts of protein from control and each treatment immunoprecipitated with anti-cortactin antibody. The immunocomplexes were analyzed by WB using pTyr antibody, and the blot was normalized for cortactin. The Input proteins in both panels A and B were analyzed by WB for β-tubulin. C. HRMVECs were transfected with pCMV Cttn-WT, or pCMV Cttn-Y421F or pCMV Cttn-Y453F or pCMV Cttn-Y470F expression vectors, quiesced, treated with VEGFA for 30 min, followed by preparation of respective cell extracts. The cell extracts containing equal amounts of protein from each regimen were immunoprecipitated with anti-cortactin antibody, and the immunocomplexes subjected to actin polymerization assay as described in Materials and Methods. D. HRMVECs were transfected with pCMV or pCMV Cttn-WT, or pCMV Cttn-Y421F or pCMV Cttn-Y453F or pCMV Cttn-Y470F expression vectors, quiesced, treated with vehicle or VEGFA for 2 h and stained with Phalloidin (scale bar, 50 μm). E. HRMVECs were transfected with pCMV Cttn-WT or pCMV Cttn-Y470F expression vectors, quiesced, treated with and without VEGFA for 30 min, and cell extracts prepared. Equal amounts of protein from control and VEGFA-treatment were immunoprecipitated with anti-cortactin antibody, and the immunocomplexes analyzed by WB for the indicated proteins using their specific antibodies. F. Quiescent HRMVECs were treated with and without VEGFA for 30 min and cell extracts were prepared. Equal amounts of protein from control and VEGFA treatment were immunoprecipitated with anti-cortactin antibody, and the immunocomplexes subjected to an actin polymerization assay in the presence or absence of Arp2/3 inhibitor, CK666 (50 μM). The bar graphs represent quantitative analyses of three biological replicates and the values are presented as Mean ± SD. The data were analyzed by 1-way ANOVA and the statistical significance was represented by p. In Figure 1C and 1F, the values at the end time points were used to determine the p values.
Figure 2:
Figure 2:. VEGFA-induced HRMVEC migration, proliferation, sprouting and tube formation require cortactin phosphorylation at Y470 residue.
A. HRMVECs that were transfected with empty vector or the indicated cortactin expression vector were synchronized and subjected to VEGFA-induced migration (A), proliferation (B), sprouting (C), or tube formation (D) assays. Bar graphs represent quantitative analyses, and the values are presented as means ± SD. The scale bar in panel C is 200 μm. The scale for panels A and D is 1 mm from the extreme left to the extreme right for each image. The WB analysis in the bottom of panel A shows overexpression of WT and the indicated phospho Tyr mutant of cortactin in HRMVECs. The bar graphs represent quantitative analyses of three biological replicates and the values are presented as Mean ± SD. The data were analyzed by 1-way ANOVA and the statistical significance was represented by p.
Figure 3:
Figure 3:. OIR-induced retinal neovascularization requires cortactin phosphorylation at Y470 residue.
A. Upper panel: Schematic diagram of oxygen-induced retinopathy (OIR) induction and the time of intravitreal injections of plasmid DNAs into mouse pups. Lower panel: WT mouse pups with dams were housed in normoxia or in a hyperoxia chamber (75% O2) from P7 to P12. At P10 and P11, the normoxic and hyperoxic mouse pups were intravitreally injected with pCMV or pCMV-Cttn (WT) or pCMV-Cttn (Y470F) plasmid DNA (1 μg/0.5 μl/eye/injection) and the eyes from normoxic and 24-h of post-OIR pups (P13) were enucleated and retinal extracts prepared. Equal amounts of protein from retinal extracts were analyzed by WB for Cttn Y466 phosphorylation using its phospho-specific antibody, and blot was reprobed for total cortactin and β-tubulin. B. Normoxic and hyperoxic mouse pups were injected intravitreally with 1 μg/0.5 μl/eye/injection of pCMV or pCMV-Cttn (WT) or pCMV-Cttn (Y470F) plasmid DNA at P10, P11 and P13 and at 72-h of post-OIR (P15), the eyes then enucleated, fixed, subjected to cross sections, and stained for CD31 along with Phalloidin (scale bar, 50 μm). C. All the conditions were the same as in panel B except that at 72-h of post-OIR (P15), the eyes were enucleated, fixed, retinas isolated, stained with isolectin B4, flat mounts made and examined for filopodia-like protrusions formation at 40X magnification (scale bar, 50 μm). D. All the conditions were the same as in panel B except that the retinal cross sections were coimmunostained for CD31 and Ki67. Retinal EC proliferation was measured by counting CD31 and Ki67-positive cells that extended anterior to the internal limiting membrane in each section and shown in the bar graph. The scale bars in the far left and far right columns are 200 μm and 50 μm, respectively. E. All the conditions were the same as in panel B except that at 120-h of post-OIR (P17), the eyes were enucleated, fixed, retinas isolated, stained with isolectin B4, and prepared as flat mounts. Retinal vascularization is shown in the first column at 2.5X magnification (scale bar, 500 μm) and neovascularization is highlighted in pseudo red in the second column. The third column shows the selected rectangular areas of the images in the first column at 10X magnification (scale bar, 200 μm). F-G. Retinal vasculature (F, left), retinal neovascularization (F, right panel), and avascular area (G) were determined as described in “Materials and Methods” using the retinal flat mounts that were prepared in panel E. The scale bar in panel G is 500 μm. The OIR experiments in pups were not performed gender-wisely as pups were sexually immature. The bar graphs represent quantitative analyses of at least seven biological replicates and the values are presented as Mean ± SD. The data were analyzed by 1-way ANOVA and the statistical significance was represented by p.
Figure 4:
Figure 4:. VEGFA-induced AJ disruption requires cortactin phosphorylation at Y421.
A. Quiescent HRMVECs were treated with vehicle or VEGFA (40 ng/ml) for the indicated time points, and equal amounts of protein from each regimen were immunoprecipitated with anti-cortactin antibody. The immunocomplexes were analyzed by WB using VE-cadherin antibody, and the blot was normalized to cortactin. B. HRMVECs that were transfected with empty vector or the indicated Cttn pTyr mutant expression vectors were synchronized, treated with vehicle or VEGFA, followed by measurement of TER as described in “Materials and Methods”. C. All the conditions were the same as in panel B except that dextran flux was measured as described in “Materials and Methods.” D. HRMVECs that were transfected with empty vector or pCMV-Cttn (Y421F) expression vector were synchronized, treated with vehicle or VEGFA, and equal amounts of protein from each regimen immunoprecipitated with anti-cortactin antibody. The immunocomplexes were analyzed by WB using VE-cadherin antibody, and the blot was normalized to cortactin. The input proteins in panels A and D were analyzed by WB for β-tubulin. E. All the conditions were the same as in panel D except that the cells were coimmunostained for VE-cadherin and cortactin (scale bar, 200 μm). The bar graphs represent quantitative analyses of three biological replicates and the values are presented as Mean ± SD. The data were analyzed by 1-way ANOVA and the statistical significance was represented by p. In Figure 4B and 4C, the values at the end time points were used to determine the p values.
Figure 5:
Figure 5:. Retinal vascular leakage requires cortactin phosphorylation at Y421 residue.
A. Schematic diagram depicting the time points of intravitreal injections of plasmid DNAs, intraperitoneal injection of EB or intravenous injection of FITC dextran during normoxia and OIR-induction. B. WT mouse pups with dams were housed at normoxia or in a hyperoxia chamber (75% O2) from P7 to P12. At P10 and P11, the normoxic and hyperoxic mouse pups were intravitreally injected with pCMV or pCMV-Cttn (WT) or pCMV-Cttn (Y421F) plasmid DNA (1 μg/0.5 μl/eye/injection), and the eyes from the normoxic and 24-h of post-OIR pups (P13) were enucleated and retinal extracts prepared. Equal amounts of protein from the retinal extracts were analyzed by WB for Cttn Y421 phosphorylation using its phospho-specific antibody and the blot was reprobed for total cortactin and β-tubulin. C & D. All the conditions were the same as in panel B except that the P16 normoxic and 96-h of post-OIR (P16) pups were injected intraperitoneally with EB, and 24-h later, the eyes were enucleated, fixed, retinas isolated, and EB extravasation was measured as described in “Materials and Methods.” E. All the conditions were the same as in panel B, except that the P16 normoxic and 96-h of post-OIR pups were injected intravenously with FITC-dextran via tail vein. 24-h later, the eyes were enucleated, fixed, retinas isolated, subjected to flat mount preparation, placed on a coverslip, and examined under a Zeiss inverted fluorescence microscope (Axiovision Observer.z1) to visualize and quantify FITC-dextran in the retinas. The scale bar in panel E is 500 μm. The OIR experiments in pups were not performed gender-wisely as pups were sexually immature. The bar graphs represent quantitative analyses of at least seven biological replicates and the values are presented as Mean ± SD. The data were analyzed by 1-way ANOVA and the statistical significance was represented by p.
Figure 6:
Figure 6:. Lyn and Syk mediate VEGFA/OIR-induced cortactin phosphorylation at Y470/Y466 and Y421 residues, respectively.
A. Western blot analysis of control and various time points of VEGFA-treated HRMVECs for the indicated proteins. B. HRMVECs that were transfected with siControl or siSrc or siLyn and synchronized were treated with and without VEGFA for 30 min, and equal amounts of protein from control and each treatment were probed by WB for the indicated proteins. C. Quiescent HRMVECs were treated with vehicle or VEGFA in the presence and absence of BAY61-3606 (Syk inhibitor) or PF431396 (Pyk2 inhibitor) for 30 min, and cell extracts were prepared. Equal amounts of protein from the control and each treatment were analyzed by WB for the indicated proteins. D. The proteins from normoxic and the indicated time points of post-OIR pups’ retinas were analyzed by WB for the indicated proteins using their specific antibodies. E. All the conditions were the same as in panel D except that normoxic and hyperoxic mouse pups were injected intravitreally with 106 TU/0.5 μl/eye of control or Lyn or Syk shRNA lentiviral particles at P10. At P13, retinal extracts were prepared and analyzed by WB for the indicated proteins using their specific antibodies. The bar graphs in Figure 6A–C represent quantitative analyses of three biological replicates and the bar graphs in Figure 6D and 6E represent quantitative analyses of pooled retinal extracts from seven biological replicates and the values are presented as Mean ± SD. The data were analyzed by 1-way ANOVA and the statistical significance was represented by p.
Figure 7:
Figure 7:. Lyn and Syk mediate OIR-induced retinal neovascularization and vascular leakage, respectively.
A. WT mouse pups with dams were housed in normoxia or in hyperoxia chamber (75% O2) from P7 to P12. At P10, the normoxic and hyperoxic mouse pups were injected intravitreally with 106 TU/0.5 μl/eye of control or Lyn shRNA lentiviral particles, and the eyes from P15 normoxic and 72-h of post-OIR pups (P15) enucleated and fixed. From these, retinas were then isolated, stained with isolectin B4, and subjected to flat mount preparation followed by examination for filopodia-like protrusions at 40X magnification (scale bar, 50 μm). B. All the conditions were the same as in panel A except that, eyes were enucleated, fixed and subjected to aforementioned protocol at 120-h of post-OIR (P17). Retinal vascularization is shown in the first column at 2.5X magnification (scale bar, 500 μm), and neovascularization is highlighted in pseudocolour (red) in the second column. The third column shows the selected rectangular areas of the images in the first column at 10X magnification (scale bar, 200 μm). C. Retinal vasculature, retinal neovascularization, and avascular area were determined as described in “Materials and Methods” using the retinal flat mounts prepared in panel B. D. All the conditions were the same as in panel A except that at P10, the normoxic and hyperoxic pups were injected intravitreally with 106 TU/0.5 μl/eye of control or Syk shRNA lentiviral particles. The normoxic (P16) and 96-h of post-OIR pups were then injected intraperitoneally with EB and 24 h later, the eyes were enucleated, fixed, their retinas isolated, and EB extravasation measured as described in “Materials and Methods.” E. All the conditions were the same as in panel D except that the normoxic (P16) and 96-h of post-OIR pups were injected intravenously with FITC-dextran via tail vein. Twenty-four hours later, the eyes were enucleated, fixed, followed by isolation of their retinas, preparation of flat mounts and placing onto a coverslip before final examination with a Zeiss inverted fluorescence microscope (Axiovision Observer.z1), to visualize and quantify FITC-dextran in the retinas. The OIR experiments in pups were not performed gender-wisely as pups were sexually immature. The bar graphs represent quantitative analyses of at least seven biological replicates and the values are presented as Mean ± SD. The data were analyzed by 1-way ANOVA and the statistical significance was represented by p.
Figure 8:
Figure 8:. EC-specific conditional deletion of cortactin suppresses OIR-induced retinal neovascularization and vascular leakage.
A. Upper panel: Schematic diagram of Cre activation by tamoxifen both during normoxic and hyperoxic periods in Cortactinflox/flox:Cdh5-CreERT2 mouse pups. Bottom panel: Retinal cross sections from P13 normoxic and 24-h of post-OIR (P13) Cortactinflox/flox and CortactiniΔEC pups were co-immunostained for CD31 and cortactin. The scale bars in the far left and far right columns are 200 μm and 50 μm, respectively. B & D. Retinal cross sections from P15 normoxic and 72-h of post-OIR (P15) Cortactinflox/flox and CortactiniΔEC pups were co-immunostained for CD31 and Phalloidin (B) or CD31 and Ki67 (D). The scale bar in panel B is 50 μm and the scale bars in panel D are 200 μm (far left column) and 50 μm (far right column), respectively. C. Retinas from P15 normoxic and 72-h of post-OIR (P15) Cortactinflox/flox and CortactiniΔEC pups were stained with isolectin B4, and the flat mounts observed for filopodia-like protrusions in the vascular front at 40X magnification (scale bar, 50 μm). E. Retinas from P17 normoxic and 120-h of post-OIR (P17) Cortactinflox/flox and CortactiniΔEC pups were stained with isolectin B4, the flat mounts observed for neovascularization. Retinal vascularization is shown in the first column at 2.5X magnification (scale bar, 500 μm), and neovascularization is highlighted in pseudo red in the second column. The third column shows the selected rectangular areas of the images in the first column at 10X magnification (scale bar, 200 μm). F-G. Retinal vasculature (F, left), retinal neovascularization (F, right), and avascular area (G) were determined as described in “Materials and Methods” using the retinal flat mounts prepared in panel E. H. The normoxic (P16) and 96-h post-OIR (P16) Cortactinflox/flox and CortactiniΔEC pups were injected intraperitoneally with EB and 24 h later, the eyes were enucleated, fixed, retinas isolated, and EB extravasation measured as described in “Materials and Methods.” I. All the conditions were the same as in panel H except that the pups were injected intravenously with FITC-dextran via tail vein. Twenty-four hours later, the eyes were enucleated, fixed, subjected to retina isolation and flat mount preparation before mounting on a coverslip and examination with a Zeiss inverted fluorescence microscope (Axiovision Observer.z1) to visualize and quantify FITC-dextran in the retinas. J. Cortactinflox/flox and CortactiniΔEC mice were injected intravenously with EB via the tail vein and examined for VEGFA-induced vascular permeability as described in “Materials and Methods.” K. Schematic diagram depicting the role of site-specific Tyr phosphorylation of cortactin in retinal neovascularization and vascular leakage. The OIR experiments in pups were not performed gender-wisely as pups were sexually immature. Regarding Miles’ assay in Figure 8J, which was performed in adult mice, no gender differences were observed as analyzed by Student t test at p < 0.05 and therefore the data were combined and presented. The bar graphs represent quantitative analyses of at least seven biological replicates and the values are presented as Mean ± SD. The data in Figure 8A–8F and 8H–8J were analyzed by 1-way ANOVA and the data in Figure 8G were analyzed by Student t test and the statistical significance was represented by p.

Similar articles

Cited by

References

    1. Peto T, Resnikoff S, Kempen JH, Steinmetz JD, Briant PS, Wong TY, Friedman DS, Bron AM, Jonas J, Fernandes A, et al. Diabetic retinopathy contributes to global vision loss. Invest. Ophthalmol. Vis. Sci 2021;62:1139.
    1. World Health Organization. Regional Office for South-East Asia. Strengthening diagnosis and treatment of Diabetic Retinopathy in SEA Region. 2020; Available at: https://apps.who.int/iris/handle/10665/334224 (accessed Apr 17, 2023).
    1. Centers for Disease Control and Prevention. National Diabetes Statistics Report. Atlanta, GA: Centers for Disease Control and Prevention, U.S. Dept of Health and Human Services; 2020; Available at: https://www.cdc.gov/diabetes/pdfs/data/statistics/national-diabetes-stat... (accessed Apr 17, 2023).
    1. International Diabetes Federation. IDF Diabetes Atlas, 10th edn. Brussels, Belgium: 2021; Available at: https://www.diabetesatlas.org (accessed Apr 17, 2023).
    1. Harris NK, Talwar N, Gardner TW, Wrobel JS, Herman WH, Stein JD. Predicting development of proliferative diabetic retinopathy. Diabetes Care. 2013;36:1562–1568. - PMC - PubMed

Publication types

LinkOut - more resources