. 2024 May 7;15(5):364-384.
doi: 10.1093/procel/pwad063.

Aging hallmarks of the primate ovary revealed by spatiotemporal transcriptomics

Affiliations

Aging hallmarks of the primate ovary revealed by spatiotemporal transcriptomics

Huifen Lu et al. Protein Cell. .

Abstract

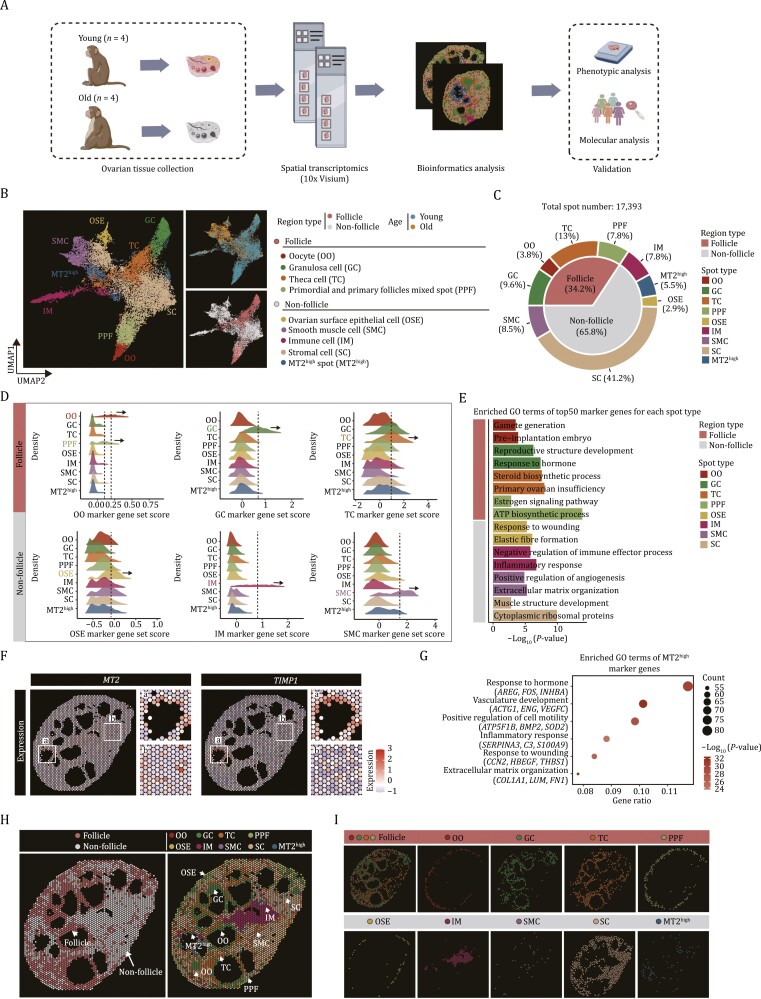
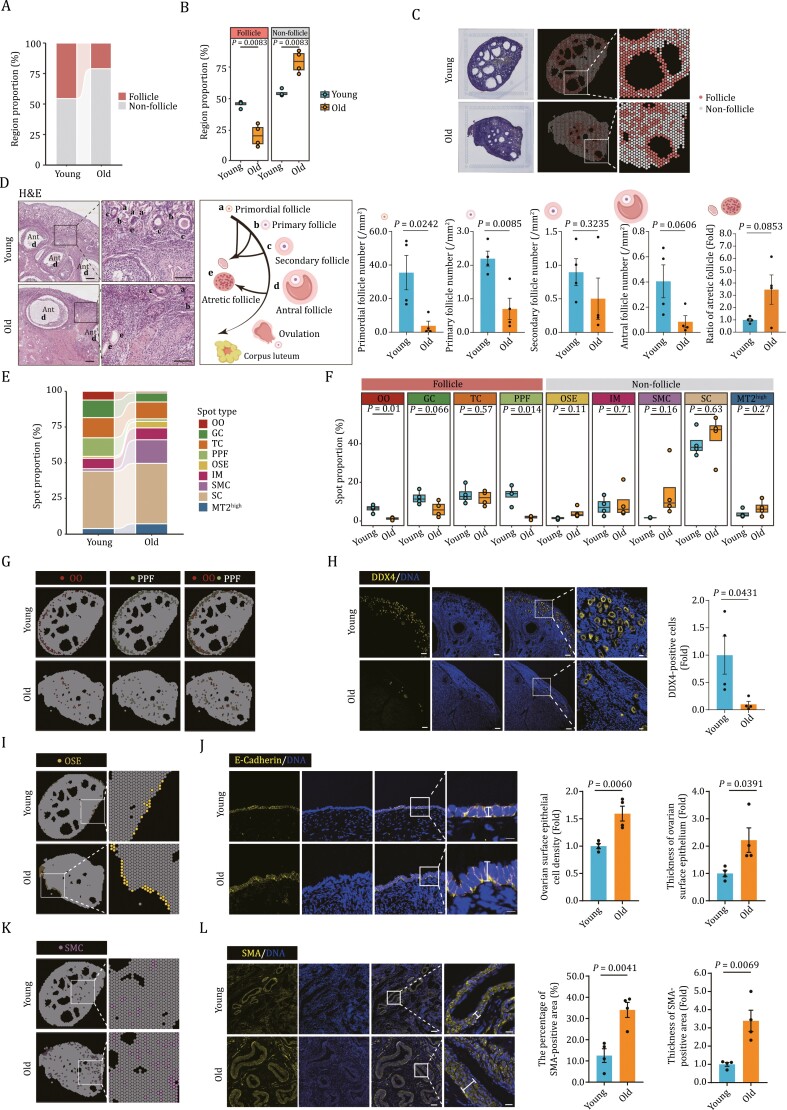
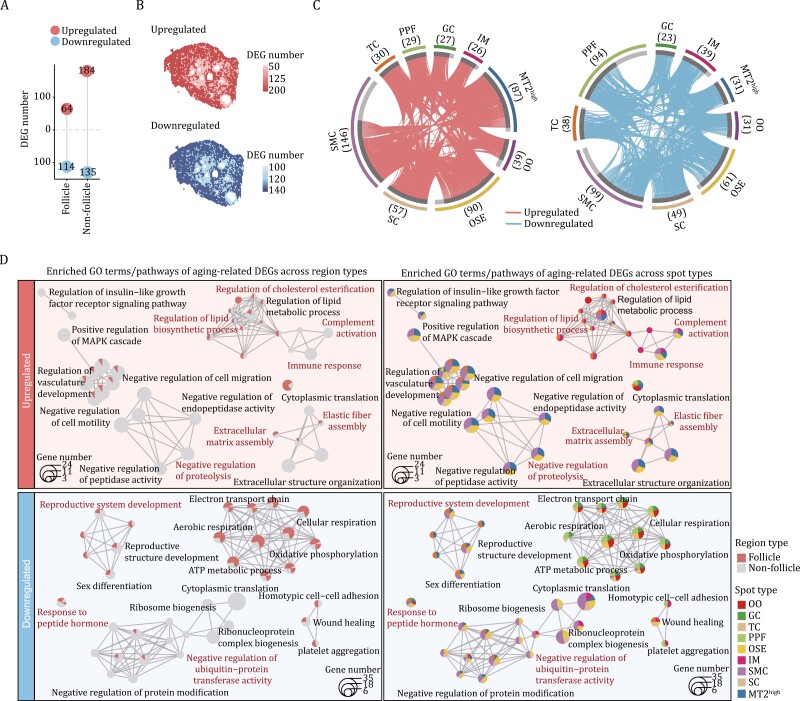
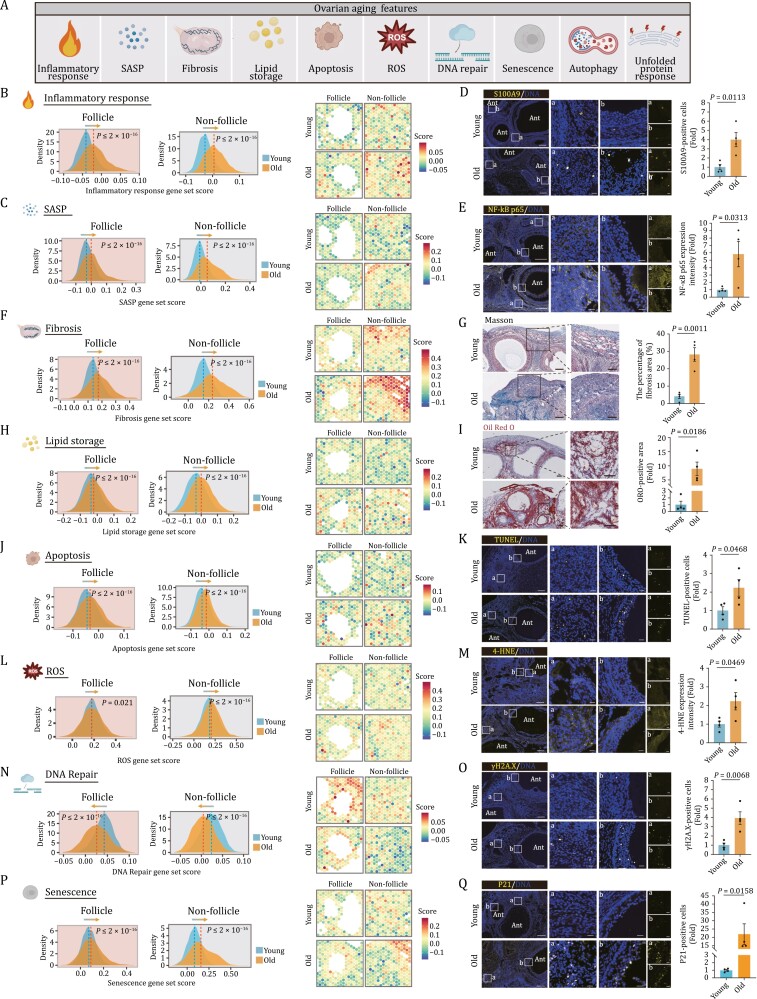
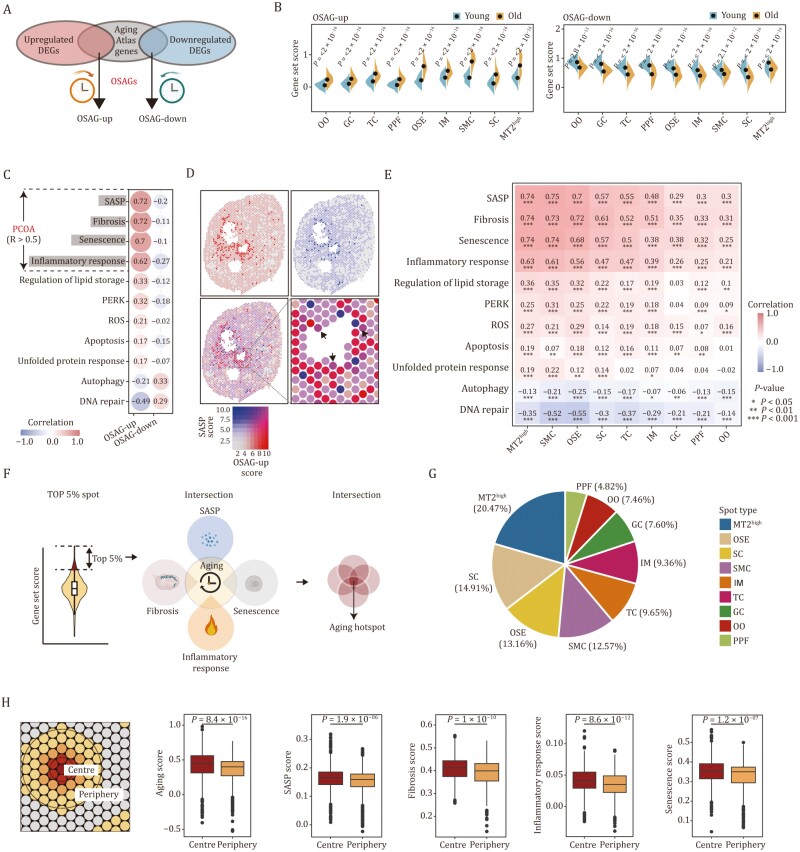
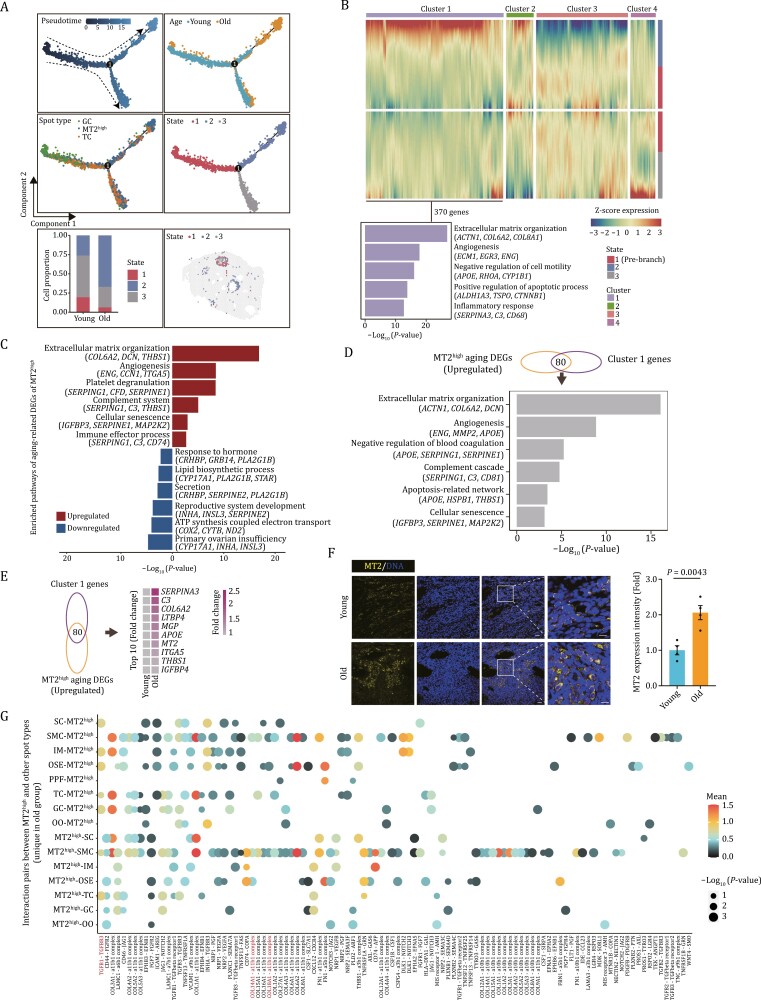
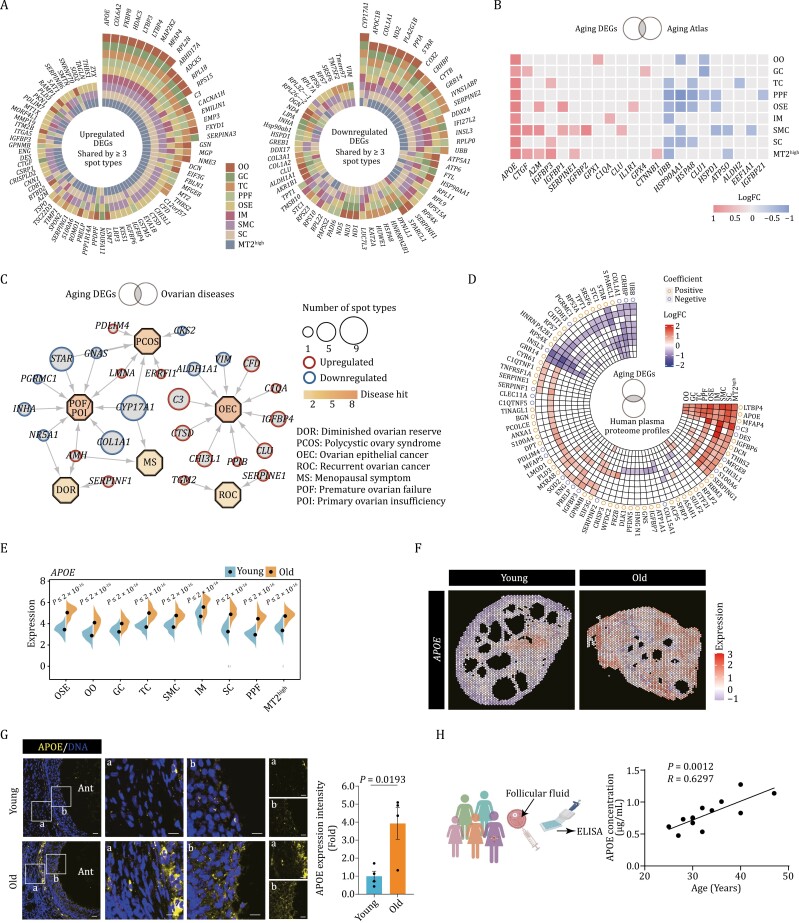
The ovary is indispensable for female reproduction, and its age-dependent functional decline is the primary cause of infertility. However, the molecular basis of ovarian aging in higher vertebrates remains poorly understood. Herein, we apply spatiotemporal transcriptomics to benchmark architecture organization as well as cellular and molecular determinants in young primate ovaries and compare these to aged primate ovaries. From a global view, somatic cells within the non-follicle region undergo more pronounced transcriptional fluctuation relative to those in the follicle region, likely constituting a hostile microenvironment that facilitates ovarian aging. Further, we uncovered that inflammation, the senescent-associated secretory phenotype, senescence, and fibrosis are the likely primary contributors to ovarian aging (PCOA). Of note, we identified spatial co-localization between a PCOA-featured spot and an unappreciated MT2 (Metallothionein 2) highly expressing spot (MT2high) characterized by high levels of inflammation, potentially serving as an aging hotspot in the primate ovary. Moreover, with advanced age, a subpopulation of MT2high accumulates, likely disseminating and amplifying the senescent signal outward. Our study establishes the first primate spatiotemporal transcriptomic atlas, advancing our understanding of mechanistic determinants underpinning primate ovarian aging and unraveling potential biomarkers and therapeutic targets for aging and age-associated human ovarian disorders.

Keywords: aging; inflammation; ovary; primate; senescence; spatial transcriptome.


Conflict of interest statement

The authors declare no competing.

Figures

Figure 1.
Figure 1.
Construction of a spatial transcriptomic atlas of cynomolgus monkey ovarian aging. (A) Workflow showing the establishment of spatial transcriptomic atlas of young (n = 4) and old monkey (n = 4) ovaries and validations of changes of core factors associated with aging. (B) Uniform manifold approximation and projection (UMAP) plot showing the nine spot types from follicular and non-follicular regions and two age groups. (C) Pie chart showing the proportion of different spot types and region types of monkey ovary. (D) Ridge plots showing scores of known marker genes for multiple major ovarian spot types. (E) Pathway enrichment analysis for the top 50 marker genes of each spot type. (F) Spatial expression of two marker genes (MT2 and TIMP1) for MT2high spot represented by a young representative individual. (G) GO term analysis of marker genes for the MT2high spot. (H) Representative spot distribution of spatial transcriptomics data from a young representative monkey ovary. Left, the spatial distribution of spots within follicle and non-follicle regions. Right, the spatial distribution of each spot type. (I) Representative spatial distribution of different spot types in ovarian tissue of a young monkey. Each spot type is separately represented.
Figure 2.
Figure 2.
Age-related structural disorganization in NHP ovary. (A) Bar plot showing the proportion distribution of follicle and non-follicle regions of young and old monkey ovaries. (B) Box plots showing the proportion of indicated regions in young and old monkey ovaries. (C) The distribution of follicle and non-follicle regions assigned onto the sections of young and old monkey ovaries. (D) Representative H&E staining images showing the follicles at different developmental stages in young and old monkey ovaries. The antral follicle is abbreviated as “Ant”. a, b, c, d, and e denote primordial, primary, secondary, antral, and atresia follicles, respectively. Number of primordial, primary, secondary, antral follicles per square millimeter and the percentage of atresia follicles are shown on the right. Scale bars, 200 μm and 100 μm (zoomed-in images). n = 4 monkeys for each group. (E) Bar plot showing the spot type proportions in young and old monkey ovaries. (F) Box plots showing the proportion of each spot type in young and old ovaries. (G) UMAP plot showing the distribution of OO and PPF spots spatially assigned onto the sections of young and old monkey ovaries. (H) DDX4 immunofluorescence staining of ovaries from young and old monkeys. Left, the representative images. Scale bars, 10 μm and 20 μm (zoomed-in images). Right, the numbers of DDX4-positive cells were quantified as fold changes (old vs. young), and presented as mean ± SEMs. n = 4 monkeys for each group. (I) The distribution of OSE spot spatially assigned onto the sections of young and old monkey ovaries. (J) E-Cadherin immunofluorescence staining of young and old monkey ovaries. Density of ovarian surface epithelial cells and thickness of OSE were quantified as fold changes (old vs. young) and presented on the right as mean ± SEMs. Scale bars, 10 μm. n = 4 monkeys for each group. (K) The distribution of SMC spot spatially assigned onto sections of young and old monkey ovaries. (L) SMA immunofluorescence staining of young and old monkey ovaries. The percentage of SMA-positive area and the thickness of SMA-positive area were quantified (old vs. young) and presented as mean ± SEMs on the right. Scale bars, 100 μm and 20 μm (zoomed-in images). n = 4 monkeys for each group.
Figure 3.
Figure 3.
Age-related changes in spatial transcriptomic profiling of NHP ovary. (A) Lollipop plot showing the number of aging-related differentially expressed genes (aging DEGs, old vs. young) in the follicle and the non-follicle regions. (B) Spatial distribution of the number of up- and down-regulated aging DEGs in the follicle and the non-follicle regions. (C) Circos plots showing the aging DEGs for each spot type. Each connecting curve represents one common aging DEG shared in two spot types. The number of aging DEGs for each spot type was also annotated in the corresponding parentheses. (D) Networks visualizing representative GO terms and pathways of aging DEGs across different spot types of monkey ovary. The nodes represent GO terms. The pie charts show the proportion of the number of genes that hit a certain term across spot types.
Figure 4.
Figure 4.
Transcriptional changes of several canonical aging hallmarks in NHP ovarian aging. (A) Schematic diagram showing the ovarian aging features unveiled by spatial transcriptomics. (B) Ridge plots (left) and spatial visualization (right) showing the global distribution density of gene set score of inflammatory response-related genes in young and old groups. The corresponding dashed lines represent the median of each group. (C) Ridge plots (left) and spatial visualization (right) showing the global distribution density of gene set score of SASP-related genes in young and old groups. The corresponding dashed lines represent the median of each group. (D) S100A9 immunofluorescence staining of ovaries from young and old monkeys. Representative images are shown on the left. Among them, “a” represents the staining in the non-follicle region, and “b” represents the staining in the follicle region. Scale bars, 200 μm and 20 μm (zoomed-in images). The numbers of S100A9-positive cells were quantified as fold changes (old vs. young), and presented as mean ± SEMs on the right. n = 4 monkeys for each group. (E) NF-κB p65 immunofluorescence staining of ovaries from young and old monkeys. Representative images are shown on the left. Among them, “a” represents the staining in the non-follicle region, and “b” represents the staining in the follicle region. Scale bars, 200 μm and 20 μm (zoomed-in images). The relative intensity was quantified as fold changes (old vs. young), and presented as mean ± SEMs on the right. n = 4 monkeys for each group. (F) Ridge plots (left) and spatial visualization (right) showing the global distribution density of gene set score of fibrosis-related genes in young and old groups. The corresponding dashed lines represent the median of each group. (G) Masson’s trichrome staining of young and old monkey ovaries. Representative images are shown on the left. Scale bar, 200 μm and 100 μm. The percentage of fibrosis area was quantified (old vs. young), and presented as mean ± SEMs on the right. n = 4 monkeys for each group. (H) Ridge plots (left) and spatial visualization (right) showing the global distribution density of gene set score of lipid storage-related genes in young and old groups. The corresponding dashed lines represent the median of each group. (I) ORO staining of ovaries from young and old monkeys. Representative images are shown on the left. Scale bars, 200 μm and 100 μm (zoomed-in images). The percentage of ORO-positive area was quantified was quantified as fold changes (old vs. young), and presented as mean ± SEMs on the right. n = 4 monkeys for each group. (J) Ridge plots (left) and spatial visualization (right) showing the global distribution density of gene set score of apoptosis related-genes in young and old groups. The corresponding dashed lines represent the median of each group. (K) TUNEL staining of ovarian tissues from young and old monkeys. Representative images are shown on the left. Among them, “a” represents the staining in the non-follicle region, and “b” represents the staining in the follicle region. Scale bar, 200 μm and 20 μm (zoomed-in images). The numbers of TUNEL-positive cells in the tissues were quantified as fold changes in old ovaries versus in young counterparts, and shown as mean ± SEMs on the right. n = 4 monkeys for each group. (L) Ridge plots (left) and spatial visualization (right) showing the global distribution density of gene set score of ROS-related genes in young and old groups. The corresponding dashed lines represent the median of each group. (M) 4-HNE staining of ovary tissues from young and old monkeys. Representative images are shown on the left. Among them, “a” represents the staining in the non-follicle region, and “b” represents the staining in the follicle region. The immunofluorescence expression intensity in the tissues was quantified as fold changes (old vs. young), and shown as mean ± SEMs on the right. n = 4 monkeys for each group. Scale bar, 200 μm and 20 μm (zoomed-in images). (N) Ridge plots (left) and spatial visualization (right) showing the global distribution density of gene set score of DNA repair-related genes in young and old groups. The corresponding dashed lines represent the median of each group. (O) γH2A.X staining of ovary tissues from young and old monkeys. Representative images are shown on the left. Among them, “a” represents the staining in the non-follicle region, and “b” represents the staining in the follicle region. γH2A.X-positive cells in the tissues were quantified as fold changes (old vs. young), and shown as mean ± SEMs on the right. n = 4 monkeys for each group. Scale bar, 200 μm and 20 μm (zoomed-in images). (P) Ridge plots (left) and spatial visualization (right) showing the global distribution density of gene set score of senescence-related genes in young and old groups. The corresponding dashed lines represent the median of each group. (Q) P21 staining of ovary tissues from young and old monkeys. Representative images are shown on the left. Among them, “a” represents the staining in the non-follicle region, and “b” represents the staining in the follicle region. P21-positive cells in the tissues were quantified as fold changes (old vs. young), and shown as mean ± SEMs on the right. n = 4 monkeys for each group. Scale bar, 200 μm and 20 μm (zoomed-in images).
Figure 5.
Figure 5.
Identification of aging hotspot in NHP ovary from spatial aspect. (A) Schematic diagram showing the generation of OSAG gene sets. (B) Violin plots showing the gene set scores of OSAG-upregulated and OSAG-downregulated genes across different spot types from old and young monkey ovaries. (C) Pearson correlation analysis between OSAG-upregulated or OSAG-downregulated gene set scores and gene set scores of 11 age-related signaling pathways in monkey ovary. (D) The spatial distribution and colocalization visualization of spots with OSAG-upregulated gene set score or SASP-related gene set score. (E) Correlation analysis between OSAG-upregulated set scores and gene set scores of 11 age-related signaling pathways across different spot types in monkey ovary. (F) Schematic diagram showing the procedure for identifying aging hotspots based on primary contributors to ovarian aging (PCOA) scores. (G) The proportion analysis of different spot types in total identified aging hotspots. (H) Schematic diagram showing the center and periphery regions around aging spot (left). The bar plots showing the negative correlation between spatial distance from the hotspot and aging or PCOA scores (right).
Figure 6.
Figure 6.
Characterization of the senescence hotspot and its microenvironment in aged ovaries. (A) Pseudotime analysis of GC, TC, and MT2high spot in NHP ovary. Upper left, pseudotime scores of the three spot types in monkey ovary. Upper right, the distribution of young and old groups along the pseudotime trajectory. Middle left, the distribution of these three spot types along the pseudotime trajectory. Middle right, the distribution of different states of MThigh spot along the pseudotime trajectory. Lower left, bar plot showing the proportion distribution of three states of MT2high spots between young and old groups. Lower right, the spatial distribution of three states of MT2high spots. (B) Heatmap showing four different expression patterns along the pseudotime trajectory based on branched expression analysis modeling (BEAM) analysis and bar plot showing the enriched GO terms for cluster 1 genes. (C) Enriched GO terms and pathways of aging DEGs in MT2high spot. (D) Bar plot showing pathway enrichment analysis of overlapped genes between upregulated aging DEGs in MT2high spot and Cluster1 genes. (E) Heatmap showing the expression levels of the top 10 (LogFC) overlapping genes between upregulated aging DEGs in MT2high spot and Cluster1 genes. (F) MT2 immunostaining in young and old monkey ovaries. The relative intensity was quantified as fold changes (old vs. young), and presented as mean ± SEMs on the right. Scale bars, 20 μm and 10 μm (zoomed-in images). n = 4 monkeys for each group. (G) Dot plot showing the interaction pairs between MT2high and other spot types unique in the aged group.
Figure 7.
Figure 7.
Signatures of NHP ovarian aging based on spatial transcriptome. (A) Plots showing the upregulated and downregulated aging DEGs shared by at least three spot types. (B) Heatmap showing the upregulated and downregulated aging DEGs overlapped with genes annotated in Aging Atlas database across different spot types. (C) Network visualization of upregulated and downregulated DEGs in 11 different ovarian spot types in the ovarian disease. Octagonal nodes represent diseases. Round nodes represent genes and node size positively correlates with the number of spot types differentially expressing the gene, respectively. (D) Circular heatmap showing the upregulated and downregulated aging DEGs overlapped with proteins from human plasma proteome profiles across the lifespan. Correlation coefficient indicates the positive or negative relationship between the indicated proteins with age. (E) Violin plot showing the expression levels of APOE in young and old cynomolgus monkey ovaries. (F) The spatial gene expression of APOE spatially assigned onto the sections of young and old cynomolgus monkey ovaries. (G) APOE immunofluorescence staining of young and old monkey ovaries. Representative images are shown on the left. Among them, “a” represents the staining in the non-follicle region, and “b” represents the staining in the follicle region. The relative immunofluorescence intensity was quantified as fold changes (old vs. young), and presented as mean ± SEMs on the right. Scale bars, 20 μm and 10 μm (zoomed-in images). n = 4 monkeys for each group. (H) ELISA analysis showing the APOE concentration in the follicle fluid of women aged from 25 to 47 years old (n = 13).

References

    1. Adashi EY. Endocrinology of the ovary. Hum Reprod 1994;9:815–27. - PubMed
    1. Aging Atlas C. Aging Atlas: a multi-omics database for aging biology. Nucleic Acids Res 2021;49:D825–30. - PMC - PubMed
    1. Aging Biomarker C, Bao H, Cao J. et al.. Biomarkers of aging. Sci China Life Sci 2023;66:893–1066. - PMC - PubMed
    1. Ahmed TA, Ahmed SM, El-Gammal Z. et al.. Oocyte aging: the role of cellular and environmental factors and impact on female fertility. Adv Exp Med Biol 2020;1247:109–23. - PubMed
    1. Amargant F, Manuel SL, Tu Q. et al.. Ovarian stiffness increases with age in the mammalian ovary and depends on collagen and hyaluronan matrices. Aging Cell 2020;19:e13259. - PMC - PubMed

Publication types