. 2024 Mar;67(3):528-546.
doi: 10.1007/s00125-023-06060-w. Epub 2023 Dec 21.

GLP-1 metabolite GLP-1(9-36) is a systemic inhibitor of mouse and human pancreatic islet glucagon secretion

Affiliations

GLP-1 metabolite GLP-1(9-36) is a systemic inhibitor of mouse and human pancreatic islet glucagon secretion

Nikhil R Gandasi et al. Diabetologia. 2024 Mar.

Abstract

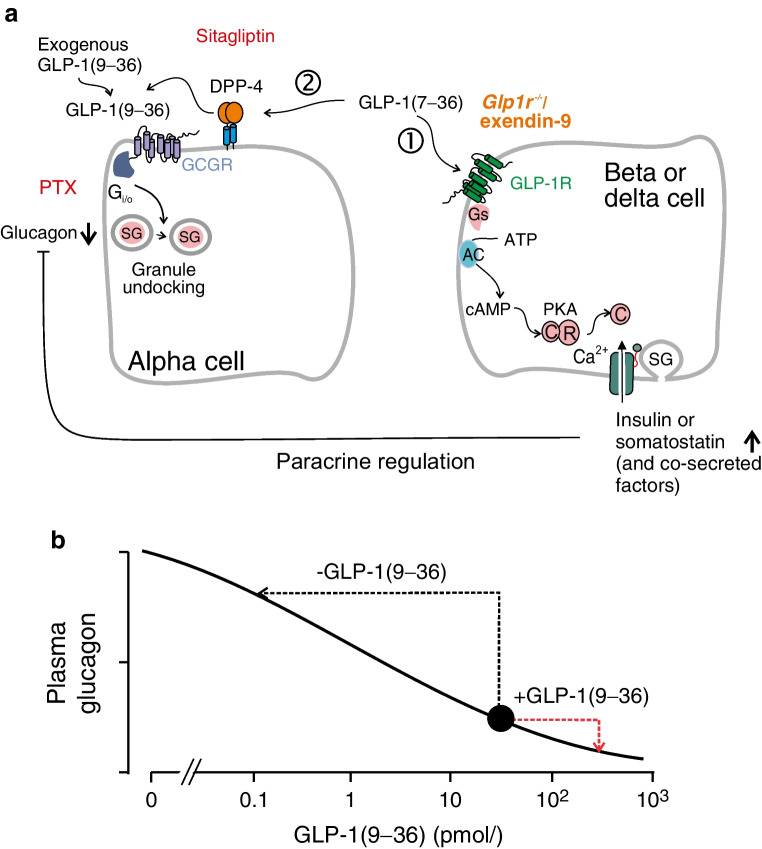
Aims/hypothesis: Diabetes mellitus is associated with impaired insulin secretion, often aggravated by oversecretion of glucagon. Therapeutic interventions should ideally correct both defects. Glucagon-like peptide 1 (GLP-1) has this capability but exactly how it exerts its glucagonostatic effect remains obscure. Following its release GLP-1 is rapidly degraded from GLP-1(7-36) to GLP-1(9-36). We hypothesised that the metabolite GLP-1(9-36) (previously believed to be biologically inactive) exerts a direct inhibitory effect on glucagon secretion and that this mechanism becomes impaired in diabetes.

Methods: We used a combination of glucagon secretion measurements in mouse and human islets (including islets from donors with type 2 diabetes), total internal reflection fluorescence microscopy imaging of secretory granule dynamics, recordings of cytoplasmic Ca2+ and measurements of protein kinase A activity, immunocytochemistry, in vivo physiology and GTP-binding protein dissociation studies to explore how GLP-1 exerts its inhibitory effect on glucagon secretion and the role of the metabolite GLP-1(9-36).

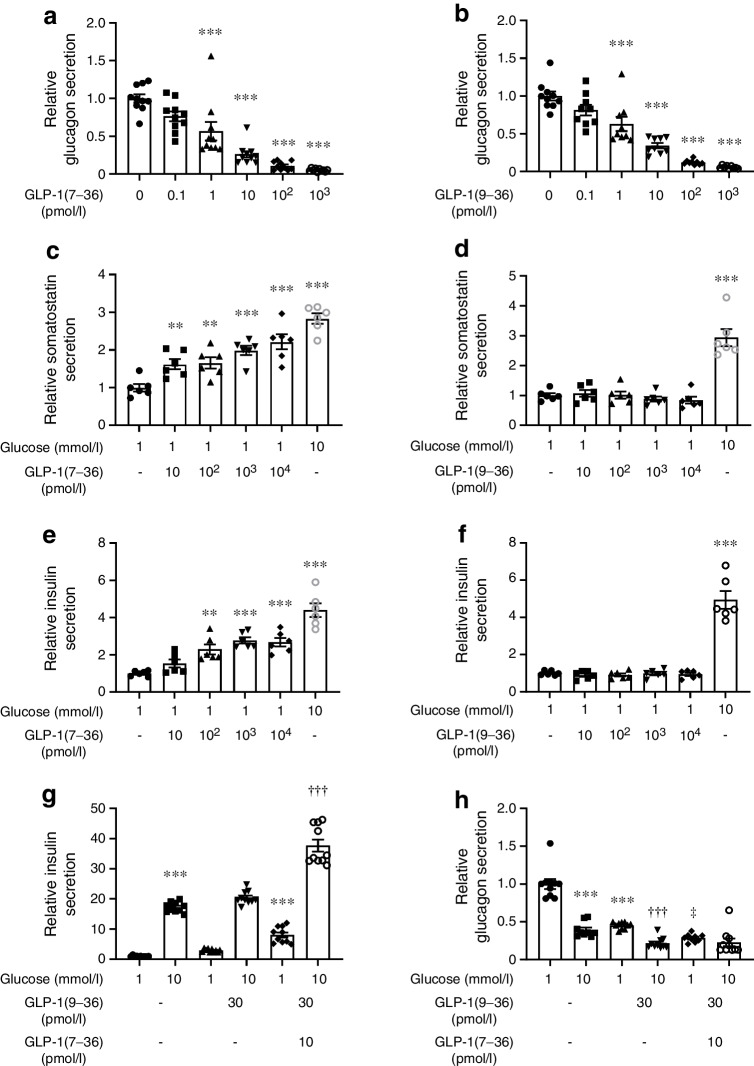
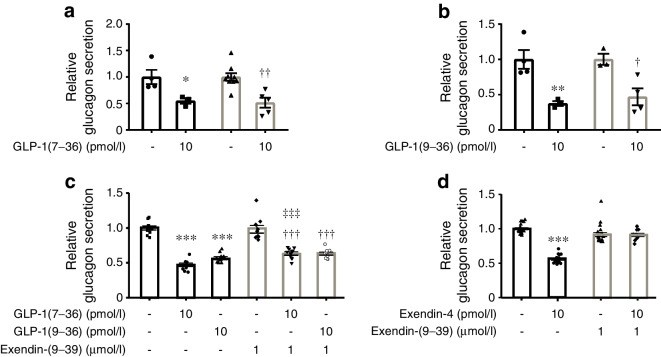
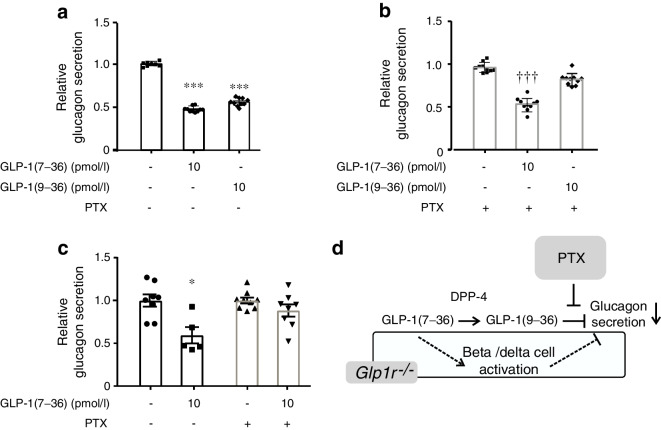
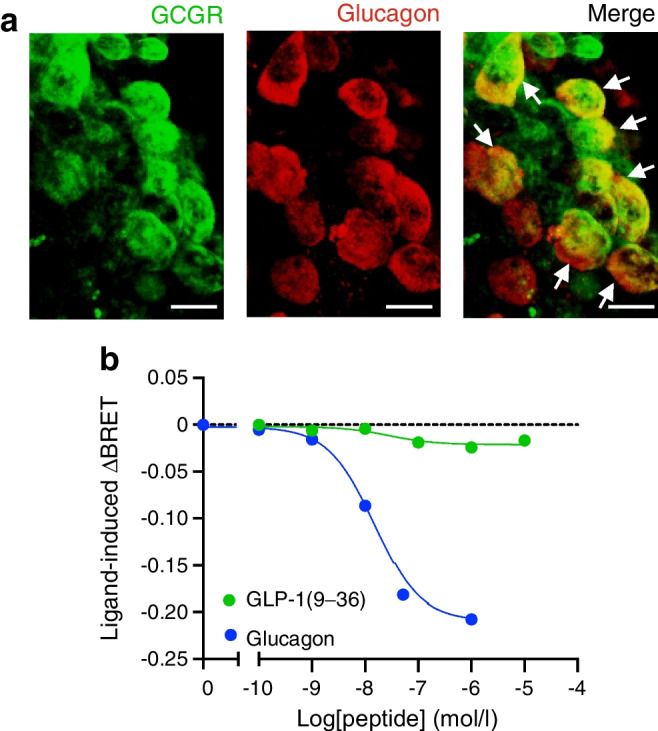
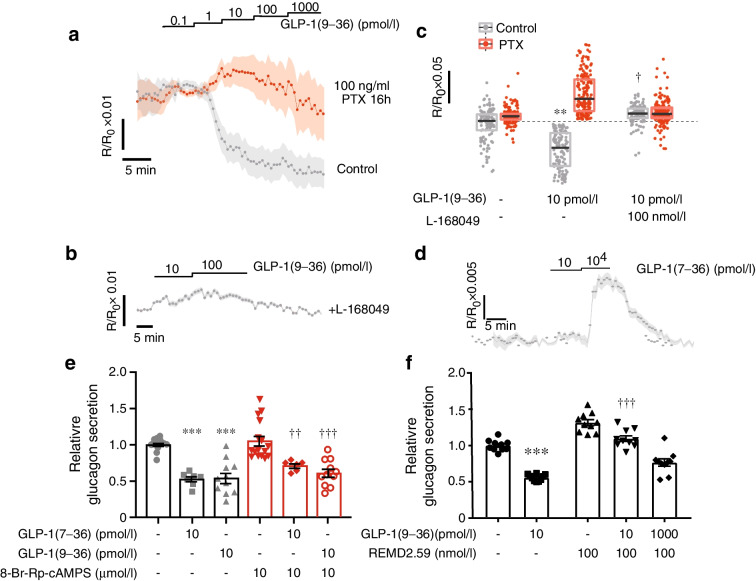
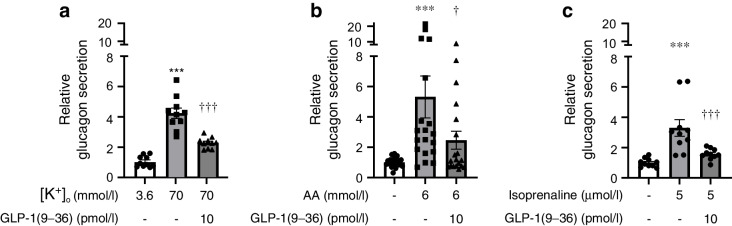
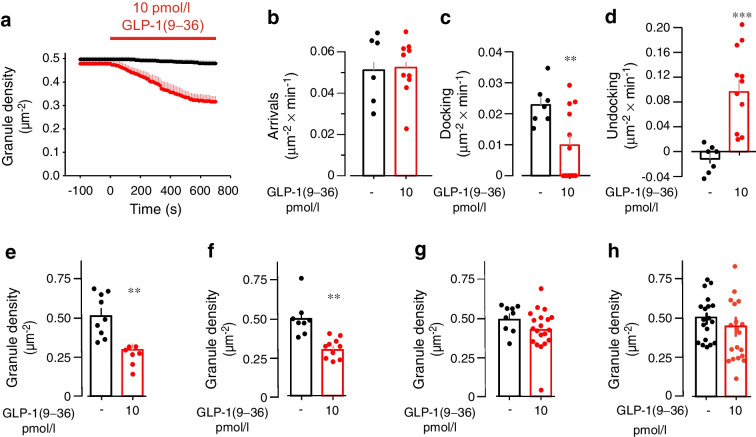
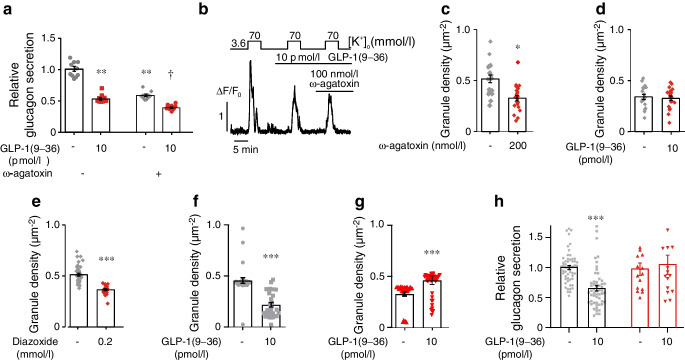
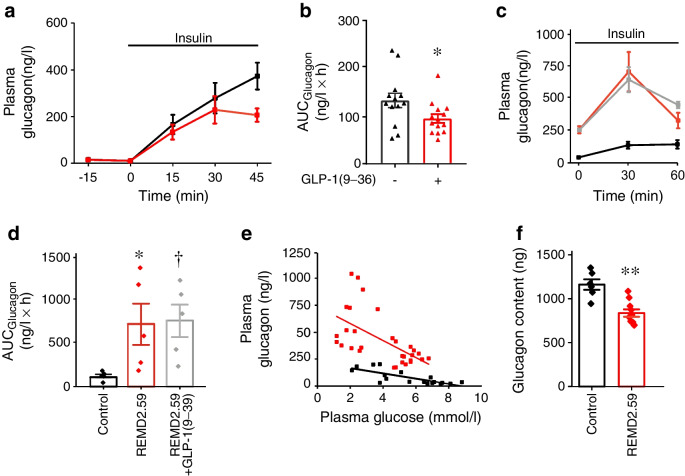
Results: GLP-1(7-36) inhibited glucagon secretion in isolated islets with an IC50 of 2.5 pmol/l. The effect was particularly strong at low glucose concentrations. The degradation product GLP-1(9-36) shared this capacity. GLP-1(9-36) retained its glucagonostatic effects after genetic/pharmacological inactivation of the GLP-1 receptor. GLP-1(9-36) also potently inhibited glucagon secretion evoked by β-adrenergic stimulation, amino acids and membrane depolarisation. In islet alpha cells, GLP-1(9-36) led to inhibition of Ca2+ entry via voltage-gated Ca2+ channels sensitive to ω-agatoxin, with consequential pertussis-toxin-sensitive depletion of the docked pool of secretory granules, effects that were prevented by the glucagon receptor antagonists REMD2.59 and L-168049. The capacity of GLP-1(9-36) to inhibit glucagon secretion and reduce the number of docked granules was lost in alpha cells from human donors with type 2 diabetes. In vivo, high exogenous concentrations of GLP-1(9-36) (>100 pmol/l) resulted in a small (30%) lowering of circulating glucagon during insulin-induced hypoglycaemia. This effect was abolished by REMD2.59, which promptly increased circulating glucagon by >225% (adjusted for the change in plasma glucose) without affecting pancreatic glucagon content.

Conclusions/interpretation: We conclude that the GLP-1 metabolite GLP-1(9-36) is a systemic inhibitor of glucagon secretion. We propose that the increase in circulating glucagon observed following genetic/pharmacological inactivation of glucagon signalling in mice and in people with type 2 diabetes reflects the removal of GLP-1(9-36)'s glucagonostatic action.

Keywords: GLP-1; Glp1r; Glucagon; Glucagon receptor antagonist; Granule docking; Pancreatic alpha cell; Type 2 diabetes.


Figures

Fig. 1
Fig. 1
GLP-1 inhibits glucagon secretion. (a) Effect of increasing concentrations of GLP-1(7–36) on glucagon secretion in isolated mouse islets. Each data point represents a unique group of 12 islets isolated from 4–6 mice. Glucagon secretion has been normalised to that at 1 mmol/l glucose (1=17±0.36 pg islet−1 h−1). Rectangles and error bars represent mean values ± SEM. ***p<0.001 (one-way ANOVA followed by Tukey’s post hoc test). (b) As for (a) but using GLP-1(9–36) (1=10.0±0.4 pg islet−1 h−1). ***p<0.001. (c, d) As for (a, b) but effects on somatostatin secretion were measured. Each data point represents a unique group of 20 islets isolated from 4 mice. Somatostatin secretion has been normalised to that at 1 mmol/l glucose (1=0.074±0.007% and 0.055±0.004% of content/h in c and d, respectively). **p<0.01, ***p<0.001 (one-way ANOVA followed by Tukey’s post hoc test). (e, f) As for (c, d) but insulin secretion was measured (1=0.055±0.003% and 0.065±0.003% of content/h in e and f, respectively). **p<0.01, ***p<0.001 (one-way ANOVA followed by Tukey’s post hoc test). (g) Effects of GLP-1(9-36) and GLP-1(7-36) on insulin secretion at 1 and 10 mmol/l glucose. Insulin secretion has been normalised to that at 1 mmol/l glucose (1=29±2 pg islet−1 h−1). ***p<0.001 vs 1 mmol/l glucose; †††p<0.001 vs 10 mmol/l glucose and 30 pmol/l GLP-1(9–36) (one-way ANOVA followed by Tukey’s post hoc test). Concentrations of GLP-1(9–36) and GLP-1(7–36) used at both the glucose concentrations. (h) As for (g) but glucagon secretion was measured (1=4.2±0.3 pg islet−1 h−1). ***p<0.001 vs 1 mmol/l glucose; †††p<0.001 vs 10 mmol/l glucose alone; p<0.05 vs 1 mmol/l glucose and 30 pmol/l GLP-1(9–36) (one-way ANOVA followed by Tukey’s post hoc test)
Fig. 2
Fig. 2
GLP-1’s glucagonostatic effect does not require Glp1r. (a) Effects of 10 pmol/l GLP-1(7–36) on glucagon secretion in wild-type (black) and Glp1r−/− (grey) islets. Each data point represents a unique group of 12 islets isolated from 4 mice of each genotype. Glucagon secretion has been normalised to that at 1 mmol/l glucose (1=3.4±0.46 pg islet−1 h−1 and 2.6±0.2 pg islet−1 h−1 in wild-type and Glp1r−/− islets, respectively). *p<0.05 vs control in wild-type islets; ††p<0.01 vs control in Glp1r−/− islets. (b) As for (a) but testing 10 pmol/l GLP-1(9–36) and using 3 mice of each genotype (1=3.5±0.5 pg islet−1 h−1 and 2.2±0.17 pg islet−1 h−1 in wild-type and Glp1r−/− islets, respectively). **p<0.05 vs control in wild-type islets; p<0.05 vs control in Glp1r−/− islets. (c) Effects of 10 pmol/l GLP-1(7–36) and (9–36) on glucagon secretion in the absence and presence of the GLP-1R antagonist exendin(9–39) (1 μmol/l) as indicated. Each data point represents a unique group of 12 islets isolated from 8 mice. Glucagon secretion has been normalised to that at 1 mmol/l glucose (1=7.4±0.2 pg islet−1 h−1). ***p<0.001 vs 1 mmol/l glucose; †††p<0.001 vs exendin(9–39); ‡‡‡p<0.001 vs 10 pmol/l GLP-1(9–36). (d) Effects of exendin-4 (10 pmol/l) in the absence and presence of exendin(9–39) (1 μmol/l) as indicated. Each data point represents a unique group of 12 islets isolated from 8 mice. Glucagon secretion has been normalised to that at 1 mmol/l glucose (1=3.88±0.12 pg islet−1 h−1). ***p<0.001. Statistical analyses in (ac) were carried out by one-way ANOVA followed by Tukey’s post hoc test
Fig. 3
Fig. 3
GLP-1(9–36) exerts its glucagonostatic effects by PTX-sensitive mechanisms. (a, b) Effects of GLP-1(7–36) and GLP-1(9–36) on glucagon release without (a) or with (b) overnight pretreatment with PTX (100 ng/ml) as indicated. Each data point represents a unique group of 12 islets isolated from 16 mice. Glucagon secretion has been normalised to that at 1 mmol/l glucose (1=10.7±0. pg islet−1 h−1). ***p<0.001 vs control; †††p<0.001 vs 1 mmol/l glucose in PTX-treated islets. In (a) islets were cultured overnight without PTX. (c) Effects of 10 pmol/l GLP-1(7–36) on glucagon release in Glp1r−/− islets under control conditions and after pretreatment with PTX. Each data point represents a unique group of 12 islets isolated from 10 mice. Glucagon secretion has been normalised to that at 1 mmol/l glucose (1=4.3±0.6 pg islet−1 h−1 and 5.7±0.95 pg islet−1 h−1 in the absence and presence of PTX, respectively. *p<0.05 vs no GLP-1(7–36) in control islets. (d) Schematic showing conversion of GLP-1(7–36) into GLP-1(9–36) and impact of PTX pretreatment. GLP-1(7–36) (and exendin-4), via activation of GLP-1Rs in beta and delta cells, inhibits glucagon secretion by a PTX-resistant paracrine mechanism (rectangle) that is lost following ablation of the GLP-1R (Glp1r−/−). Statistical analyses in (ac) were carried out by one-way ANOVA followed by Tukey’s post hoc test
Fig. 4
Fig. 4
Glucagon receptors in alpha cells and their activation by GLP-1(9–36). (a) Glucagon receptor (GCGR) immunoreactivity in alpha cells. Double immunofluorescence staining of GCGR (green) and glucagon (red) in a mouse pancreatic islet. GCGR staining was merged with glucagon staining to test the co-localisation. GCGR and glucagon double-positive cells are indicated with white arrows. Scale bar, 10 μm. (b) Effects of increasing concentrations of glucagon or GLP-1(9–36) (logarithmic scale) on dissociation of the GoA GTP-binding protein α-subunit from GCGRs expressed in HEK293T cells using the TRUPATH biosensor platform. Effects are expressed as the ligand-induced change in BRET (relative to that in the absence of any peptides; ΔBRET, y-axis) against concentration of glucagon or GLP-1(9–36) (x-axis). Data representative of 4 and 3 replicates for glucagon and GLP-1(9–36), respectively. See also ESM Table 4.
Fig. 5
Fig. 5
GLP-1(9–36) inhibits PKA activity and glucagon secretion by GCGR-dependent mechanism. (a) Effects of increasing concentrations of GLP-1(9–36) (staircase) on PKA activity in individual alpha cells in intact islets under control conditions (n=420 cells from 3 mice) and after pretreatment with PTX (n=785 cells from 3 mice). Data are mean values ± SEM. (b) PKA activity in alpha cells in response to 10 and 100 pmol/l GLP-1(9–36) in the presence of 100 nmol/l of L-168049 (n=420 cells from 3 mice). In (a, b) responses have been normalised to basal conditions prior to the addition of the agonists. (c) Box plots of changes in PKA activity in response to 10 pmol/l GLP-1(9–36) under control conditions and after pretreatment with PTX (n=785 cells from 3 mice) or in the presence of 100 nmol/l of L-168049. **p<0.01 vs basal level (evaluated by Friedman ANOVA, Nemenyi post hoc test); p<0.05 vs GLP-1(9–36) in the absence of L-168049 (Kruskal–Wallis ANOVA, Nemenyi’s post hoc test). Black lines represent medians and the boxes indicate first and third quartiles. (d) As for (b) but testing the effects of 10 pmol/l and 10,000 pmol/l GLP-1(7–36) (n=420 cells from 3 mice). (e) Effects of GLP-1(7–36) and (9–36) on glucagon secretion in the absence (black) or presence (red) of 8-Br-Rp-cAMPS (10 μmol/l) as indicated. Each data point represents a unique group of 12 islets isolated from 10–11 mice. Glucagon secretion has been normalised to that at 1 mmol/l glucose (1=1.8±0.3 pg islet−1 h−1). ***p<0.001 vs control in the absence of 8-Br-Rp-cAMPS; ††p<0.01 and †††p<0.001 vs control in the presence of 8-Br-Rp-cAMPS (one-way ANOVA and Tukey’s post hoc test). (f) Effects of 10 pmol/l and 1000 pmol/l GLP-1(9–36) on glucagon secretion in the absence (black) or presence (red) of 100 nmol/l of the monoclonal antibody/antagonist REMD2.59. Each data point represents a unique group of 12 islets isolated from 6 mice. Glucagon secretion has been normalised to that at 1 mmol/l glucose (1=7.4±0.1 pg islet−1 h−1). ***p<0.001 vs no GLP-1(9–36); †††p<0.001 vs 10 pmol/l GLP-1 in the absence of REMD2.59 (one-way ANOVA followed by Tukey’s post hoc test)
Fig. 6
Fig. 6
GLP-1(9–36) inhibits both depolarisation- and agonist-induced glucagon secretion. (a) Glucagon secretion at 3.6 or 70 mmol/l extracellular K+ ([K+]o) in the absence or presence of GLP-1(9–36) as indicated. Each data point represents a unique group of 12 islets isolated from 6 mice). Glucagon secretion has been normalised to that at 1 mmol/l glucose (1=16.9±1.9 pg islet−1 h−1). ***p<0.001 vs 1 mmol/l glucose at 3.6 mmol/l [K+]o; †††p<0.001 vs 70 mmol/l [K+]o alone. (b) Glucagon secretion at 1 mmol/l glucose in the absence or presence of a cocktail of AAs (2 mmol/l each of glutamine, alanine and arginine) and GLP-1(9–36) as indicated. Each data point represents a unique group of 12 islets isolated from 10 mice. Glucagon secretion has been normalised to that at 1 mmol/l glucose (1=36.5±7.3 pg islet−1 h−1). ***p<0.001vs no AAs; p<0.05 vs 6 mmol/l AA alone. (c) As for (b) but testing the effects of isoprenaline (1=11±1.9 pg islet−1 h−1; 9 mice). ***p<0.001 vs 1 mmol/l glucose; †††p<0.001 vs isoprenaline. Statistical significance in (ac) was estimated using one-way ANOVA with Tukey’s post hoc test
Fig. 7
Fig. 7
GLP-1 leads to undocking of secretory granules in alpha cells. (a) Docked granule density measured in mouse alpha cells in the absence (black) or presence (red) of GLP-1(9–36) (10 pmol/l). When tested, GLP-1(9–36) was included in the superfusion medium as indicated by the horizontal line. Data are mean values ± SEM of 7 cells from 3 mice for control and 12 cells from 4 mice for GLP-1(9–36). (bd) Number of granules arriving (b), docking (c) and undocking (d) in the absence or presence of GLP-1(9–36) during 15 min in the experiments summarised in (a). Data in bar graphs represent mean values ± SEM superimposed on individual data points. (eh) Granule density measured in the absence or presence of GLP-1(9–36) under control conditions (e), in the presence of exendin(9–39) (100 nmol/l) (f), with the GCGR antagonist L-168049 (100 nmol/l) (g) and after pretreatment with PTX (100 ng/ml) for 16 h (h). Granule density was measured 15 min after addition of GLP-1(9–36). Data points correspond to individual cells obtained from at least 3 different mice. Cells were pretreated with exendin(9–39) and L-168049 for 15 min before measurements commenced. Data were normalised to membrane area. **p<0.01, ***p<0.001 vs no GLP-1(9–36) in each panel (Student’s t test)
Fig. 8
Fig. 8
Impact of P/Q-type Ca2+ channel inhibition and type 2 diabetes on GLP-1(9–36)-induced granule undocking. (a) Glucagon secretion measured at 1 mmol/l glucose in the absence and presence of 10 pmol/l GLP-1(9–36) under control conditions (without ω-agatoxin) and in the presence of ω-agatoxin (200 nmol/l) as indicated. Note that the blocker, when added as indicated, was present in both the absence and presence of GLP-1(9–36). Each data point represents a unique group of 12 islets isolated from 6 mice. Glucagon secretion has been normalised to that at 1 mmol/l glucose (1=6.0±0.2 pg islet−1 h−1). **p<0.01 vs 1 mmol/l glucose; p<0.05 vs 1 mmol/l glucose and ω-agatoxin (one-way ANOVA followed by Dunnet’s post hoc test). (b) Depolarisation-evoked increases in [Ca2+]i elicited by increasing extracellular K+ ([K+]o) from 3.6 to 70 mmol/l in the presence of 10 μmol/l isradipine (to block L-type Ca2+ channels). Under these experimental conditions depolarisation-induced Ca2+ entry will reflect P/Q-type Ca2+ channel activity. GLP-1(9–36) (10 pmol/l) and ω-agatoxin were included in the medium as indicated (n=139 cells from 4 mice). (c) Granule density measured in the absence or presence of ω-agatoxin (200 nmol/l). *p<0.05. (d) Effects of GLP-1(9–36) in the presence of ω-agatoxin (200 nmol/l). (e) As for (c) but testing the effect of diazoxide (0.2 mmol/l). Control cells were incubated in the presence of 0.1% DMSO (solvent used for diazoxide). ***p<0.001 vs 1 mmol/l glucose (Student’s t test). (f) Granule density measured in human alpha cells in the absence or presence of 10 pmol/l GLP-1(9–36) (measured after 15 min). Mean values ± SEM of 28 GLP-1(9–36)-treated and 27 control alpha cells from 3 donors. ***p<0.001 vs control (Student’s t test). (g) As for (f) but in alpha cells from donors with type 2 diabetes. Mean values ± SEM of 43 GLP-1(9–36)-treated and 31 control cells from two donors. ***p<0.001 vs control. (h) Effects of GLP-1(9–36) on glucagon secretion in islets from cadaveric healthy donors. Each data point represents a unique group of 12 islets isolated from 13 healthy donors (black bars and grey symbols) and 3 donors with type 2 diabetes (red bars and symbols). Glucagon secretion has been normalised to that at 1 mmol/l glucose (1=7.01±0.91 and 2.41±0.62 pg islet−1 h−1 from experiments carried out on islets from donors without and with type 2 diabetes, respectively). ***p<0.001 vs no GLP-1(9–36) in islets from healthy donors (one-way ANOVA with Dunnett’s post hoc test)
Fig. 9
Fig. 9
Effects of GLP-1(9–36) on plasma glucose and glucagon secretion during insulin-induced hypoglycaemia. (a) Plasma glucagon measured in mice with (red squares) or without (black squares) injection of GLP-1(9–36) (100 µg/kg body weight; at t=−15 min). GLP-1(9–36) was injected intraperitoneally and samples were taken at indicated times. At t=0 min, insulin (0.75 U/kg i.p.) was injected. Data are mean values ±SEM of 13 or 14 mice. (b) Dot plots of glucagon AUCs measured during 45 min following injection of insulin at t=0 min and later in (a) in the absence (black triangles) or presence (red triangles) of exogenous GLP-1(9–36). *p<0.05 vs control by Student’s t test. (c) Changes in plasma glucagon during insulin-induced hypoglycaemia (0.75 U/kg body weight i.p.) under control conditions (black squares/lines) and in mice pretreated with REMD2.59 with (grey squares/lines) or without (red squares/lines) pre-injection of GLP-1(9–36) (100 µg/kg body weight). (d) Dot plots of the AUCs of data in (c) under the indicated conditions. *p=0.05 and p<0.05 vs no REMD2.59 with/without GLP-1(9–36) control. (e) Relationship between plasma glucose and glucagon in vivo measured in (d). Data in REMD2.59-treated mice with/without GLP-1(9–36) were pooled. The black and red lines represent linear fits to the data points under control conditions (r=−0.77) and after pretreatment with REMD2.59 (r=−0.59; p<0.011 vs no REMD2.59). (f) Whole-pancreas glucagon content in control mice and mice pretreated with REMD2.59. **p<0.01 (Student’s t test)
Fig. 10
Fig. 10
Regulation of glucagon secretion by physiological concentrations of GLP-1(7–36) and (9–36) via paracrine and intrinsic alpha cell mechanisms. (a) GLP-1(7–36) inhibits glucagon secretion by dual effects (indicated by 1 and 2). (1) Activation of GLP-1Rs in beta and delta cells stimulates the release of paracrine inhibitors of glucagon secretion. This mechanism is suppressed by pharmacological [using exendin(9–39)] or genetic inactivation of the GLP-1R. (2) GLP-1(9–36), generated by (DPP-4-mediated) degradation of GLP-1(7–36), results in activation of an inhibitory GTP-binding protein (Gi/o), culminating (via undocking of secretory granules [SG] below the plasma membrane) in suppression of glucagon secretion. This mechanism is not affected by genetic/pharmacological inactivation of the GLP-1R but is sensitive to pertussis toxin. It is not activated by exendin-4, which is more resistant to DPP-4-induced degradation than GLP-1(7–36). GLP-1(7–36) will activate both (1) and (2) but exogenous GLP-1(9–36) will only activate (2). (b) Concentration-dependent inhibition of glucagon secretion by GLP-1(9–36). Because of high circulating GLP-1(9–36) levels, administration of high exogenous GLP-1(9–36) will only have a marginal additional glucagonostatic effect (red arrow). GRAs lead to a large increase in circulating glucagon by reversing the glucagonostatic effects of endogenous GLP-1(9–36) (black arrow)

Similar articles

Cited by

References

    1. Cryer PE. Hypoglycemia-associated autonomic failure in diabetes: maladaptive, adaptive, or both? Diabetes. 2015;64(7):2322–2323. doi: 10.2337/db15-0331. - DOI - PMC - PubMed
    1. Unger RH, Orci L. The essential role of glucagon in the pathogenesis of diabetes mellitus. Lancet. 1975;1(7897):14–16. doi: 10.1016/s0140-6736(75)92375-2. - DOI - PubMed
    1. Kahn SE, Zraika S, Utzschneider KM, Hull RL. The beta cell lesion in type 2 diabetes: there has to be a primary functional abnormality. Diabetologia. 2009;52(6):1003–1012. doi: 10.1007/s00125-009-1321-z. - DOI - PMC - PubMed
    1. Gilon P, Chae HY, Rutter GA, Ravier MA. Calcium signaling in pancreatic beta-cells in health and in type 2 diabetes. Cell Calcium. 2014;56(5):340–361. doi: 10.1016/j.ceca.2014.09.001. - DOI - PubMed
    1. Holst JJ. The physiology of glucagon-like peptide 1. Physiol Rev. 2007;87(4):1409–1439. doi: 10.1152/physrev.00034.2006. - DOI - PubMed