. 2024 Mar 1;30(5):1038-1053.
doi: 10.1158/1078-0432.CCR-23-2548.

Spatial Gene-Expression Profiling Unveils Immuno-oncogenic Programs of NF1-Associated Peripheral Nerve Sheath Tumor Progression

Affiliations

Spatial Gene-Expression Profiling Unveils Immuno-oncogenic Programs of NF1-Associated Peripheral Nerve Sheath Tumor Progression

Dana K Mitchell et al. Clin Cancer Res. .

Abstract

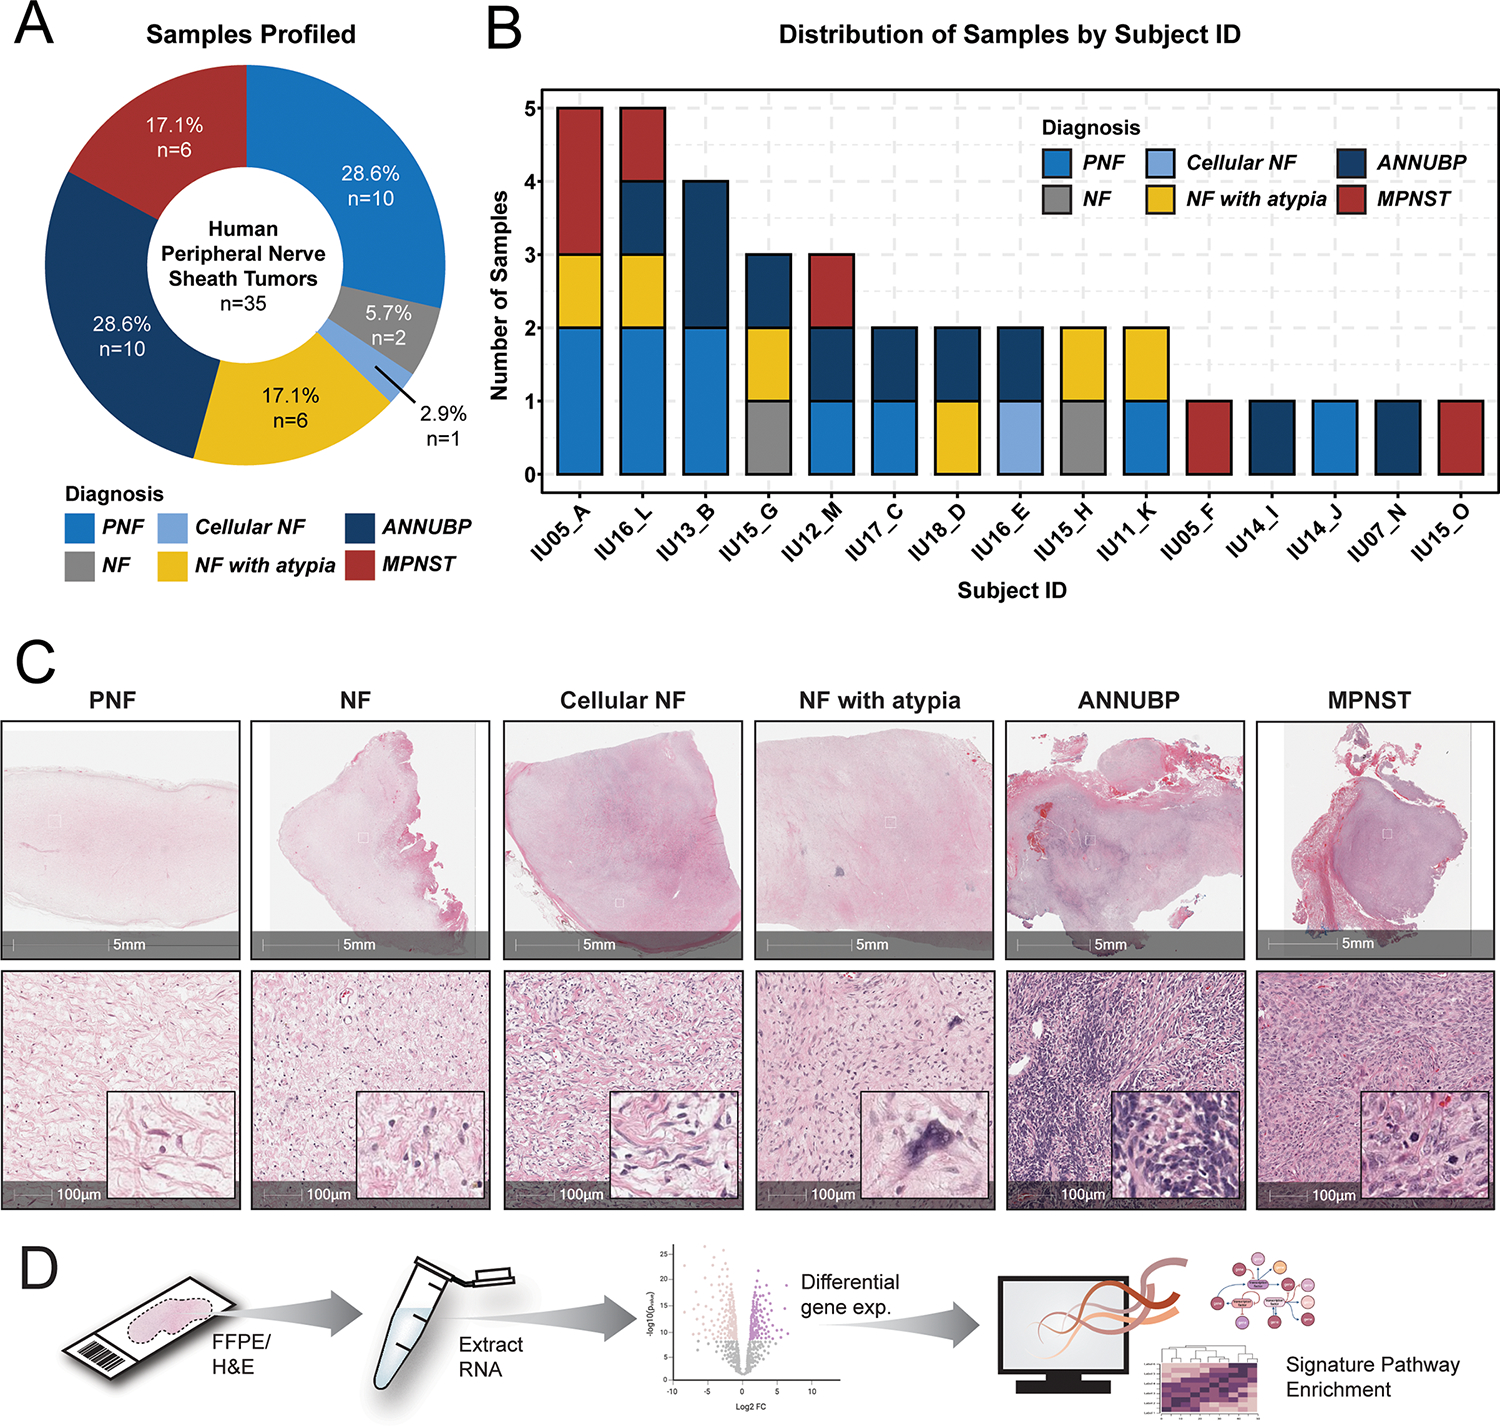
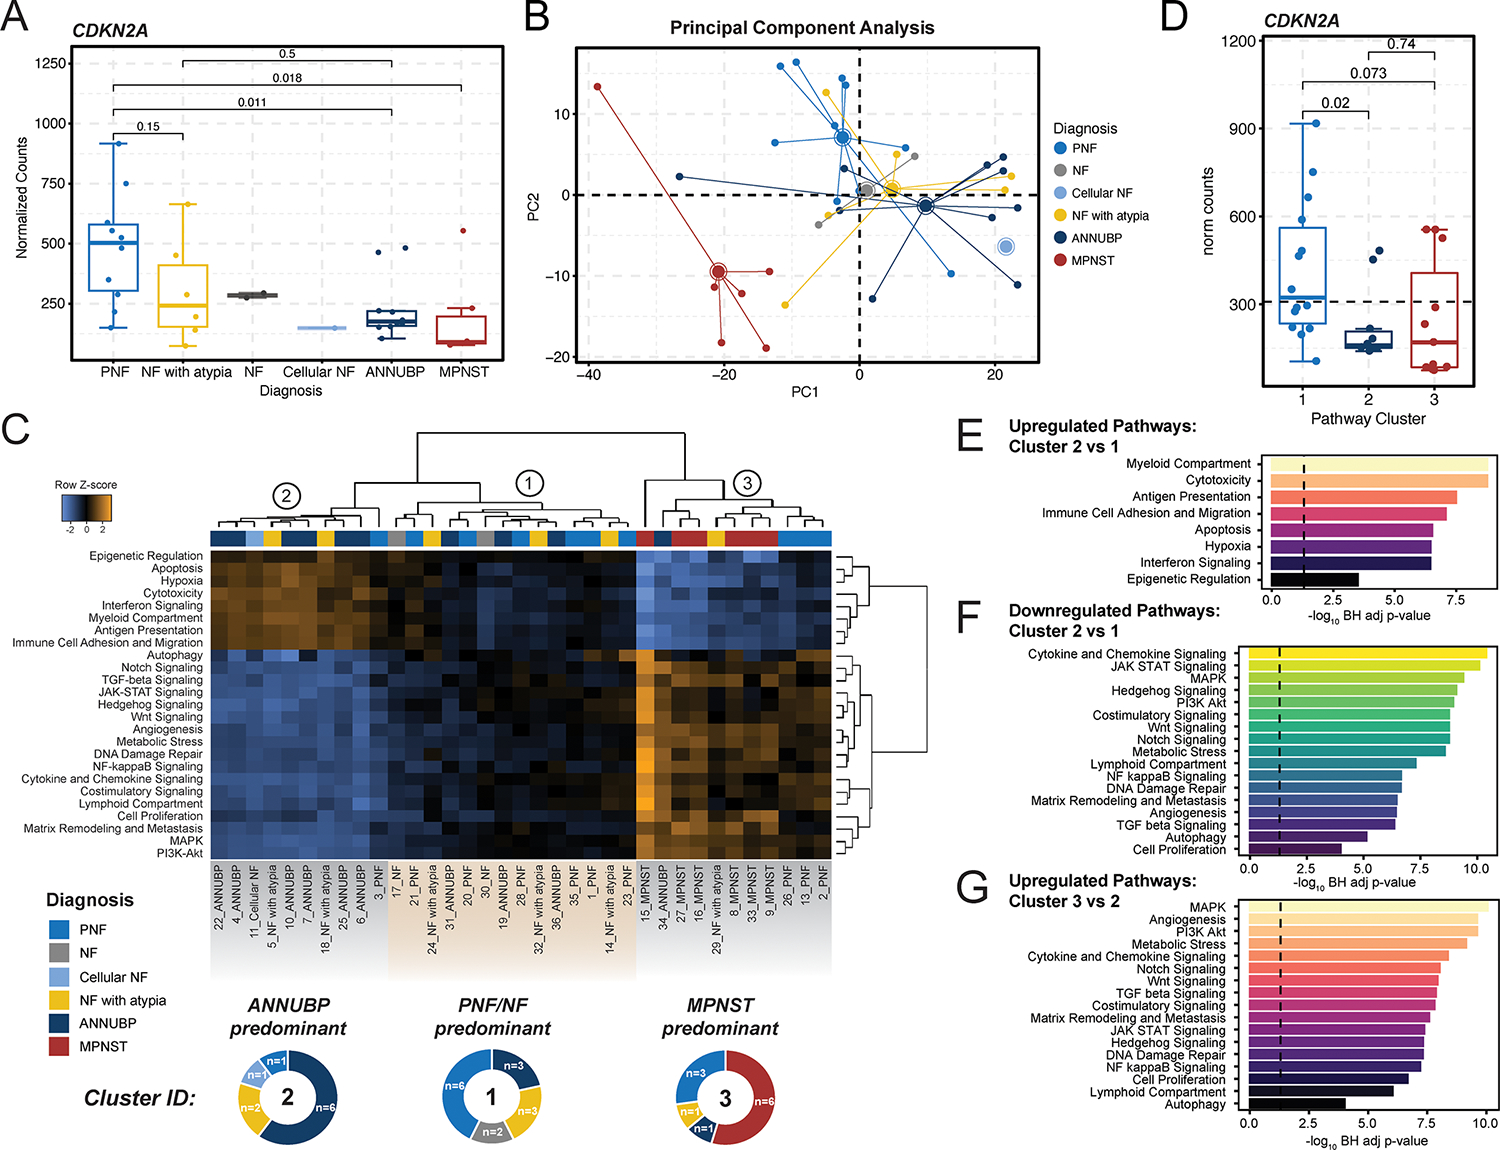
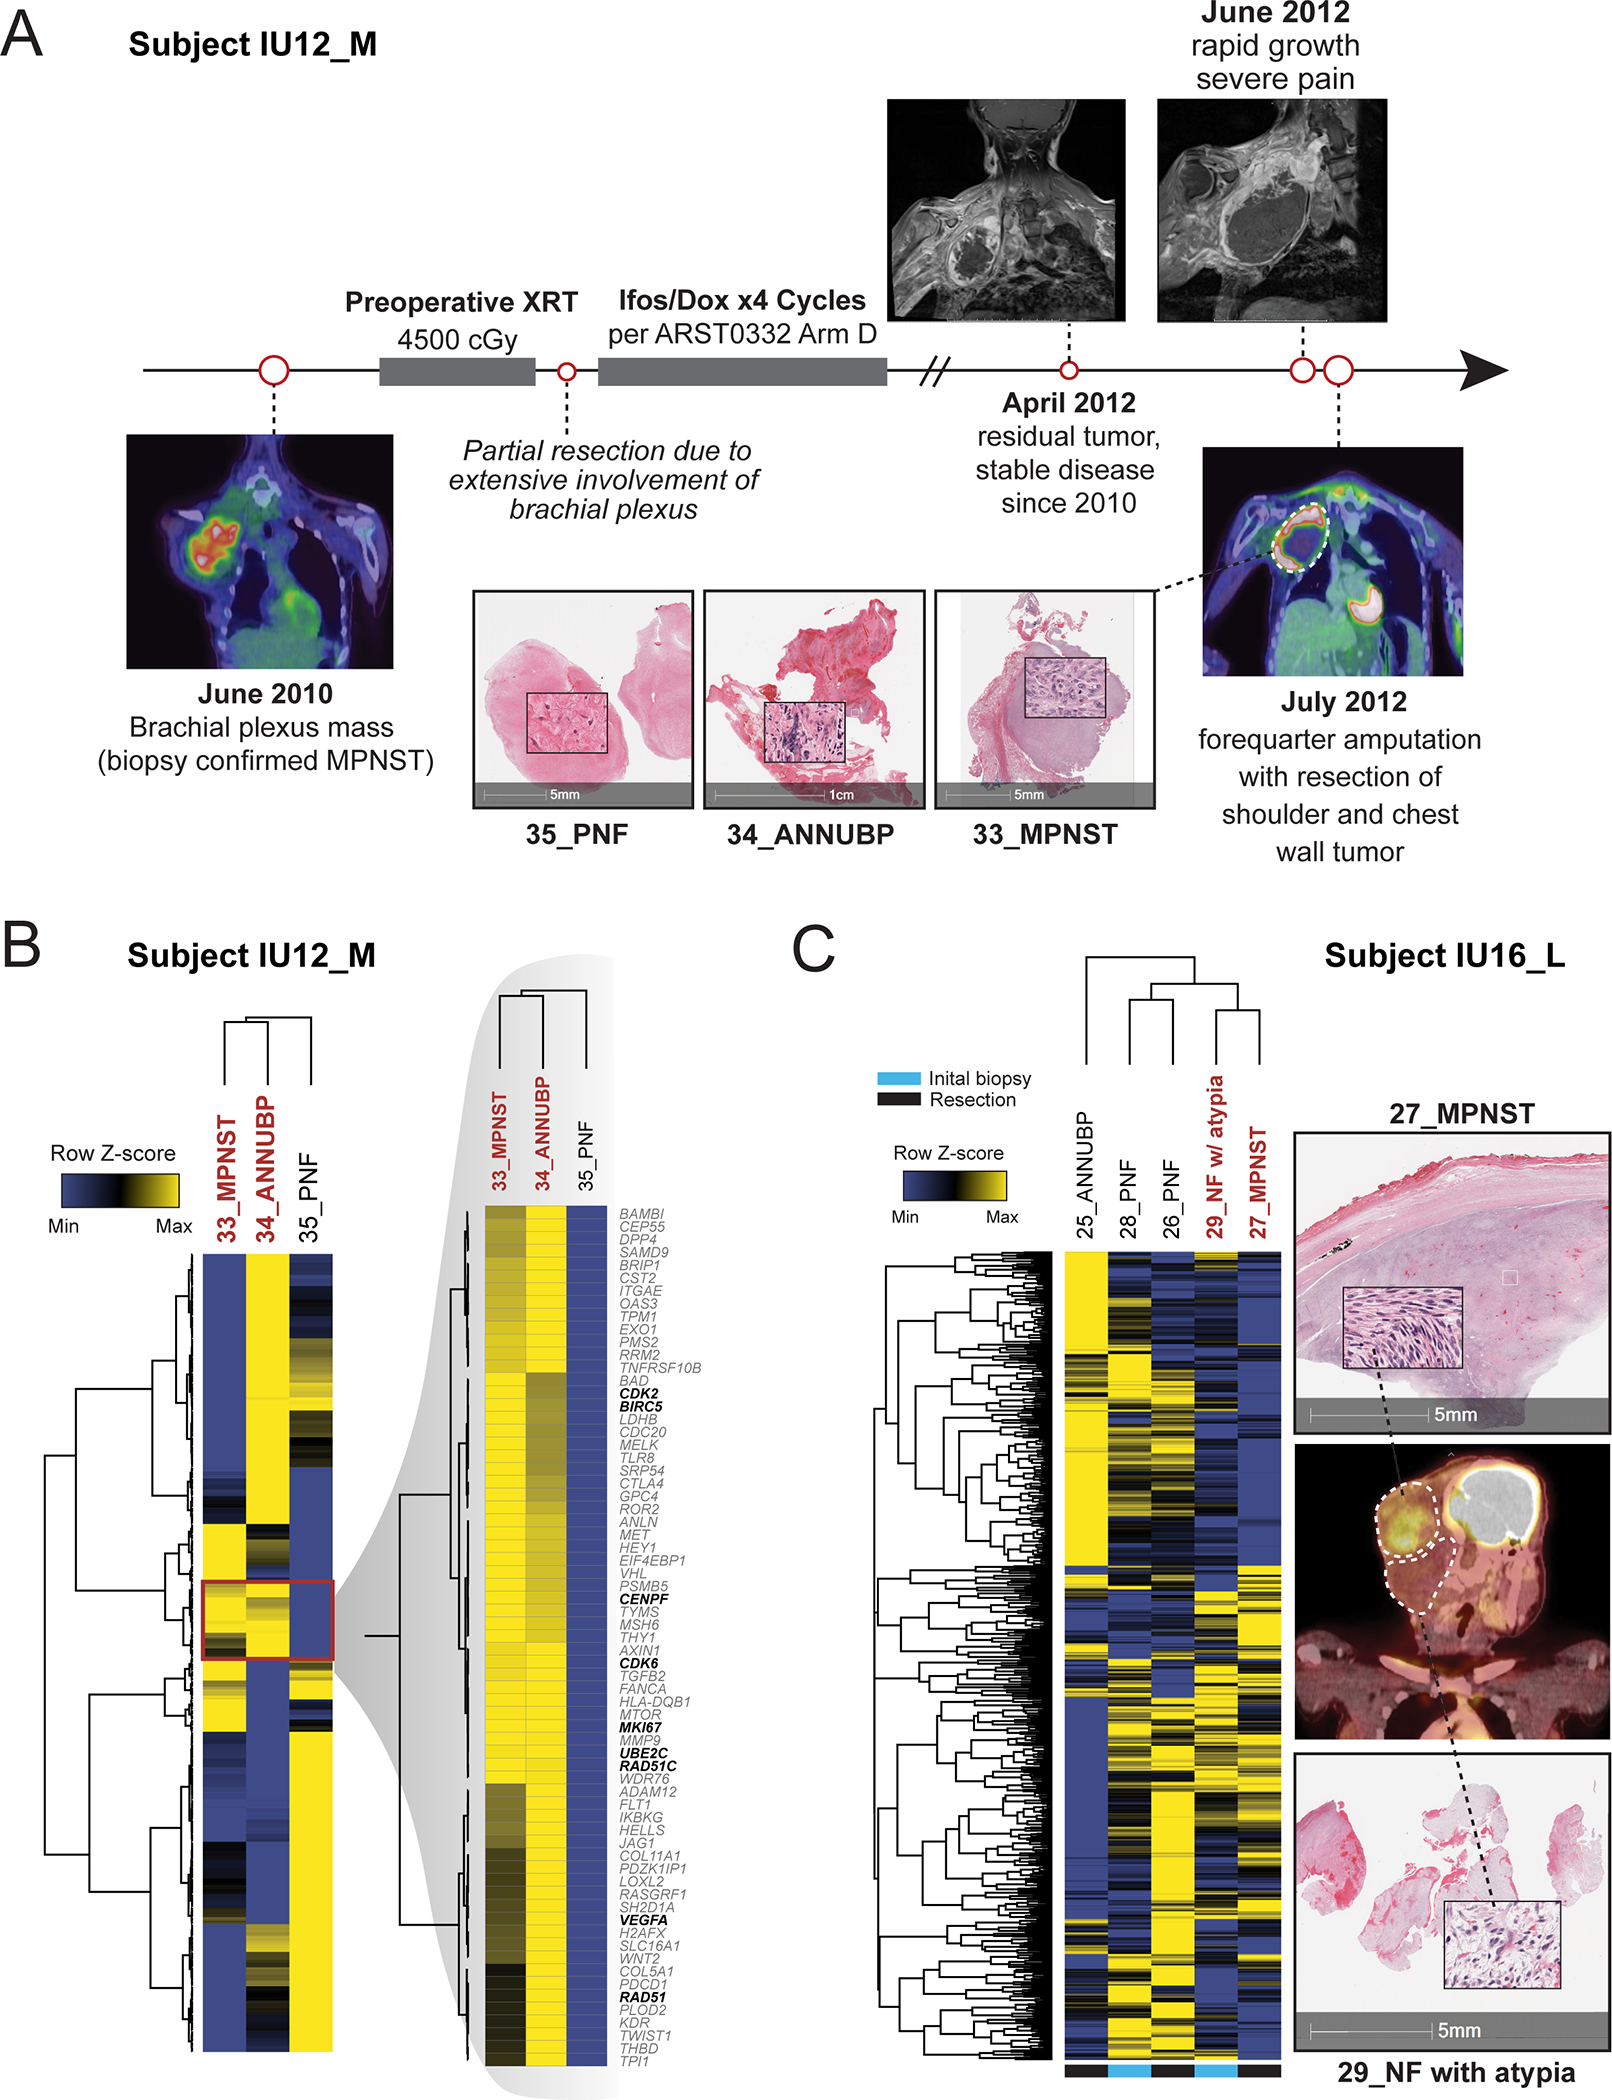
Purpose: Plexiform neurofibromas (PNF) are benign peripheral nerve sheath tumors (PNST) associated with neurofibromatosis type 1 (NF1). Despite similar histologic appearance, these neoplasms exhibit diverse evolutionary trajectories, with a subset progressing to malignant peripheral nerve sheath tumor (MPNST), the leading cause of premature death in individuals with NF1. Malignant transformation of PNF often occurs through the development of atypical neurofibroma (ANF) precursor lesions characterized by distinct histopathologic features and CDKN2A copy-number loss. Although genomic studies have uncovered key driver events promoting tumor progression, the transcriptional changes preceding malignant transformation remain poorly defined.

Experimental design: Here we resolve gene-expression profiles in PNST across the neurofibroma-to-MPNST continuum in NF1 patients and mouse models, revealing early molecular features associated with neurofibroma evolution and transformation.

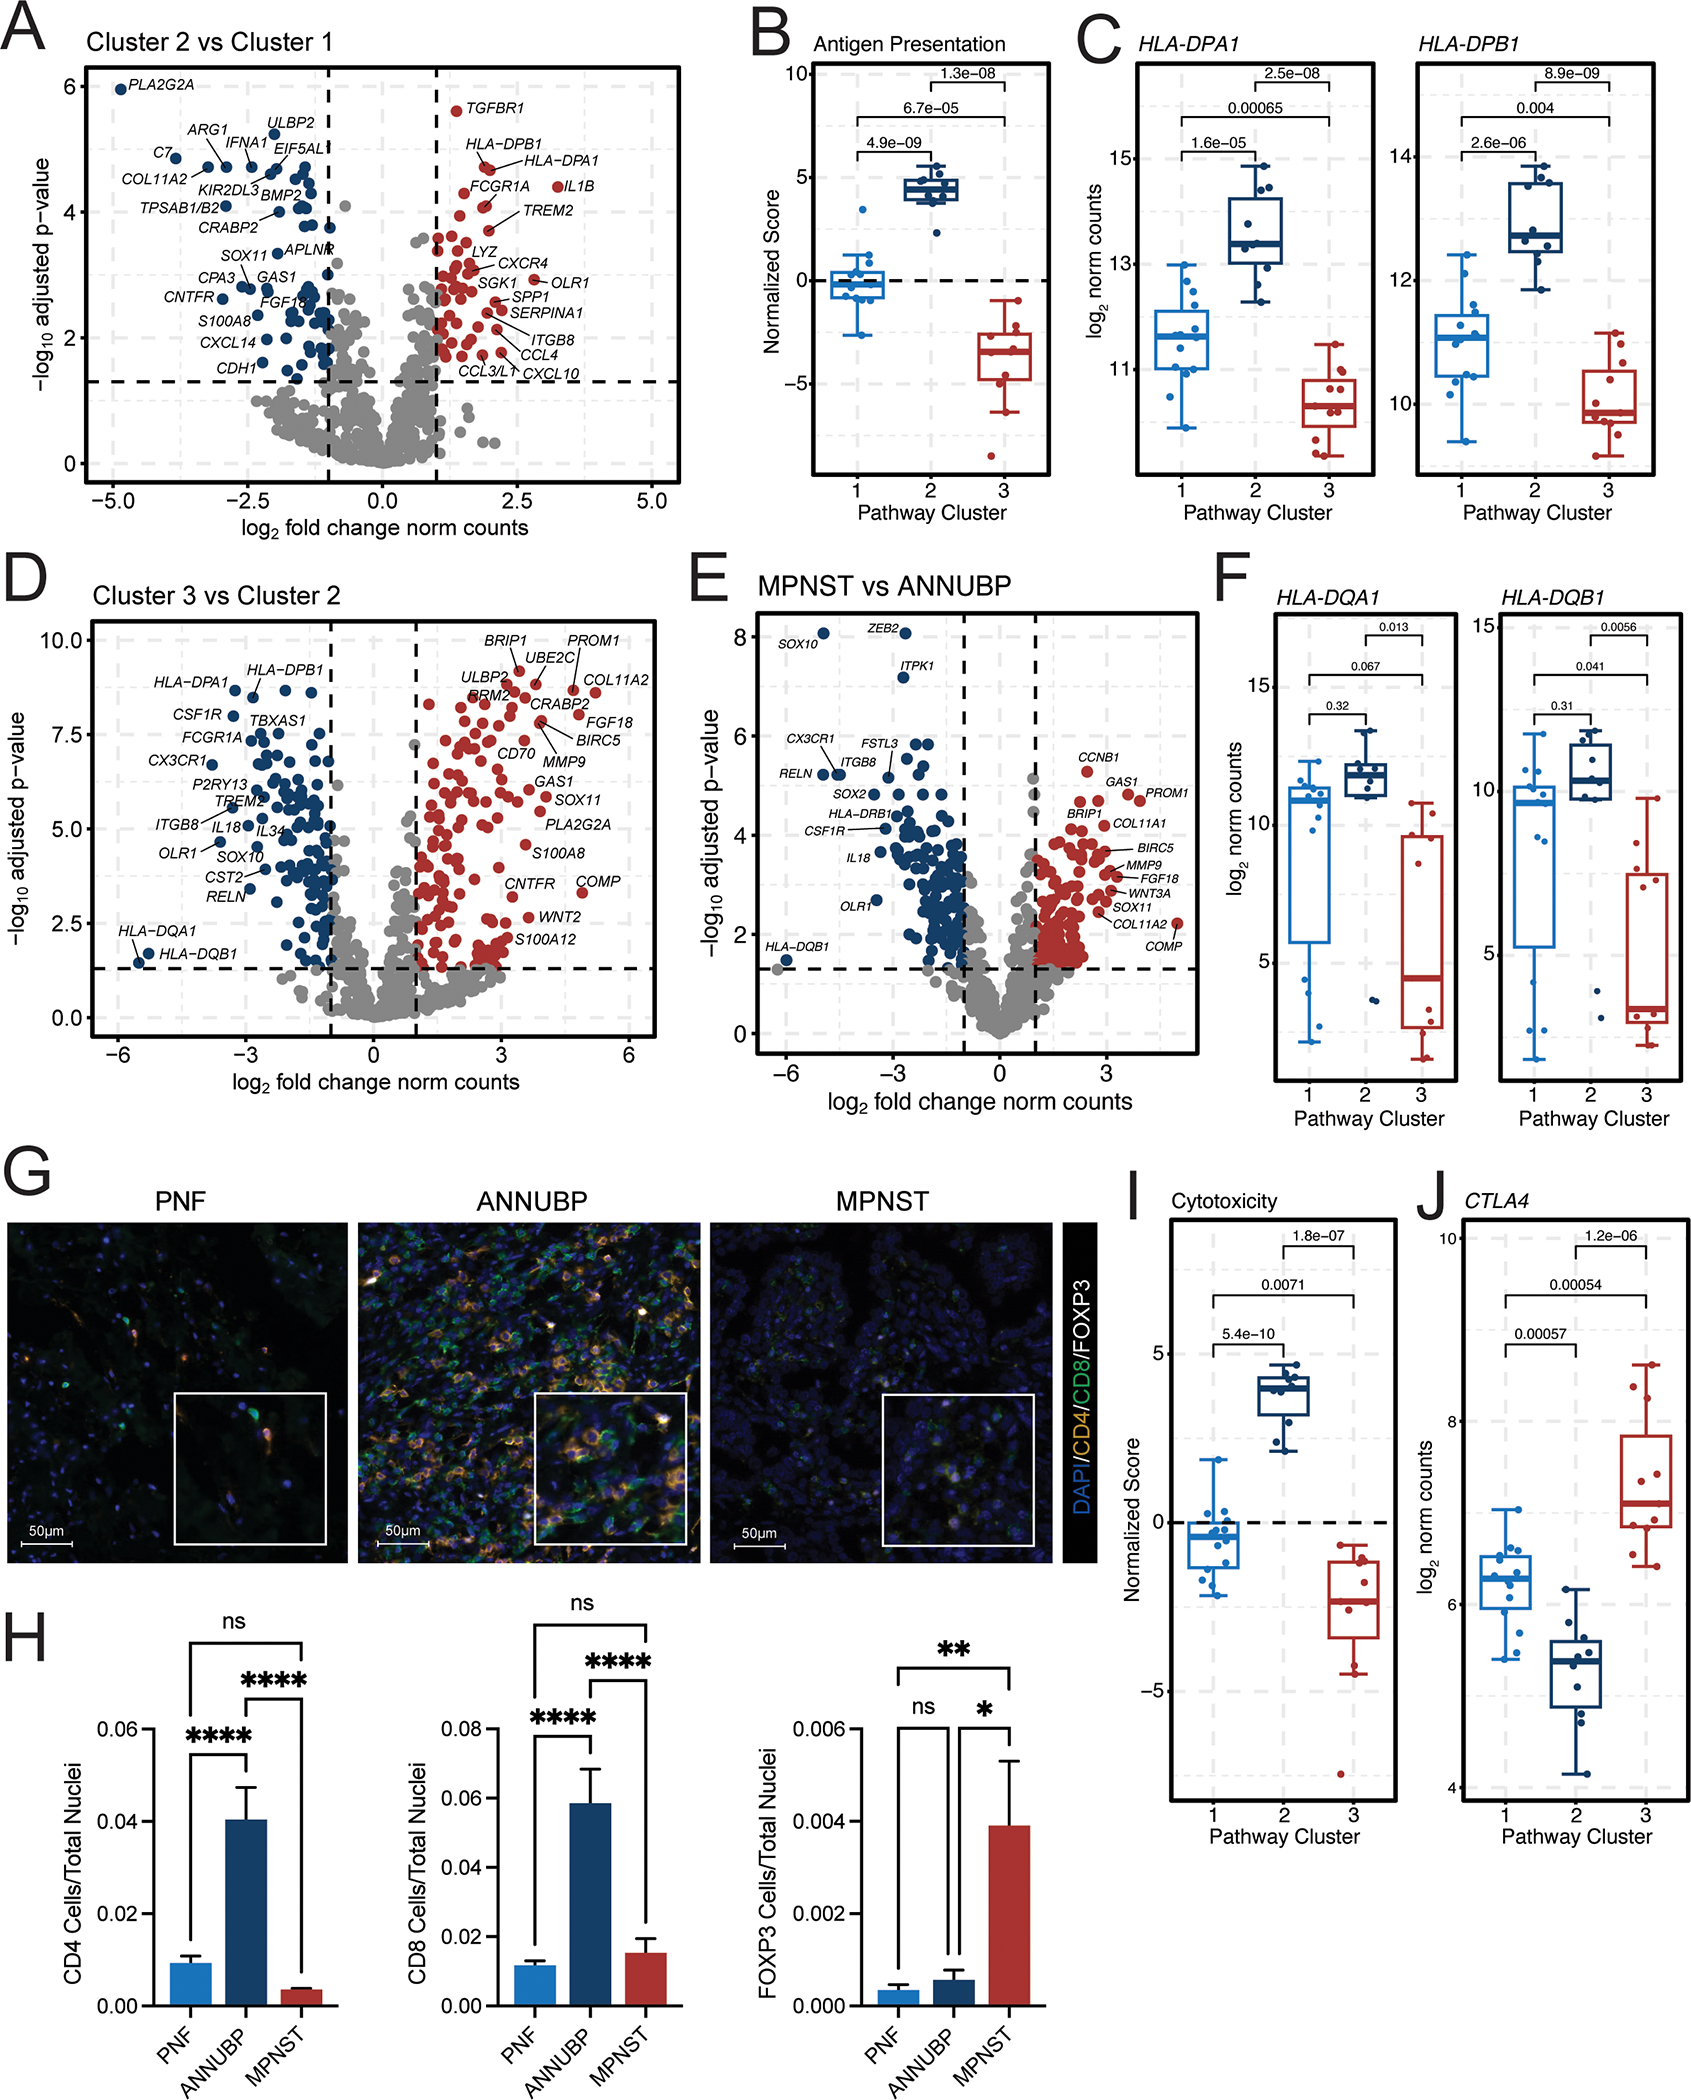
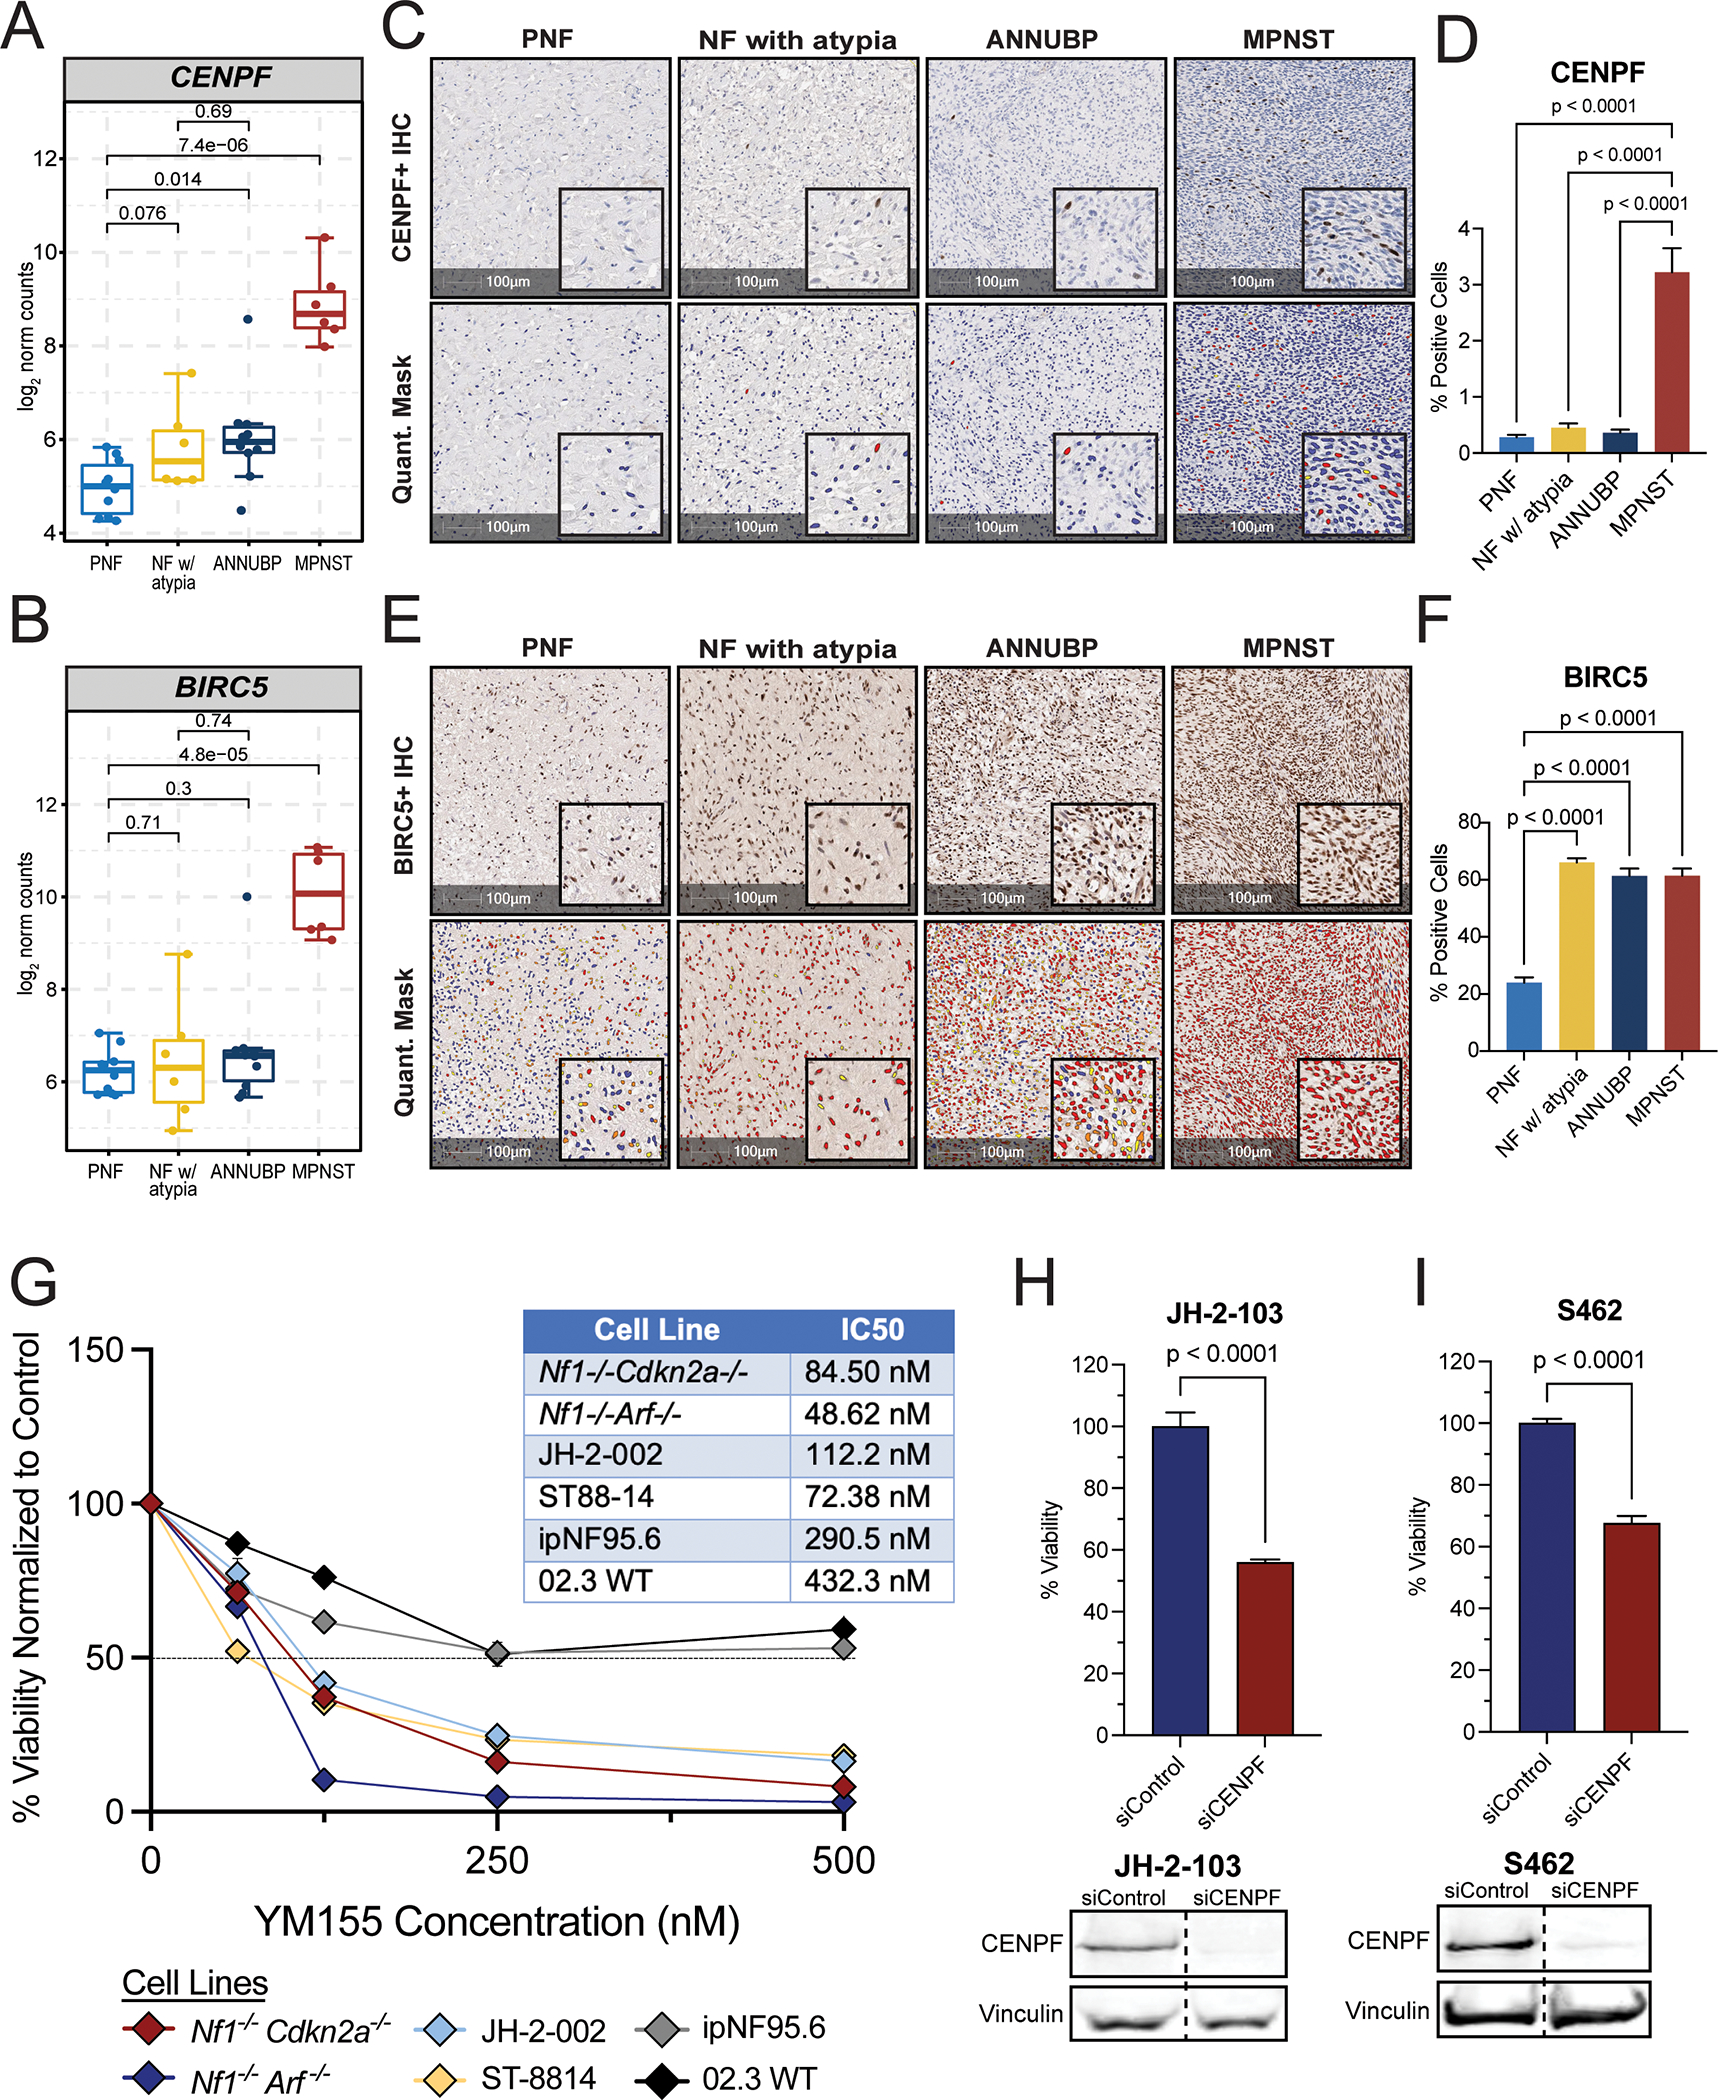
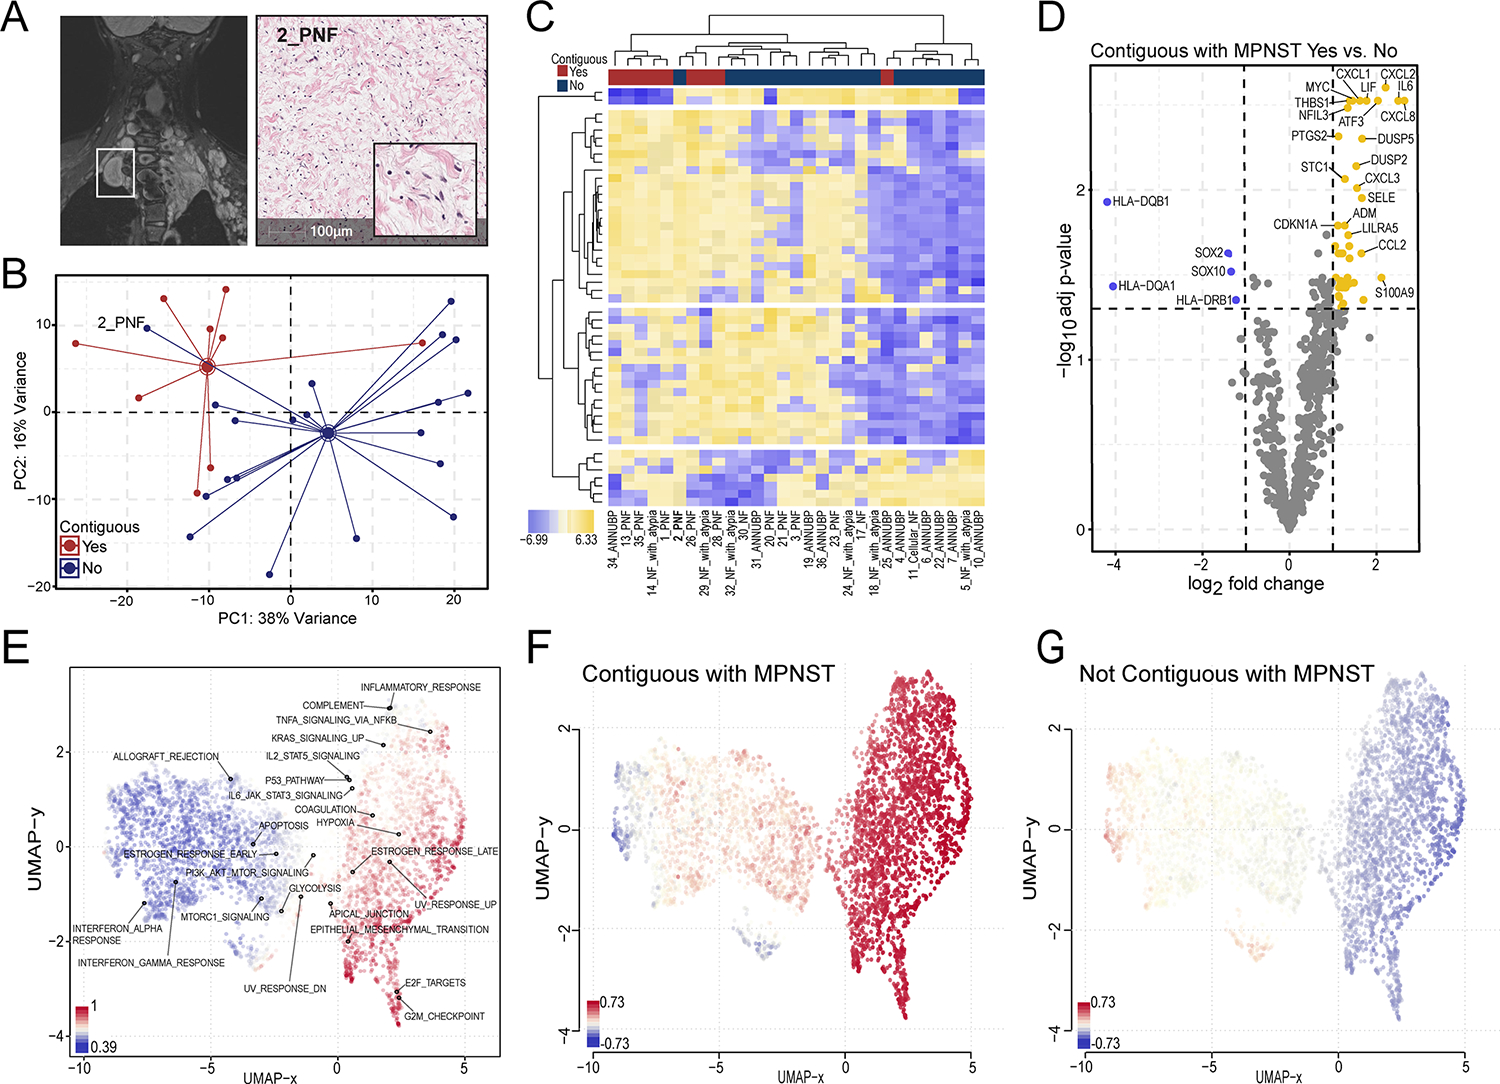
Results: Our findings demonstrate that ANF exhibit enhanced signatures of antigen presentation and immune response, which are suppressed as malignant transformation ensues. MPNST further displayed deregulated survival and mitotic fidelity pathways, and targeting key mediators of these pathways, CENPF and BIRC5, disrupted the growth and viability of human MPNST cell lines and primary murine Nf1-Cdkn2a-mutant Schwann cell precursors. Finally, neurofibromas contiguous with MPNST manifested distinct alterations in core oncogenic and immune surveillance programs, suggesting that early molecular events driving disease progression may precede histopathologic evidence of malignancy.

Conclusions: If validated prospectively in future studies, these signatures may serve as molecular diagnostic tools to augment conventional histopathologic diagnosis by identifying neurofibromas at high risk of undergoing malignant transformation, facilitating risk-adapted care.


Conflict of interest statement

Conflict of Interest Statement

The authors have no financial conflicts to disclose.

Figures

Figure 1.
Figure 1.. Spatial gene expression profiling of NF1-associated PNST.
(A) Donut plot depicting the distribution of samples by tissue diagnosis. (B) Stacked barplot illustrating the distribution of tumor subtypes by subject ID. (C) Representative photomicrographs of H&E-stained sections of each tumor subtype represented in the analysis including neurofibroma (NF), plexiform neurofibroma (PNF), cellular neurofibroma (cellular NF), neurofibroma with atypia (NF with atypia), atypical neurofibromatous neoplasm of uncertain biological potential (ANNUBP), and malignant peripheral nerve sheath tumor (MPNST). 5 mm (top panel) and 100 μm scale bars (bottom panel) denote the magnification, with insets at high power. (D) Schematic depicting experimental workflow and analysis. Tissue was microdissected from annotated regions and RNA was extracted for gene expression profiling using the using the Nanostring nCounter platform (IO360 panel).
Figure 2.
Figure 2.. Pathway analysis identifies three molecular NF1-PNST subclusters traversing conventional histopathological classifiers.
(A) Box and whisker plot depicting CDKN2A mRNA expression (normalized counts) by tumor subtype. Dots represent individual samples. Whiskers extend from the minima to maxima that are no further than 1.5x the inter-quartile range spanning the first to third quartiles. The center line represents the median. The box spans the 25th to 75th percentiles. Data beyond the whiskers are outliers and are plotted as individual points. P-values represent unpaired, two-tailed t-tests between groups. (B) Principal component analysis demonstrating global variation in gene expression between PNF (n=10), NF (n=2), cellular NF (n=1), NF with atypia (n=6), ANNUBP (n=10), and MPNST (n=6) based on principal components 1 and 2 (PC1 and PC2). (C) Heatmap of differentially expressed pathways. Rows represent individual pathways and their z-score normalized signature scores across each sample in the data. Columns represent individual samples, with annotation tracks above indicating tissue diagnosis as noted on the figure legend. Hierarchical clustering revealed three predominating clusters: Cluster 1 (n=14 samples), Cluster 2 (n=10 samples), and Cluster 3 (n=11 samples). Cluster 1 is predominately comprised of NF and PNF lesions, Cluster 2 of ANNUBP, and Cluster 3 of MPNST. The proportion of each tissue diagnosis within each cluster is illustrated in the donut plots below each cluster in the heatmap. (D) Box and whisker plot depicting CDKN2A mRNA expression (normalized counts) stratified by molecular cluster. Dots represent individual samples. Whiskers extend from the minima to maxima that are no further than 1.5x the inter-quartile range spanning the first to third quartiles. The center line represents the median. The box spans the 25th to 75th percentiles. Data beyond the whiskers are outliers and are plotted as individual points. P-values represent unpaired, two-tailed t-tests between groups. Barplots depicting differential enrichment of pan-cancer pathways relevant to tumor progression, immune response and microenvironment. Signatures are plotted in rank order based on −log10 Bejamini Hochberg adjusted p-values for pathways upregulated in Cluster 2 vs Cluster 1 (E), downregulated in Cluster 2 vs Cluster 1 (F) and upregulated in Cluster 3 vs Cluster 2 (G). The dashed line represents a false discovery rate of 0.05.
Figure 3.
Figure 3.. ANNUBP and Cluster 2 lesions are characterized by enhanced signatures of antigen presentation, immune surveillance and T cell infiltration.
(A) Volcano plots illustrating the top differentially expressed genes in Cluster 2 (n=10) versus Cluster 1 (n=14) lesions. The x-axis represents the log2 fold change in gene expression, whereas the y-axis represents the −log10 Benjamini Hochberg adjusted p-value. An adjusted p-value of 0.05 was set as the false discovery threshold as denoted by the dotted line. Genes with log2 fold changes ≥1 are colored red, whereas those with log2 fold changes ≤ −1 are colored blue. (B) Box and whisker plot of normalized antigen presentation signature scores in Cluster 1 (n=14), Cluster 2 (n=10), and Cluster 3 (n=11) tumors. Dots represent individual samples. Whiskers extend from the minima to maxima that are no further than 1.5x the inter-quartile range spanning the first to third quartiles. The center line represents the median. The box spans the 25th to 75th percentiles. Data beyond the whiskers are outliers and are plotted as individual points. P-values represent unpaired, two-tailed t-tests between groups as shown. (C) Box and whisker plots depicting HLA-DPA1 and HLA-DPB1 mRNA expression (normalized counts) stratified by molecular cluster. P-values represent unpaired, two-tailed t-tests between groups. (D) Volcano plot illustrating the top differentially expressed genes in Cluster 3 (n=11) vs Cluster 2 (n=10) lesions. (E) Volcano plot showing top differentially expressed genes in MPNST (n=6) vs ANNUBP (n=10). (F) Box and whisker plots depicting HLA-DQA1 and HLA-DQB1 mRNA expression (normalized counts) stratified by molecular cluster. (G) Representative photomicrographs of T cell subsets identified by immunofluorescence staining of CD4 (orange), CD8 (green) and FOXP3 (white) in PNF, ANNUBP and MPNST tissue sections. DAPI (blue) is shown as a nuclear counterstain. Magnification denoted by 100 μm scale bars with inset high-power magnification as shown. (H) Barplots reflecting quantitative analysis of T cell subsets normalized to the total number of nuclei per high power field (HPF). Error bars reflect standard error of the mean (SEM). PNF (n=6, ROI=30), ANNUBP (n=4, ROI=20) and MPNST (n=5, ROI=25) were analyzed by one-way ANOVA using Tukey’s multiple comparisons test. (I) Box and whisker plot of normalized cytotoxicity signature scores in Cluster 1 (n=14), Cluster 2 (n=10), and Cluster 3 (n=11) tumors. P-values represent unpaired, two-tailed t-tests between groups as shown. (J) Box and whisker plot depicting CTLA4 mRNA expression (normalized counts) stratified by molecular cluster. P-values represent unpaired, two-tailed t-tests between groups.
Figure 4.
Figure 4.. Genetic and pharmacologic disruption of BIRC5 and CENPF abrogates viability of human MPNST cell lines and primary murine Schwann cell precursors.
(A) Box and whisker plot depicting CENPF mRNA expression (log2 normalized counts) by tumor subtype: PNF (n=10), NF with atypia (n=6), ANNUBP (n=10), and MPNST (n=6). Dots represent individual samples. Whiskers extend from the minima to maxima that are no further than 1.5x the inter-quartile range spanning the first to third quartiles. The center line represents the median. The box spans that 25th to 75th percentiles. Data beyond the whiskers are outliers and are plotted as individual points. P-values represent unpaired t-tests between groups. (B) Box and whisker plot of BIRC5 mRNA expression (log2 normalized counts) by tumor subtype: PNF (n=10), NF with atypia (n=6), ANNUBP (n=10), and MPNST (n=6). P-values represent unpaired, two-tailed t-tests between groups. (C) Representative photomicrographs of tumor sections across the PNST continuum immunohistochemically stained for CENPF. Magnification is denoted by 100 μm scale bars with inset high-power magnification as shown. The HALO cytonuclear mask used to quantify CENPF staining is shown in the bottom panel. Blue cells indicate negative staining for CENPF, yellow indicate weak positive (1+), orange indicate moderate positive (2+) and red indicate strong positive (3+) CENPF staining. (D) Barplot depicting CENPF positive cells as a percentage of total cells per field. Error bars reflect standard error of the mean (SEM). PNF (n=5, ROI=42), NF with atypia (n=5, ROI=35), ANNUBP (n=6, ROI=49) and MPNST (n=4, ROI=49) were analyzed by one-way ANOVA using Tukey’s multiple comparisons test. (E) Representative photomicrographs of tumor sections across the PNST continuum immunohistochemically stained for BIRC5. Magnification denoted by 100 μm scale bars with inset high-power magnification as shown. The HALO cytonuclear mask used to quantify BIRC5 staining is shown in the bottom panel. Blue cells indicate negative staining for BIRC5, yellow indicate weak positive (1+), orange indicate moderate positive (2+) and red indicate strong positive (3+) BIRC5 staining. (F) Barplot depicting BIRC5+ cells as a percentage of total cells per field. Error bars reflect standard error of the mean (SEM). PNF (n=9, ROI=144), NF with atypia (n=4, ROI=38), ANNUBP (n=10, ROI=95) and MPNST (n=5, ROI=101) were analyzed by one-way ANOVA using Tukey’s multiple comparisons test. P-values represent unpaired, two-tailed t-tests between groups. (G) Mean viability of primary murine Schwann cell precursors (Nf1−/−;Cdkn2a−/− and Nf1−/−;Arf−/−), human MPNST cell lines (JH-2–002 and ST8814), and human wild-type (ipn02.3 2λ) and NF1 mutant Schwann cell lines (ipNF95.6) as a function of increasing concentrations of YM115 (Survivin inhibitor). Error bars represent SEM of n=6 technical replicates per condition. The experiment was repeated twice per cell line with similar results. The IC50 of each line was determined by nonlinear regression in GraphPad Prism and reported in the adjacent table. (H and I) Barplots depicting percent viability of human MPNST cells lines (JH-2–103 and S462) following siRNA-mediated depletion of CENPF (n=8 replicates per line) vs control (n=8 replicates per line). Error bars represent the SEM. P-values reflect unpaired, two-tailed t-tests between groups. The experiment was repeated three times and the graph reflects pooled results from all three experiments. CENPF protein expression was detected by western blot in human MPNST cell lines (JH-2–103 and S462) following transfection with siRNA against CENPF vs scrambled, non-targeting control. Vinculin is shown as the loading control.
Figure 5.
Figure 5.. Clinical vignettes.
(A) Subject IU12_M, a 17-year-old female with NF1 presented with a large, FDG-PET avid, right upper extremity mass confirmed to be high-grade MPNST on biopsy. Despite aggressive treatment with radiation, chemotherapy and attempted debulking, the patient had recurrence of disease two years after initial presentation. A forequarter amputation with resection of the shoulder and chest wall mass was performed. Multi-regional tissue sampling revealed regions of tumor consistent with PNF (35_PNF), ANNUBP (34_ANNUBP) and MPNST (33_MPNST). (B) Hierarchically clustered heatmap of all genes with inset magnification demonstrating overlapping molecular signatures shared by 34_ANNUBP and 35_MPNST. Select genes involved in cell cycle and mitotic fidelity, DNA repair and immune evasion are bolded. Rows represent individual genes and their respective expression log2 normalized, z-score transformed expression values across the three samples. Columns represent individual samples. Rows and columns were clustered by correlation coefficient with average linkage. (C) Multiregional profiling of subject IU16_L, a 13-year-old female with NF1 who presented with a right sided, FDG avid occipital mass. Multiple samples from an initial core needle biopsy (28-PNF, 29_NF with atypia) and from a subsequent surgical resection (26_PNF) sharing overlapping molecular signatures with the adjacent MPNST (27_MPNST). A hierarchically clustered heatmap of all genes is shown. Rows represent individual genes and their respective expression log2 normalized, z-score transformed expression values across each sample. Columns represent individual samples. Rows and columns were clustered by correlation coefficient with average linkage. Annotations below indicate the sample origin, whether from the initial biopsy or the subsequent tumor resection.
Figure 6.
Figure 6.. Neurofibromas contiguous with MPNST are transcriptionally distinct from discrete PNF/ANNUBPs not associated with malignant transformation.
(A) MRI and corresponding H&E-stained section of 2_PNF resected from subject IU13_B, an 8-year-old female with innumerable neurofibromas involving the mediastinal and cervical-thoracic paraspinal region. The lesion, enclosed in the white rectangle, appeared as a distinct nodular lesion on MRI. (B) Principal component analysis demonstrating distinct clustering of neurofibromas contiguous with MPNST (red) from discrete lesions not contiguous with MPNST (blue) across PC1 and PC2. (C) Heatmap depicting the expression pattern of the top 50 variable genes sorted by 2-way, unsupervised hierarchical clustering. Rows represent individual genes, and their respective log2 transformed, z-score normalized expression values across each sample in the data, with yellow corresponding to increased expression and blue to decreased expression according to the figure legend. Columns represent individual samples. Annotation tracks above indicate contiguity with MPNST. Sample IDs appear below. (D) Volcano plot showing the top differentially expressed genes in neurofibromas that were and were not contiguous with MPNST. The x-axis represents the log2 fold change in gene expression, whereas the y-axis represents the −log10 Benjamini Hochberg adjusted p-value. An adjusted p-value of 0.05 was set as the false discovery threshold denoted by the dotted line. Differentially expressed genes with log2 fold changes ≥1 are colored yellow, whereas those with log2 fold changes ≤ −1 are colored blue. (E) UMAP clustering of gene sets colored by standard-deviation (sd.X) using a covariance distance metric with superimposed annotations corresponding to Hallmark collection gene sets. UMAP clustering of gensets colored by relative expression comparing lesions contiguous with MPNST (F) versus neurofibromas not contiguous or associated with malignant transformation (G). Blue represents downregulation and red represents upregulation of gene sets as shown in the figure legend.

Similar articles

Cited by

References

    1. Martin GA, Viskochil D, Bollag G, McCabe PC, Crosier WJ, Haubruck H, et al. The GAP-related domain of the neurofibromatosis type 1 gene product interacts with ras p21. Cell 1990;63(4):843–9 doi 10.1016/0092-8674(90)90150-d. - DOI - PubMed
    1. Viskochil D, Buchberg AM, Xu G, Cawthon RM, Stevens J, Wolff RK, et al. Deletions and a translocation interrupt a cloned gene at the neurofibromatosis type 1 locus. Cell 1990;62(1):187–92 doi 10.1016/0092-8674(90)90252-a. - DOI - PubMed
    1. Gross AM, Singh G, Akshintala S, Baldwin A, Dombi E, Ukwuani S, et al. Association of plexiform neurofibroma volume changes and development of clinical morbidities in neurofibromatosis 1. Neuro Oncol 2018;20(12):1643–51 doi 10.1093/neuonc/noy067. - DOI - PMC - PubMed
    1. Nguyen R, Dombi E, Widemann BC, Solomon J, Fuensterer C, Kluwe L, et al. Growth dynamics of plexiform neurofibromas: a retrospective cohort study of 201 patients with neurofibromatosis 1. Orphanet J Rare Dis 2012;7:75 doi 10.1186/1750-1172-7-75. - DOI - PMC - PubMed
    1. Dombi E, Solomon J, Gillespie AJ, Fox E, Balis FM, Patronas N, et al. NF1 plexiform neurofibroma growth rate by volumetric MRI: relationship to age and body weight. Neurology 2007;68(9):643–7 doi 10.1212/01.wnl.0000250332.89420.e6. - DOI - PubMed

Publication types