. 2023 Dec 20;134(4):e172116.
doi: 10.1172/JCI172116.

Hyperactive mTORC1 in lung mesenchyme induces endothelial cell dysfunction and pulmonary vascular remodeling

Affiliations

Hyperactive mTORC1 in lung mesenchyme induces endothelial cell dysfunction and pulmonary vascular remodeling

Susan M Lin et al. J Clin Invest. .

Abstract

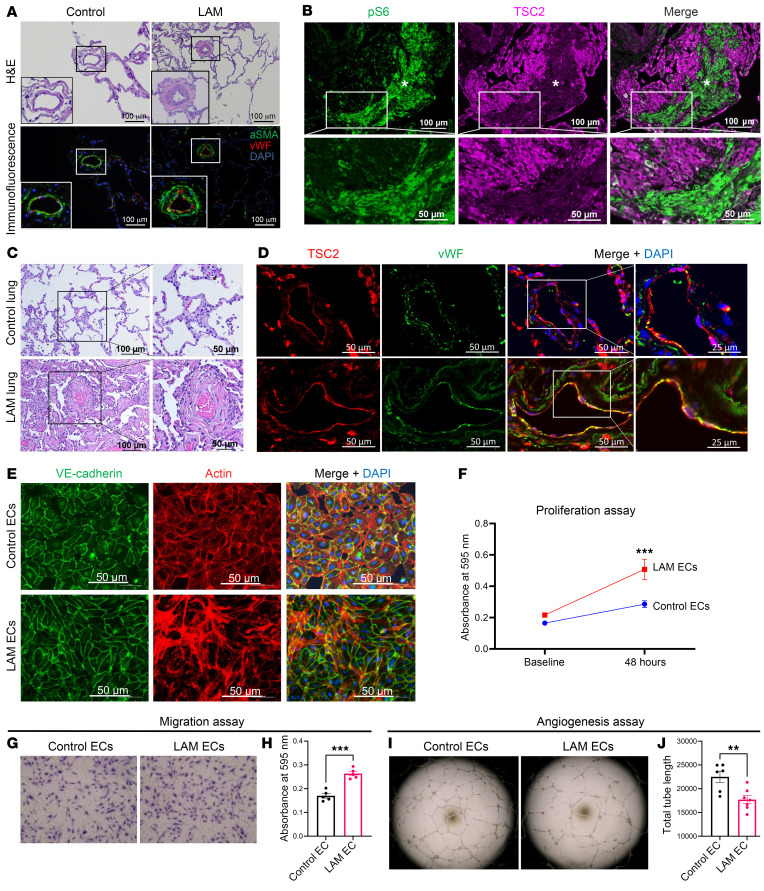
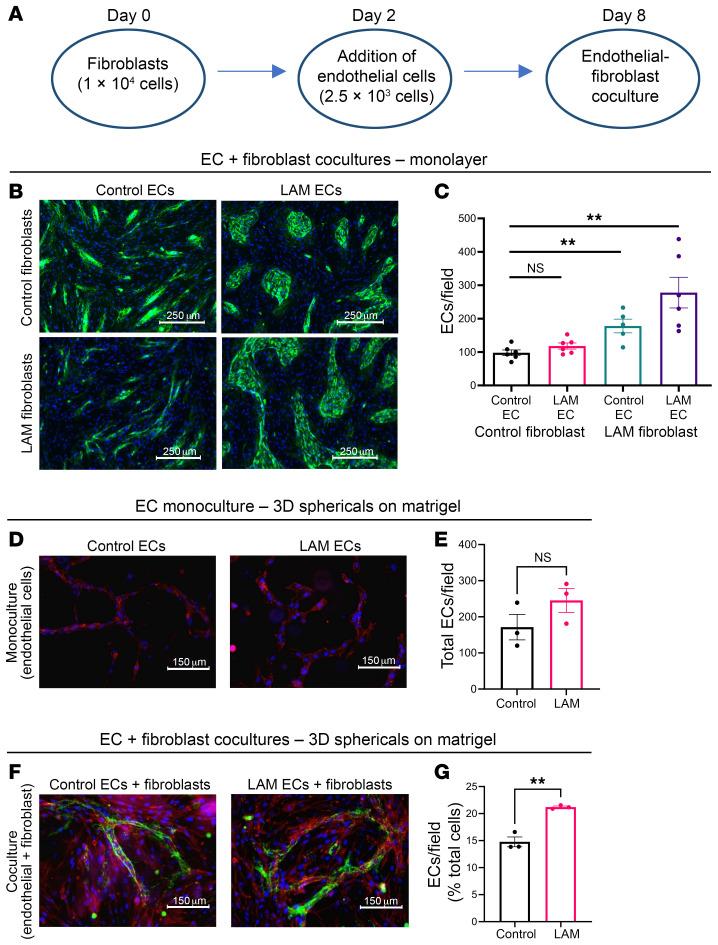
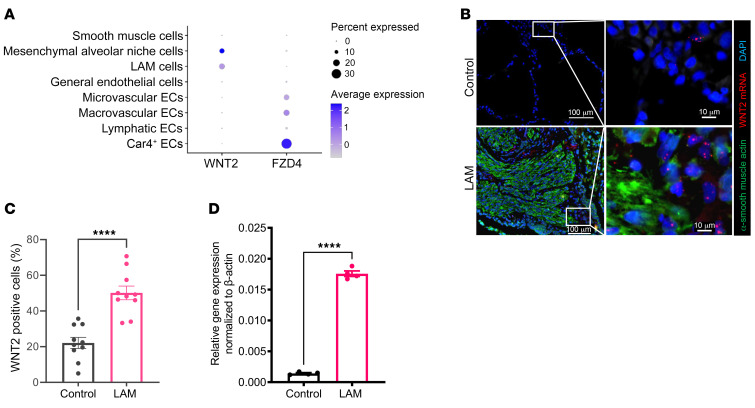
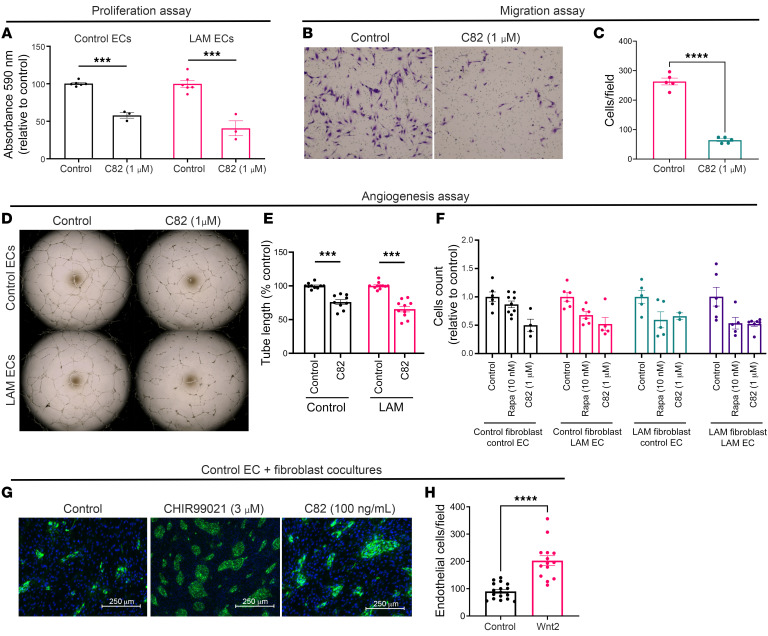
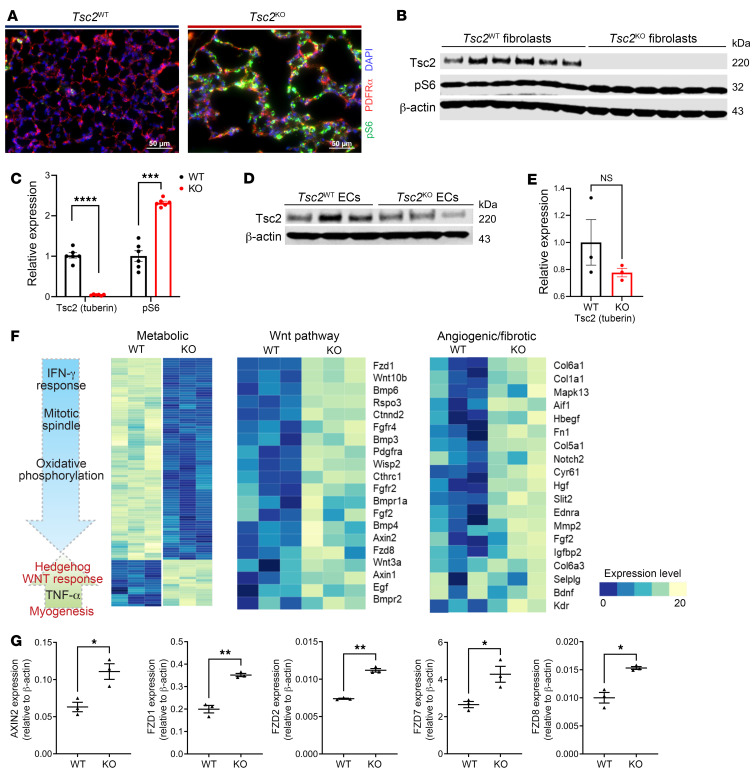
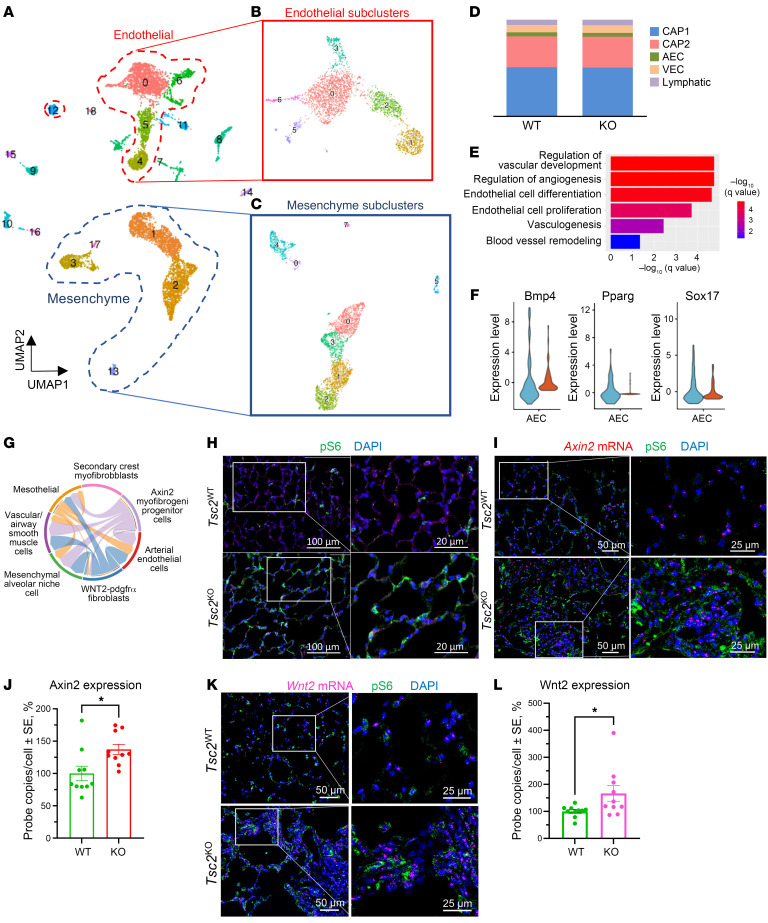
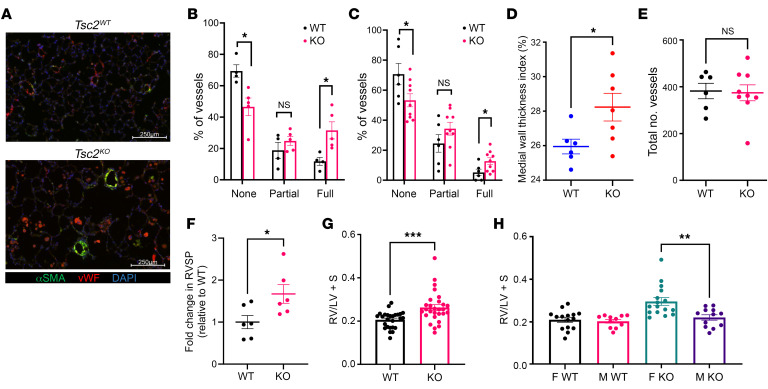
Lymphangioleiomyomatosis (LAM) is a progressive cystic lung disease caused by tuberous sclerosis complex 1/2 (TSC1/2) gene mutations in pulmonary mesenchymal cells, resulting in activation of the mechanistic target of rapamycin complex 1 (mTORC1). A subset of patients with LAM develop pulmonary vascular remodeling and pulmonary hypertension. Little, however, is known regarding how LAM cells communicate with endothelial cells (ECs) to trigger vascular remodeling. In end-stage LAM lung explants, we identified EC dysfunction characterized by increased EC proliferation and migration, defective angiogenesis, and dysmorphic endothelial tube network formation. To model LAM disease, we used an mTORC1 gain-of-function mouse model with a Tsc2 KO (Tsc2KO) specific to lung mesenchyme (Tbx4LME-Cre Tsc2fl/fl), similar to the mesenchyme-specific genetic alterations seen in human disease. As early as 8 weeks of age, ECs from mice exhibited marked transcriptomic changes despite an absence of morphological changes to the distal lung microvasculature. In contrast, 1-year-old Tbx4LME-Cre Tsc2fl/fl mice spontaneously developed pulmonary vascular remodeling with increased medial thickness. Single-cell RNA-Seq of 1-year-old mouse lung cells identified paracrine ligands originating from Tsc2KO mesenchyme, which can signal through receptors in arterial ECs. These ECs had transcriptionally altered genes including those in pathways associated with blood vessel remodeling. The proposed pathophysiologic mesenchymal ligand-EC receptor crosstalk highlights the importance of an altered mesenchymal cell/EC axis in LAM and other hyperactive mTORC1-driven diseases. Since ECs in patients with LAM and in Tbx4LME-Cre Tsc2fl/fl mice did not harbor TSC2 mutations, our study demonstrates that constitutively active mTORC1 lung mesenchymal cells orchestrated dysfunctional EC responses that contributed to pulmonary vascular remodeling.

Keywords: Cell Biology; Endothelial cells; Mouse models; Vascular Biology.


Conflict of interest statement

Conflict of interest: The authors have declared that no conflict of interest exists.

Figures

Figure 1
Figure 1. Characterization of pulmonary ECs from patients with LAM.
Representative images of H&E- and immunofluorescence-stained LAM lung (n = 3) compared with age- and sex-matched control human lung (n = 3) showing (A) remodeled distal vasculature detected with antibodies against vWF (red) and αSMA (green) and (B) increased intimal fibrosis and medial thickening by H&E staining. DAPI was used to detect nuclei (blue). Scale bars: 50 μm and 100 μm. Insets: Original magnification, ×2. (C) Representative images of dual immunofluorescence staining of human LAM lung (n = 3) demonstrating loss of TSC2 (tuberin, magenta) expression in a LAM lesion and concurrent activation of pS6 (marker of mTOR activation, green) and DAPI (nuclei, blue). White asterisks show LAM micronodules. Scale bars: 50 μm and 100 μm. (D) Representative images of positive immunoreactivity for TSC2 protein (tuberin, magenta) and vWF (green) in ECs lining the pulmonary vasculature in both human control (n = 4) and LAM lungs (n = 4). DAPI (nuclei, blue). Scale bars: 25 μm and 50 μm. (E) LAM and control pulmonary ECs labeled with antibodies against endothelial marker vWF (green) and F-actin (rhodamine phalloidin; red). Nuclei were counterstained with DAPI (blue). Scale bars: 50 μm. (F) Proliferation of control and LAM ECs over 48 hours using a crystal violet growth assay. (G) Representative images of migration of control (n = 5) and LAM (n = 5) ECs following a Boyden chamber assay. (H) Statistical analysis of EC migration quantified 24 hours after migration using 2-tailed t tests of crystal violet absorbence. (I) Representative image of in vitro angiogenesis in 2D of control (n = 6) and LAM (n = 6) ECs. (J) Total tube lengths at 24 hours of growth on Matrigel were analyzed using the Angiogenesis Analyzer plugin in ImageJ (NIH). Data are presented as the mean ± SEM. **P < 0.01 and ***P < 0.001, by 2-tailed t test.
Figure 2
Figure 2. Increased EC proliferation and in vitro vasculogenesis in 3D EC-fibroblast coculture systems.
(A) Schematic for EC-fibroblast coculture experiments. (B) Representative images of EC-fibroblast cocultures in a monolayer at day 8 using primary cells isolated from LAM lung explants and age-matched control human lung. ECs were stained with vWF (green) and nuclei were counterstained with DAPI (blue). Scale bars: 250 μm. Original magnification, ×10 and ×20. (C) Quantification of the number of ECs per field in the EC-fibroblast cocultures. (D) Representative images of 3D control (n = 3) and LAM (n = 3) EC sphericals in serum-free Matrigel matrix. Cells were stained with rhodamine phalloidin (red) to visualize EC structures. Scale bars: 150 μm. (E) Quantification of the total number of ECs per field by nonparametric Kruskal-Wallis ANOVA with Siegel (Bonferroni’s) correction. (F) Representative images of 3D sphericals with control (n = 3) and LAM (n = 3) ECs grown in the presence of fibroblasts from control human and LAM lung, respectively, on serum-free Matrigel matrix. ECs were immunostained with vWF (green), and nuclei were counterstained with DAPI (blue). (G) Quantification of ECs per field (percentage of total cells) in 3D cocultures. **P < 0.01, by nonparametric Kruskal-Wallis ANOVA test with Siegel (Bonferroni’s) correction for post hoc, pairwise contrasts (C, E, and G).
Figure 3
Figure 3. Identification of WNT2 in LAM lung mesenchyme.
(A) Gene expression dot plot highlighting the unique expression of WNT2 in LAM cell clusters and MANC clusters with corresponding FZD4, a WNT2 receptor, in Car4+ EC subclusters within LAM lung. (B) Representative images of dual staining with WNT2 mRNAscope (red) ISH and αSMA (green) of LAM (n = 3) and control (n = 3) human lung. DAPI (blue) shows nuclei. Scale bars: 10 μm and 100 μm. (C) Statistical analysis of WNT2 mRNA–positive cells in control compared with LAM lungs calculated as a percentage of WNT2+ cells per total number of cells, as described in Methods. (D) Validation of WNT2 mRNA transcripts in mRNA samples isolated from the lung mesenchyme of control (n = 4) and LAM (n = 4) lungs. Data points represent relative gene expression values normalized to the expression of the ACTB gene using the ΔΔCt method. ****P < 0.0001, by nonparametric t test comparisons (C and D).
Figure 4
Figure 4. Inhibition of WNT suppresses EC proliferation, migration, and angiogenesis.
(A) Control ECs (n = 6) and LAM ECs cells (n = 3) were treated with 1 μM of the WNT inhibitor C82 followed by a proliferation assay as described in Methods. (B) Representative images of migration of ECs from LAM lung treated with 1 μM C82 or diluent (control). Original magnification, ×10. (C) Statistical analysis of LAM EC migration calculated as the number of cells/field in control (n = 5) versus 1 μM C82-treated LAM ECs (n = 5). (D) Representative images from angiogenesis assay of control ECs and LAM ECs treated with diluent or 1 μM C82. (E) Analysis of total tube length of control ECs compared with LAM ECs was performed using the Angiogenesis Analyzer plugin on ImageJ followed by statistical analysis by 2-tailed t test, with the control condition taken as 100%. (F) Effect of 10 nM rapamycin and 1 μM C82 on EC-fibroblast cocultures. (G) EC-fibroblast cocultures of control human ECs with control human lung fibroblasts were treated with diluent (control) and stimulated with the pan-WNT pathway activator CHIR99021 (3 μM) or WNT2 (100 ng/mL). n = 3 per treatment group. Scale bars: 250 μm. (H) Statistical analysis of ECs per field (with a minimum of 4 images per well) in cocultures treated with WNT2 was performed using a 2-tailed t test, and data are presented as the mean ± SEM. ***P < 0.001 and ****P < 0.0001 (A, C, E, and H). Nonparametric t test (Mann-Whitney) (A and E).
Figure 5
Figure 5. Differential gene expression in CD31+ vascular ECs from Tbx4LME-Cre Tsc2KO mouse lung.
(A) Representative images of immunofluorescence staining of distal lung demonstrate pS6 positivity, a marker of mTORC1 upregulation (green) in PDGFRα (red) mesenchymal cells of 8-week-old Tbx4LME-Cre Tsc2KO (Tsc2KO) mouse lungs. Scale bars: 50 μm. (B) Immunoblot of Tsc2 and pS6 protein expression in Tsc2WT (n = 3 in duplicates) and Tsc2KO (n = 3 in duplicates) lung fibroblasts from 12-week-old mice. (C) Densitometric analysis of Tsc2 and pS6 levels normalized to β-actin in each lane with average levels in Tsc2WT fibroblasts taken as 1. (D) Immunoblot of Tsc2 expression in lung ECs from 8-week-old Tsc2WT (n = 3) and Tsc2KO (n = 3) mice. (E) Densitometric analysis of Tsc2 normalized to β-actin in each lane, with the average expression levels in Tsc2WT set as 1. (F) Heatmap of the top differentially expressed genes in lung ECs isolated from Tsc2WT (n = 3) and Tsc2KO (n = 3) mice. (G) qPCR of Wnt pathway activation of Axin2, ligands, and receptors in lung ECs from 8-week-old Tsc2WT (n = 3) and Tsc2KO (n = 3) mice. Data are presented as the mean ± SEM. *P < 0.05, **P < 0.01, ***P < 0.001, and ****P < 0.0001, by 2-tailed t test.
Figure 6
Figure 6. Transcriptomic heterogeneity of ECs in Tbx4LME-Cre Tsc2KO mouse lung.
(A) UMAP representation of Tsc2WT and Tsc2KO mouse lung (n = 2) scRNA-Seq, with cell populations labeled according to the corresponding cell type. (B) ECs, marked by Pecam1 and vWF expression, were reclustered into 6 subclusters. (C) Mesenchymal cells, marked by Pdgfrα, Pdgfrβ and Msln expression, were reclustered into 8 subclusters. (D) Distribution of each EC type within the EC subclusters. (E) GO enrichment analysis of the AEC cluster. (F) Violin plot demonstrating increased expression of Bmp4, Pparg, and Sox17 in AECs from Tsc2KO mice compared with AECs from Tsc2WT mice. (G) Wnt signaling pathway network (chord diagram) with incoming signal to AECs from 3 mesenchymal cell populations including Axin2 myofibrogenic progenitors, Wnt2-Pdgfrα cells, and mesothelial cells. (H) Representative images of 54-week-old Tsc2WT (n = 3) and Tsc2KO (n = 3) lung for pS6 (marker of mTORC1 upregulation; magenta); light green reflects an autofluorescence from structural proteins in lung mesenchyme. DAPI (blue) was used to detect nuclei. Scale bars: 20 μm and 100 μm. (I) Representative images of dual staining of 54-week-old Tsc2WT (n = 3) and Tsc2KO (n = 3) lung for Axin2 mRNA (magenta) and pS6 (green). Scale bars: 25 μm and 50 μm. (J) Quantification of the Axin2 mRNA data shown in I. (K) Pulmonary vasculature in both Tsc2WT and Tsc2KO with Wnt2 mRNA (magenta) and pS6 (green) from single-molecule fluorescent ISH. Scale bars: 25 μm and 50 μm. (L) Quantification of the Wnt2 mRNA data shown in K. Data are presented as the mean ± SEM. *P < 0.05, by 2-tailed t test.
Figure 7
Figure 7. Pulmonary vascular remodeling and right heart dysfunction in 1-year-old Tbx4LME-Cre Tsc2KO mice with mesenchymal mTOR activation.
(A) Representative images of vessels in Tsc2WT compared with Tsc2KO in 1-year-old mice. Scale bar: 250 μm. (B) Scoring of peripheral muscularization based on 15 randomly acquired images per mouse (n = 9). (C) Peripheral muscularization based on automated measurements obtained on Visiomorph. Morphometric analysis of pulmonary vascular remodeling in Tsc2KO (n = 9, red) mice compared with Tsc2WT mice (n = 6, blue). (D) Medial wall thickness based on Visiomorph. Medial wall thickness was defined as: (vessel diameter minus luminal diameter)/2. Comparison of Tsc2WT (n = 6) to Tsc2KO (n = 7). (E) Total number of vessels unchanged in Tsc2WT versus Tsc2KO. (F) Right heart catheterization of 1-year-old Tsc2WT (n = 6) and Tsc2KO (n = 6) mice with comparison of RVSP in terms of fold change relative to baseline Tsc2WT RVSP of 12.9 mmHg. (G) RVH as measured by the Fulton index (RV/S + LV); Tsc2WT (n = 25) versus Tsc2KO (n = 27). (H) Increased Fulton indices were driven by female Tsc2KO mice (n = 13) compared with male Tsc2KO mice (n = 11). Data are presented as the mean ± SEM. *P < 0.05, **P < 0.01, and ***P < 0.001, by 2-tailed t test.

Similar articles

Cited by

References

    1. Harari S, et al. Lymphangioleiomyomatosis: what do we know and what are we looking for? Eur Respir Rev. 2011;20(119):34–44. doi: 10.1183/09059180.00011010. - DOI - PMC - PubMed
    1. Henske EP, et al. Tuberous sclerosis complex. Nat Rev Dis Primers. 2016;2:16035. doi: 10.1038/nrdp.2016.35. - DOI - PubMed
    1. Henske EP, McCormack FX. Lymphangioleiomyomatosis - a wolf in sheep’s clothing. J Clin Invest. 2012;122(11):3807–3816. doi: 10.1172/JCI58709. - DOI - PMC - PubMed
    1. Krymskaya VP, McCormack FX. Lymphangioleiomyomatosis: a monogenic model of malignancy. Annu Rev Med. 2017;68:69–83. doi: 10.1146/annurev-med-050715-104245. - DOI - PMC - PubMed
    1. McCarthy C, et al. Lymphangioleiomyomatosis: pathogenesis, clinical features, diagnosis, and management. Lancet Respir Med. 2021;9(11):1313–1327. doi: 10.1016/S2213-2600(21)00228-9. - DOI - PubMed

MeSH terms

Substances

Supplementary concepts