. 2024 Dec 21;134(5):e174508.
doi: 10.1172/JCI174508.

Mechanosensitive channels TMEM63A and TMEM63B mediate lung inflation-induced surfactant secretion

Affiliations

Mechanosensitive channels TMEM63A and TMEM63B mediate lung inflation-induced surfactant secretion

Gui-Lan Chen et al. J Clin Invest. .

Abstract

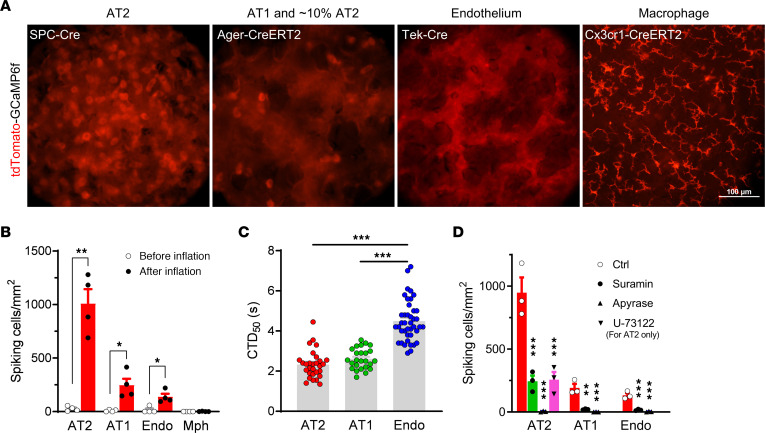
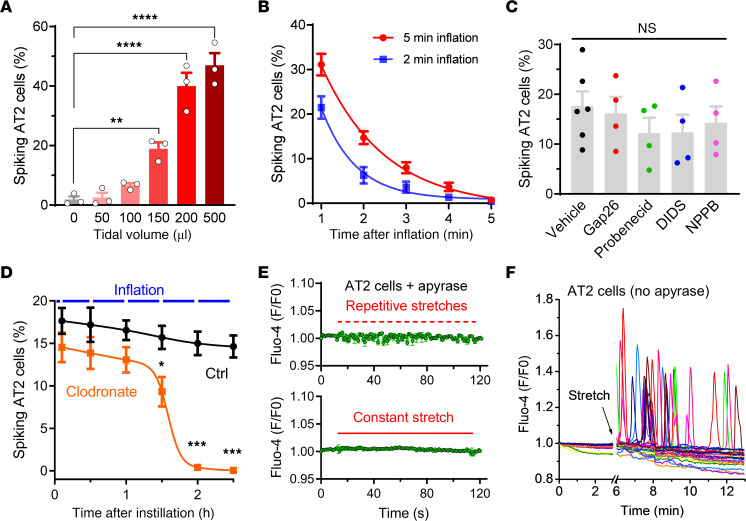
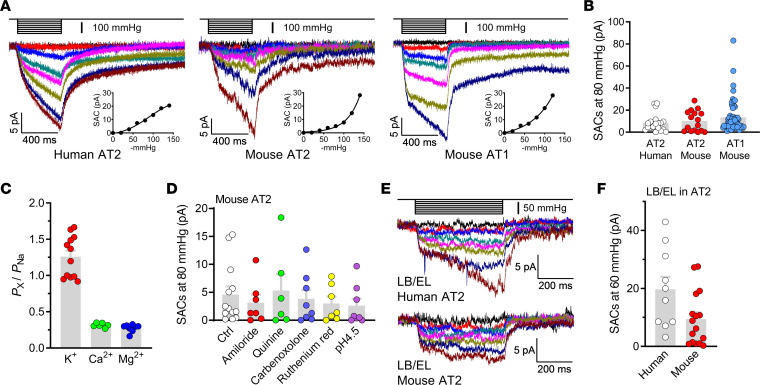
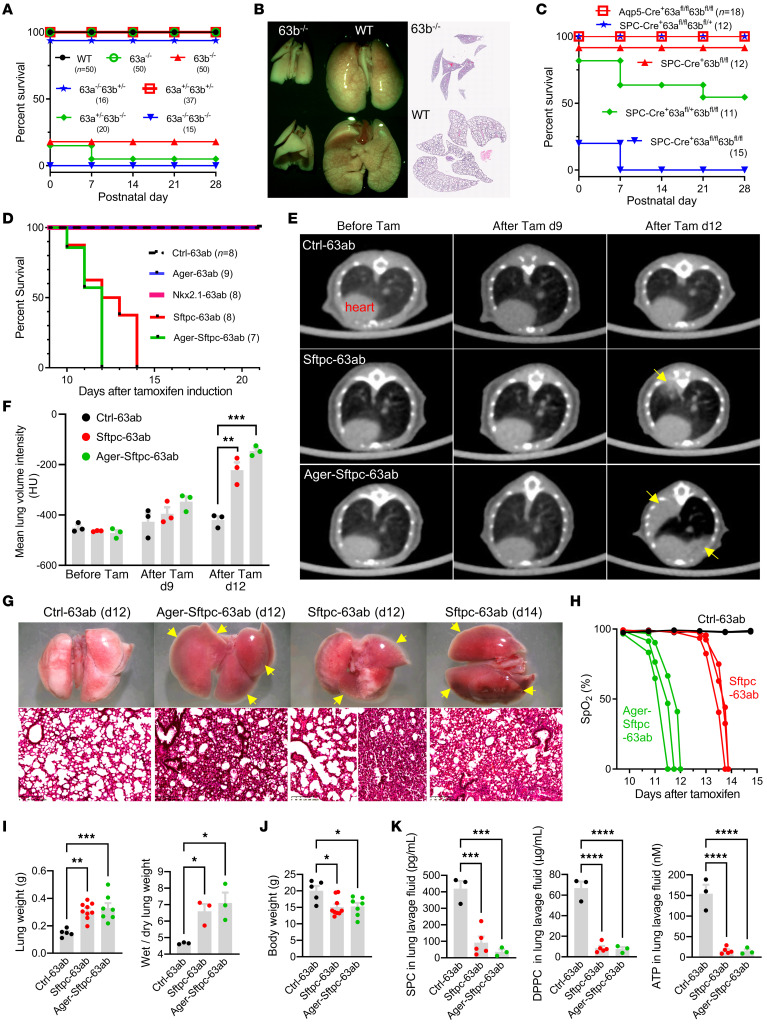
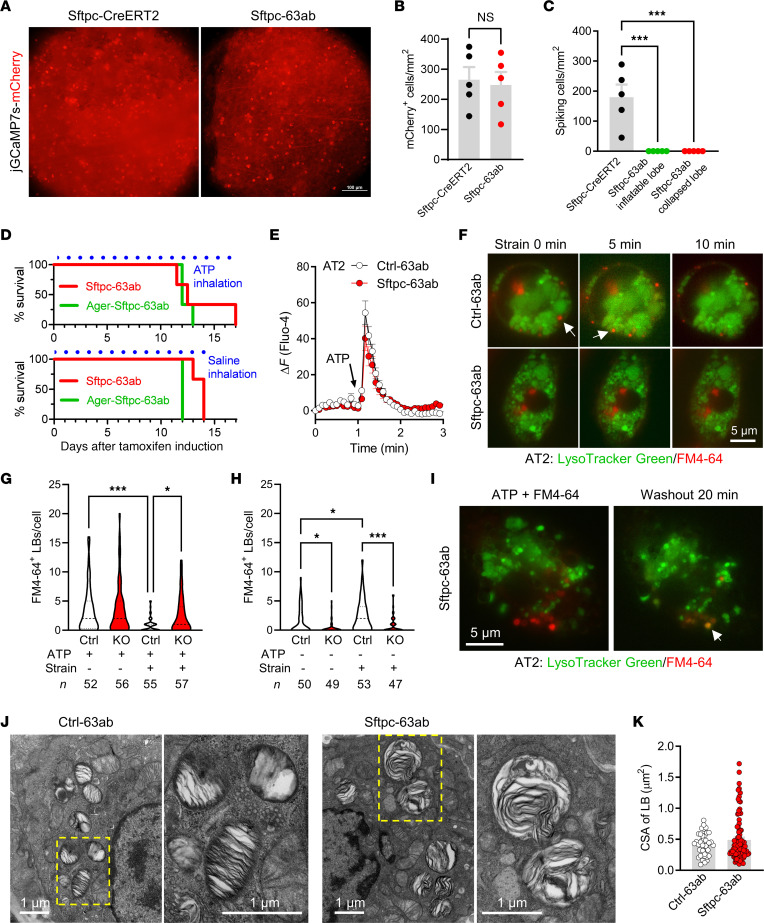
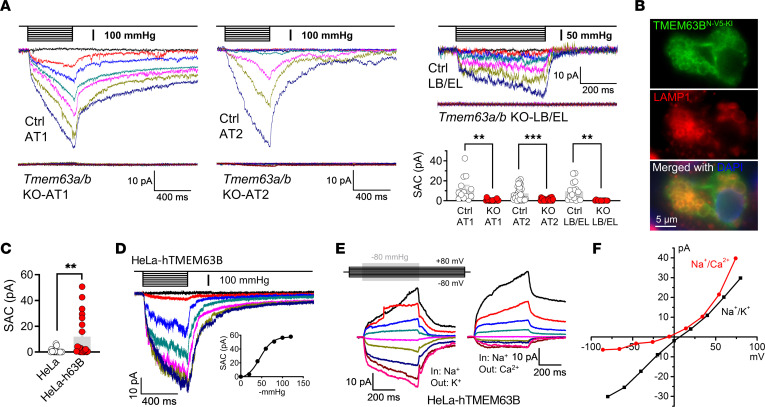
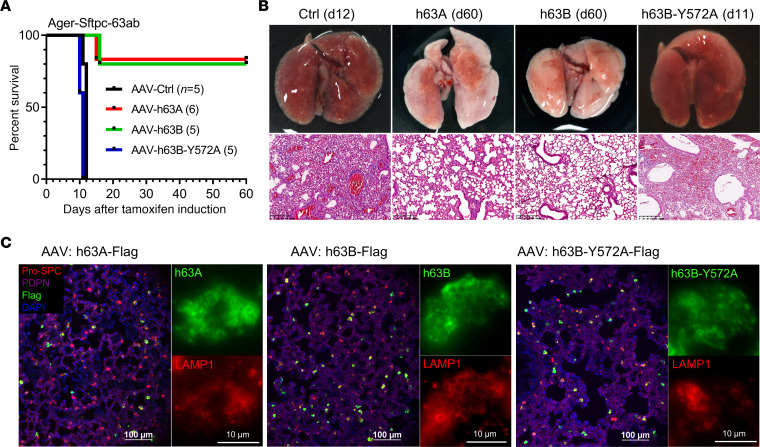
Pulmonary surfactant is a lipoprotein complex lining the alveolar surface to decrease the surface tension and facilitate inspiration. Surfactant deficiency is often seen in premature infants and in children and adults with respiratory distress syndrome. Mechanical stretch of alveolar type 2 epithelial (AT2) cells during lung expansion is the primary physiological factor that stimulates surfactant secretion; however, it is unclear whether there is a mechanosensor dedicated to this process. Here, we show that loss of the mechanosensitive channels TMEM63A and TMEM63B (TMEM63A/B) resulted in atelectasis and respiratory failure in mice due to a deficit of surfactant secretion. TMEM63A/B were predominantly localized at the limiting membrane of the lamellar body (LB), a lysosome-related organelle that stores pulmonary surfactant and ATP in AT2 cells. Activation of TMEM63A/B channels during cell stretch facilitated the release of surfactant and ATP from LBs fused with the plasma membrane. The released ATP evoked Ca2+ signaling in AT2 cells and potentiated exocytic fusion of more LBs. Our study uncovered a vital physiological function of TMEM63 mechanosensitive channels in preparing the lungs for the first breath at birth and maintaining respiration throughout life.

Keywords: Ion channels; Pulmonary surfactants; Pulmonology.


Figures

Figure 1
Figure 1. Mechanical ventilation–induced Ca2+ transients in alveolar cells from ex vivo mouse lungs.
(A) tdTomato fluorescence in ex vivo mouse lungs with Cre-driven expression of tdTomato-GCaMP6f in different cell types. Scale bars: 100 μm. (B) Density of cells with Ca2+ transients (spiking cells, indicated by sharp changes in GCaMP6f intensity) before and after mechanical ventilation with a tidal volume of 200 μL for 5 minutes. n = 4 lung lobes. (C) Duration (seconds) of Ca2+ transients above 50% peak value (CTD50). n = 29, 25, and 41 for AT2, AT1, and endothelial cells, respectively. (D) Density of spiking cells in lungs intratracheally instilled with 100 μL vehicle (0.2% DMSO), suramin (300 μM; blocking P2X and P2Y receptors), apyrase (10 U/mL; hydrolyzing ATP), or U-73122 (20 μM; inhibiting P2Y-Gq-PLC-IP3R pathway) and ventilated with a tidal volume of 200 μL for 5 minutes. n = 3 lung lobes. *P < 0.05, **P < 0.01, and ***P < 0.001, by 2-tailed, unpaired Student’s t test (B), or 1-way ANOVA with Tukey’s test (C and D). Endo, endothelial cells; Mph, macrophages.
Figure 2
Figure 2. Properties of lung inflation– and stretch-induced Ca2+ transients in AT2 cells.
(A) Density of spiking AT2 cells in lungs ventilated with different tidal volumes for 5 minutes. The number of GCaMP6f-spiking cells was divided by the number of tdTomato+ cells (i.e., total number of AT2 cells) in the same area to calculate the percentage. n = 3 lung lobes. **P < 0.01 and ****P < 0.0001, by 1-way ANOVA with Tukey’s test. (B) Rapid decay of spiking AT2 cell density after ventilation with a tidal volume of 200 μL for 2 minutes and 5 minutes, respectively. Data were fitted with a single exponential decay function. n = 5 lung lobes. (C) Percentage of spiking AT2 cells in lungs instilled with 150 μL vehicle (0.1% DMSO), the Cx43 blocker Gap26 (500 μM), the pannexin blocker probenecid (2 mM), the Cl channel blocker DIDS (200 μM), or NPPB (100 μM) after ventilation with a tidal volume of 150 μL for 5 minutes. n = 6 (vehicle) and 4 (others) lung lobes. NS, by 1-way ANOVA. (D) Percentage of spiking AT2 cells in lungs instilled with 150 μL clodronate (100 μM) or control solution. The data were fitted with a biphasic dose-response curve (corresponding to the abundance of ATP-containing LBs). n = 6 lung lobes. *P < 0.05 and ***P < 0.001, by 2-way ANOVA with Šidák’s test. (E) Lack of a direct stretch-activated Ca2+ response in primary AT2 cells cultured on an elastic membrane. Apyrase (10 U/mL) was used to eliminate ATP released into the extracellular space. n = 12 cells. (F) Stretch-induced, ATP-mediated Ca2+ oscillations in primary AT2 cells. Each trace represents fluorescence of an AT2 cell. n = 26 cells.
Figure 3
Figure 3. Mechanosensitive currents in human and mouse AECs.
(A) Stretch-activated currents (SACs) under a cell-attached configuration in primary human and mouse AT2 cells and mouse AT1 cells in acute lung slices. The holding potential was –80 mV, and the vacuum pressures were applied to the clamped membrane with a –20 mmHg increase for each step. Insets are pressure-current relationships of the corresponding recordings. (B) Amplitudes of SACs induced by –80 mmHg pressure in human or mouse AT2 cells and mouse AT1 cells. n = 20, 16, and 56 for human AT2 cells, mouse AT2 cells, and mouse AT1 cells, respectively. (C) Relative permeability of K+, Ca2+, and Mg2+ versus Na+ for stretch-activated currents in mouse AT2 cells. n = 12, 6, and 8 cells for K+, Ca2+, and Mg2+, respectively. (D) Nonselective blockers of ENaC (amiloride, 10 μM), K+ channels (quinine, 500 μM), gap junctions (CBX, 100 μM), and Piezo1 (ruthenium red, 50 μM), and acidic pH did not affect the stretch-activated currents in mouse AT2 cells. n = 13, 7, 6, 8, 7, and 8 cells from left to right. (E) SACs under vesicle-attached configuration in enlarged LBs and ELs (LB/EL) from mouse AT2 cells. The holding potential was –60 mV, and the vacuum pressures were applied with a –10 mmHg increase for each step. (F) Comparison of the amplitudes of stretch-activated currents from LB/EL. n = 10 and 16 human and mouse cells, respectively.
Figure 4
Figure 4. Lethal pulmonary phenotypes of Tmem63a/b-KO mice.
(A) Survival curves for constitutive Tmem63a/b-KO mice of different genotypes. The numbers of mice are shown in parentheses. (B) Failure of alveolar expansion in Tmem63b-KO mice after birth (P0). Original magnification, ×2. (C) Survival curves of AEC-specific Tmem63a/b conditional-KO mice with different genotypes. Aqp5-Cre was expressed in AT1 cells and approximately 50% of AT2 cells SPC-Cre was expressed in all AT2 cells. (D) Survival curves for tamoxifen-inducible, AEC-specific Tmem63a/b-cDKO mice. Ager-CreERT2 was expressed in AT1 cells and approximately 10% of AT2 cells; Nkx2.1-CreERT2 was expressed in AT1 cells and approximately 80% of AT2 cells; and Sftpc-CreERT2 was expressed in all AT2 cells. Ctrl-63ab represents 63afl/fl 63bfl/fl mice without Cre, and others are with the corresponding CreERT2. (E) Micro-CT images of mouse lungs after tamoxifen induction. Arrows indicate regions of atelectasis. (F) Mean lung volume intensities for mice before and after tamoxifen induction, measured from the micro-CT images. n = 3 mice. (G) Atelectasis in cDKO mice illustrated by freshly dissected lungs and H&E-stained sections. Arrows indicate collapsed lobes. Scale bars: 200 μm. (H) A dramatic decline of SpO2 before respiratory failure was observed in cDKO mice. n = 3 mice. (I) Characteristics of pulmonary edema in cDKO mice at post-tamoxifen day 12. n = 5, 9, and 7 mice for lung weight from left to right; n = 3 mice for wet/dry ratio. (J) Body weights in cDKO mice at post-tamoxifen day 12. n = 5, 9, and 7 mice from left to right. (K) Deficiency of secreted SPC, surfactant phospholipid DPPC, and ATP in BALF collected from cDKO mice at post-tamoxifen day 10. n = 3, 5, and 3 mice from left to right in each graph. *P < 0.05, **P < 0.01, ***P < 0.001, and ****P < 0.0001, by 1-way ANOVA with Tukey’s test.
Figure 5
Figure 5. Deficiency of TMEM63A/B abolishes ventilation-induced Ca2+ transients and surfactant release in AT2 cells.
(A) mCherry fluorescence in AAV-infected (CAG-DIO-jGCaMP7s-mCherry–infected) lungs showing positively transduced AT2 cells (brighter spots). Sftpc-63ab represents Sftpc-CreERT2+/– 63afl/fl 63bfl/fl. Scale bar: 100 μm. (B) The densities of positively transduced AT2 cells were comparable between the control Sftpc-CreERT2 and Sftpc-63ab mice. n = 5 lung lobes. NS, nonsignificant, by 2-tailed, unpaired Student’s t test. (C) Lung inflation–induced Ca2+ transients in AT2 cells were completely abolished in all lung lobes from Sftpc-63ab mice, as revealed by jGCaMP7s fluorescence. n = 5 lung lobes. ***P < 0.001, by 1-way ANOVA with Tukey’s test. (D) Survival curves for Tmem63a/b-cDKO mice that received daily inhalation (30 min each time, 3 times/day) of aerosolized ATP (200 mM) or saline solution after tamoxifen induction. n = 3 mice. (E) ATP-induced Ca2+ response in primary AT2 cells isolated from Ctrl-63ab (63afl/fl 63bfl/fl) and Sftpc-63ab mice (n = 30 and 35 cells, respectively). (F) Cell strain–induced surfactant release occurred in AT2 cells from Ctrl-63ab, but not Sftpc-63ab, mice. Unfused LBs were stained by LysoTracker Green; LBs fused on the plasma membrane were positive for FM4-64. Arrows indicate LBs that released surfactant (FM4-64 fluorescence disappeared after strain). Scale bar: 5 μm. (G and H) Tmem63a/b-cDKO did not affect ATP-induced LB fusion but significantly attenuated cell strain–induced surfactant release. Ctrl, Ctrl-63ab; KO, Sftpc-63ab. The median and quartiles are shown by dashed and dotted lines, respectively. The numbers of cells are shown at the bottom. *P < 0.05 and ***P < 0.001, by 1-way ANOVA with Tukey’s test. (I) Reacidification of LBs after removal of ATP in AT2 cells from Sftpc-63ab mice. Overlapped LysoTracker Green and FM4-64 fluorescence (orange, indicated by the arrow) suggests that the fusion pore was closed and luminal pH was reacidified. Scale bar: 5 μm. (J and K) Transmission electron microscopy images and cross-sectional areas (CSAs) of LBs from Ctrl-63ab and Sftpc-63ab mice. n = 41 and 94 LBs, respectively. Scale bars: 1 μm.
Figure 6
Figure 6. TMEM63A/B are essential for mechanosensitive currents in AECs.
(A) SACs were abolished in AT1 cells, AT2 cells, and LB/EL from Tmem63a/b-cDKO mice. Current amplitudes at –80 mV and –80 mmHg for AT1 and AT2 cells and –60 mV and –60 mmHg for LB/EL were used for comparison. n = 13 (Ctrl-AT1, from Ctrl-63ab mice); n = 18 (KO-AT1, from Ager-63ab); n = 25 (Ctrl-AT2, from Ctrl-63ab); n = 21 (KO-AT2, from Sftpc-63ab); n = 16 (Ctrl-LB/EL, from Ctrl-63ab); n = 13 (KO-LB/EL, from Sftpc-63ab) cells. **P < 0.01 and ***P < 0.001, by 2-tailed, unpaired Student’s t test. (B) Immunofluorescence images of endogenous TMEM63B with N-terminal 2×V5-tag–knockin (N-V5-KI) in an AT2 cell in a frozen section of mouse lung. LAMP1 is a marker of LBs. Scale bar: 5 μm. (C) Amplitudes of SACs in control and human TMEM63B-transfected (h63B-transfected) HeLa cells. Holding potential: –80 mV; pressure: –80 mmHg. n = 18 and 20 for HeLa and HeLa-h63B cells, respectively. **P < 0.01, by 2-tailed, unpaired Student’s t test. (D) Representative traces of SACs under the cell-attached configuration in a h63B-transfected HeLa cell. The pressure-current relationship is shown in the inset. (E and F) SAC traces and current-voltage relationships of inside-out recordings from h63B-transfected HeLa cells suggesting selectivity for Na+ and K+ over Ca2+.
Figure 7
Figure 7. Human TMEM63A/B rescues respiratory failure in Tmem63a/b-cDKO mice.
(A) Survival curves for Ager-Sftpc-63ab-cDKO mice that received intratracheally delivered AAVs with empty vector (Ctrl), human TMEM63A (h63A), human TMEM63B (h63B), or the h63B-Y572A mutant after tamoxifen induction. The numbers of mice are shown in parentheses. (B) Images show the relatively normal appearance and structure of h63A- and h63B-rescued lungs compared with the lungs transduced with control or h63B-Y572A AAV. Scale bars: 200 μm. d11, day 11; d12, day 12; d60, day 60. (C) Expression of h63A, h63B, and h63B-Y572A in mouse lungs and localization in AT2 cells. Images show immunofluorescence staining for Pro-SPC (AT2), PDPN (AT1), Flag (h63A/B), and LAMP1 (LBs). Scale bars: 100 μm and 10 μm.

References

    1. Clements JA, Avery ME. Lung surfactant and neonatal respiratory distress syndrome. Am J Respir Crit Care Med. 1998;157(4 pt 2):S59–S66. doi: 10.1164/ajrccm.157.4.nhlb1-1. - DOI - PubMed
    1. Hite RD. Airway Surfactant protein D deficiency in adults with severe asthma. Chest. 2002;149(5):1165–1172. doi: 10.1016/j.chest.2015.11.012. - DOI - PMC - PubMed
    1. Grygorczyk R, et al. Mechanosensitive ATP release in the lungs: New insights from real-time luminescence imaging studies. Curr Top Membr. 2019;83:45–76. doi: 10.1016/bs.ctm.2019.02.001. - DOI - PubMed
    1. Dietl P, et al. Spatio-temporal aspects, pathways and actions of Ca(2+) in surfactant secreting pulmonary alveolar type II pneumocytes. Cell Calcium. 2012;52(3–4):296–302. doi: 10.1016/j.ceca.2012.04.010. - DOI - PubMed
    1. Fois G, et al. ATP is stored in lamellar bodies to activate vesicular P2X4 in an autocrine fashion upon exocytosis. J Gen Physiol. 2018;150(2):277–291. doi: 10.1085/jgp.201711870. - DOI - PMC - PubMed