

Brain tropism acquisition: The spatial dynamics and evolution of a measles virus collective infectious unit that drove lethal subacute sclerosing panencephalitis
- PMID: 38127684
- PMCID: PMC10735034
- DOI: 10.1371/journal.ppat.1011817
Brain tropism acquisition: The spatial dynamics and evolution of a measles virus collective infectious unit that drove lethal subacute sclerosing panencephalitis
Abstract
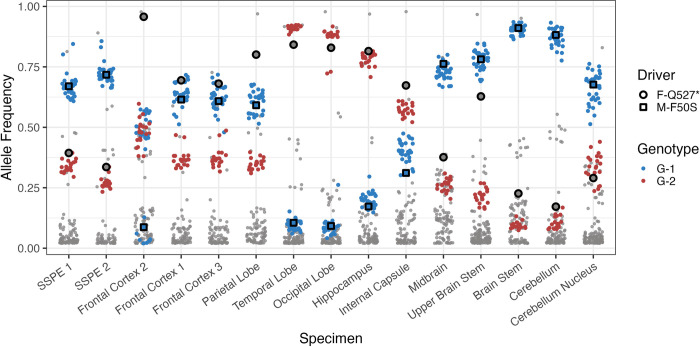
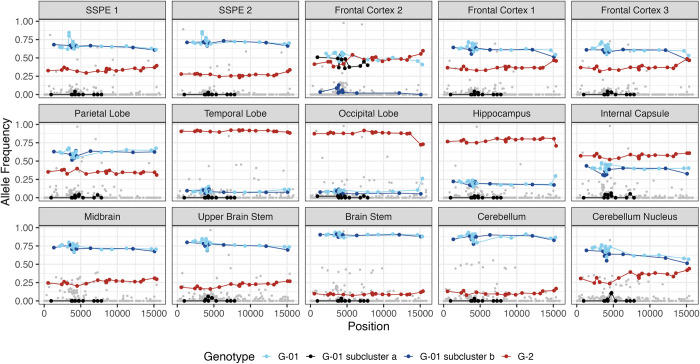
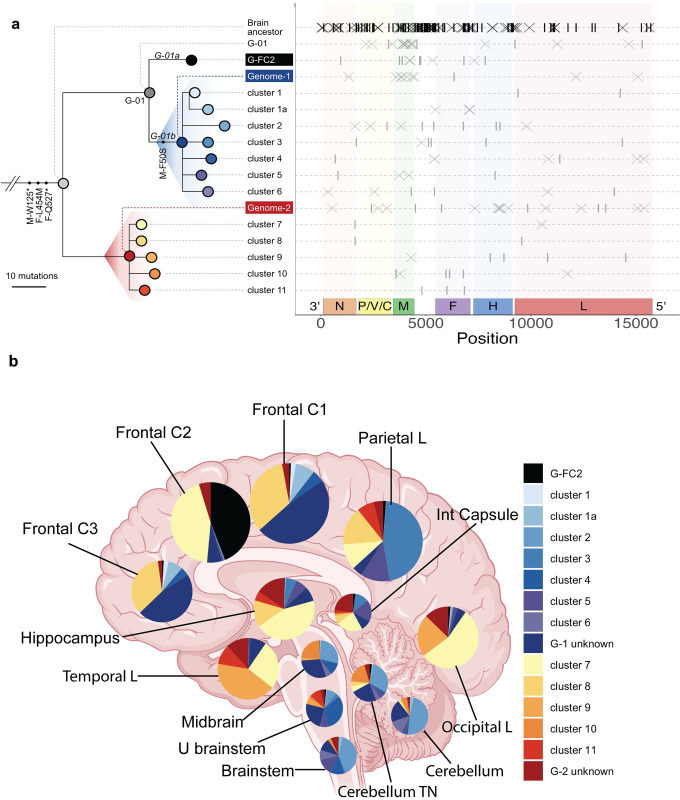
It is increasingly appreciated that pathogens can spread as infectious units constituted by multiple, genetically diverse genomes, also called collective infectious units or genome collectives. However, genetic characterization of the spatial dynamics of collective infectious units in animal hosts is demanding, and it is rarely feasible in humans. Measles virus (MeV), whose spread in lymphatic tissues and airway epithelia relies on collective infectious units, can, in rare cases, cause subacute sclerosing panencephalitis (SSPE), a lethal human brain disease. In different SSPE cases, MeV acquisition of brain tropism has been attributed to mutations affecting either the fusion or the matrix protein, or both, but the overarching mechanism driving brain adaptation is not understood. Here we analyzed MeV RNA from several spatially distinct brain regions of an individual who succumbed to SSPE. Surprisingly, we identified two major MeV genome subpopulations present at variable frequencies in all 15 brain specimens examined. Both genome types accumulated mutations like those shown to favor receptor-independent cell-cell spread in other SSPE cases. Most infected cells carried both genome types, suggesting the possibility of genetic complementation. We cannot definitively chart the history of the spread of this virus in the brain, but several observations suggest that mutant genomes generated in the frontal cortex moved outwards as a collective and diversified. During diversification, mutations affecting the cytoplasmic tails of both viral envelope proteins emerged and fluctuated in frequency across genetic backgrounds, suggesting convergent and potentially frequency-dependent evolution for modulation of fusogenicity. We propose that a collective infectious unit drove MeV pathogenesis in this brain. Re-examination of published data suggests that similar processes may have occurred in other SSPE cases. Our studies provide a primer for analyses of the evolution of collective infectious units of other pathogens that cause lethal disease in humans.
Copyright: This is an open access article, free of all copyright, and may be freely reproduced, distributed, transmitted, modified, built upon, or otherwise used by anyone for any lawful purpose. The work is made available under the Creative Commons CC0 public domain dedication.
Conflict of interest statement
The authors have declared that no competing interests exist.
Figures
Similar articles
-
The measles virus matrix F50S mutation from a lethal case of subacute sclerosing panencephalitis promotes receptor-independent neuronal spread.J Virol. 2025 Jan 31;99(1):e0175024. doi: 10.1128/jvi.01750-24. Epub 2024 Dec 6. J Virol. 2025. PMID: 39641619 Free PMC article.
-
A measles virus collective infectious unit that caused lethal human brain disease includes many locally restricted and few widespread copy-back defective genomes.J Virol. 2024 Nov 19;98(11):e0123224. doi: 10.1128/jvi.01232-24. Epub 2024 Oct 21. J Virol. 2024. PMID: 39431848 Free PMC article.
-
Functional properties of measles virus proteins derived from a subacute sclerosing panencephalitis patient who received repeated remdesivir treatments.J Virol. 2024 Mar 19;98(3):e0187423. doi: 10.1128/jvi.01874-23. Epub 2024 Feb 8. J Virol. 2024. PMID: 38329336 Free PMC article.
-
Subacute sclerosing panencephalitis.Rev Med Virol. 2019 Sep;29(5):e2058. doi: 10.1002/rmv.2058. Epub 2019 Jun 24. Rev Med Virol. 2019. PMID: 31237061 Review.
-
Neuroprogressive disease of post-infectious origin: a review of a resurging subacute sclerosing panencephalitis (SSPE).Ment Retard Dev Disabil Res Rev. 2001;7(3):217-25. doi: 10.1002/mrdd.1030. Ment Retard Dev Disabil Res Rev. 2001. PMID: 11553938 Review.
Cited by
-
Subacute Sclerosing Panencephalitis: Recent Advances in Pathogenesis, Diagnosis, and Treatment.Ann Indian Acad Neurol. 2025 Mar 1;28(2):159-168. doi: 10.4103/aian.aian_1112_24. Epub 2025 Apr 4. Ann Indian Acad Neurol. 2025. PMID: 40235044 Free PMC article.
-
Social interactions shape antiviral resistance outcomes in poliovirus via eco-evolutionary feedback.bioRxiv [Preprint]. 2025 May 26:2025.05.20.655113. doi: 10.1101/2025.05.20.655113. bioRxiv. 2025. PMID: 40501893 Free PMC article. Preprint.
-
Reply to Qu et al., "Quasispecies are constantly selected through virus-encoded intracellular reproductive population bottlenecking".J Virol. 2024 Apr 16;98(4):e0004624. doi: 10.1128/jvi.00046-24. Epub 2024 Mar 6. J Virol. 2024. PMID: 38445886 Free PMC article. No abstract available.
-
Amino acid changes accumulated in the fusion protein allow neuropathogenic measles viruses to use a broad repertoire of host factors for cell fusion triggering.J Virol. 2025 May 20;99(5):e0230724. doi: 10.1128/jvi.02307-24. Epub 2025 Apr 7. J Virol. 2025. PMID: 40192292 Free PMC article.
-
Calcineurin activity in Fonsecaea pedrosoi: tacrolimus and cyclosporine A inhibited conidia growth, filamentation and showed synergism with itraconazole.Braz J Microbiol. 2024 Dec;55(4):3643-3654. doi: 10.1007/s42770-024-01463-2. Epub 2024 Jul 24. Braz J Microbiol. 2024. PMID: 39044105 Free PMC article.
References
MeSH terms
Grants and funding
LinkOut - more resources
Full Text Sources
Medical
