. 2023 Dec 21:12:RP92678.
doi: 10.7554/eLife.92678.

Single-cell characterization of human GBM reveals regional differences in tumor-infiltrating leukocyte activation

Affiliations

Single-cell characterization of human GBM reveals regional differences in tumor-infiltrating leukocyte activation

Philip Schmassmann et al. Elife. .

Abstract

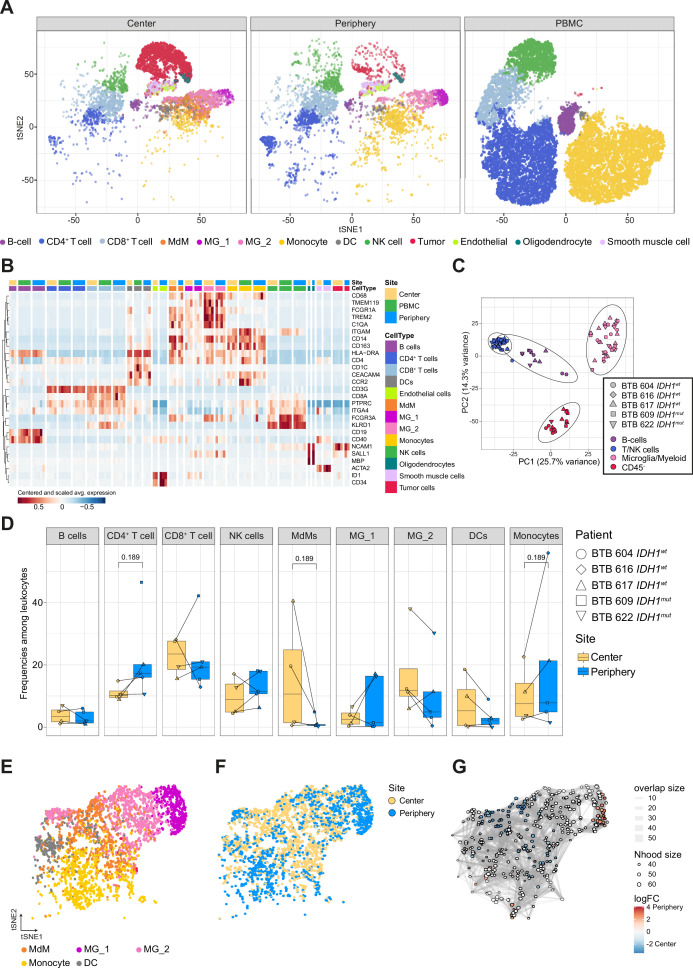
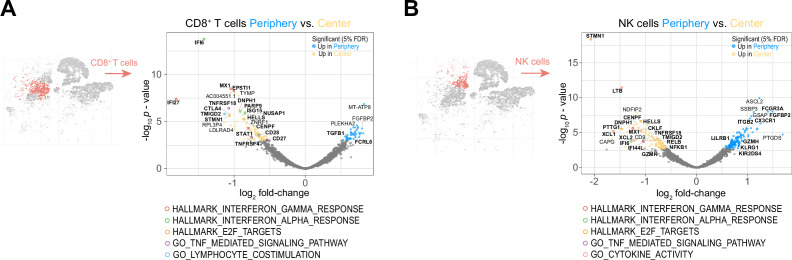
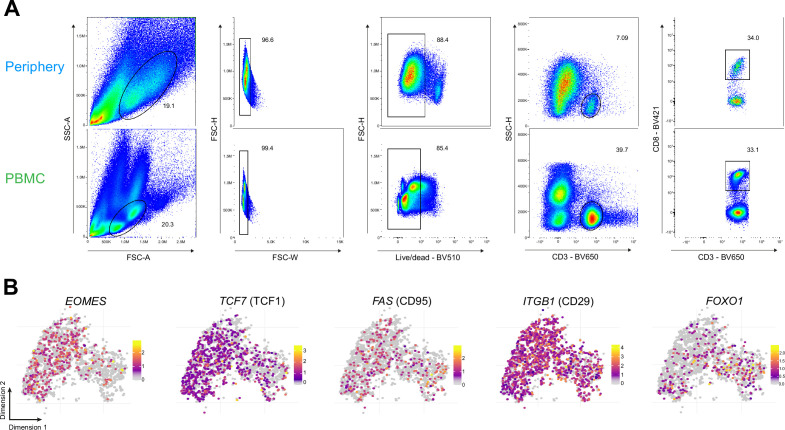
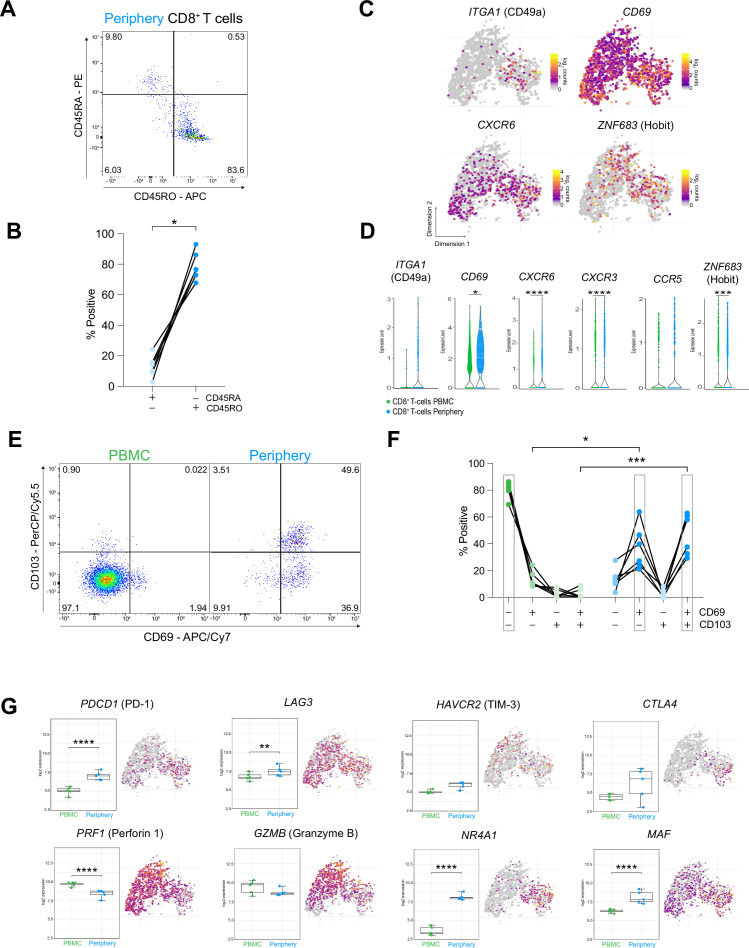
Glioblastoma (GBM) harbors a highly immunosuppressive tumor microenvironment (TME) which influences glioma growth. Major efforts have been undertaken to describe the TME on a single-cell level. However, human data on regional differences within the TME remain scarce. Here, we performed high-depth single-cell RNA sequencing (scRNAseq) on paired biopsies from the tumor center, peripheral infiltration zone and blood of five primary GBM patients. Through analysis of >45,000 cells, we revealed a regionally distinct transcription profile of microglia (MG) and monocyte-derived macrophages (MdMs) and an impaired activation signature in the tumor-peripheral cytotoxic-cell compartment. Comparing tumor-infiltrating CD8+ T cells with circulating cells identified CX3CR1high and CX3CR1int CD8+ T cells with effector and memory phenotype, respectively, enriched in blood but absent in the TME. Tumor CD8+ T cells displayed a tissue-resident memory phenotype with dysfunctional features. Our analysis provides a regionally resolved mapping of transcriptional states in GBM-associated leukocytes, serving as an additional asset in the effort towards novel therapeutic strategies to combat this fatal disease.

Keywords: cancer biology; glioblastoma; human; scRNAseq; tumor microenvironment.


Conflict of interest statement

PS, JR, SH, TS, TM, MR No competing interests declared, SD S.D. is affiliated with Roche Pharmaceutical Research and Early Development. The author has no financial interests to declare, SH S.H. is affiliated with Roche Pharmaceutical Research and Early Development. The author has no financial interests to declare, MB M.B. is affiliated with Roche Pharmaceutical Research and Early Development. The author has no financial interests to declare, GH G.H. has equity in, and is a cofounder of Incephalo Inc

Figures

Figure 1.
Figure 1.. Single-cell RNA-seq of cells from tumor center, periphery and blood.
(A) Experimental workflow for single-cell analysis of cells isolated from tumor center, periphery and peripheral blood mononuclear cells (PBMC), including fluorescent-activated cell sorting and 3’-scRNA-seq. (B) Axial T1 with contrast (left) and T2 (right) MRI brain in a patient with a left temporal GBM. Fresh tumor biopsies were taken according to neuronavigation (green cross). The tumor center was defined as contrast enhancing, whereas the tumor periphery was defined as T2 hyperintense. (C) Nuclear DAPI staining of resected tissue specimens. ×40 magnification (scale bar = 20 μm). n=3 patients, 4 field of view (FOV) per patient. Statistics: ***p<0.001, two-tailed Mann Whitney U test (Figure 1—source data 1).
Figure 1—figure supplement 1.
Figure 1—figure supplement 1.. CD45+CD11b+immune cells gating strategy and quality control of scRNA-seq data.
(A, B) Gating strategy for paired tumor-derived (A) and PBMCs (B); after debris, doublet and dead cell removal, immune cells were assessed as CD45+and/or CD11b+. (C–E) Percentage of mitochondrial (MT) reads (C) number of detected genes (D) and cell-cycle phase (E) overlaid on tSNE representation. Please see Supplementary file 2 for quantification of C–E.
Figure 1—figure supplement 2.
Figure 1—figure supplement 2.. Patient representation among clusters.
(A, B) tSNE map stratified according to site (A) and patient (B). (C–E) tSNE maps showing all cells, colored by site (C), patient (D) and sample (E). (F) Cell-mixing score (Lütge et al., 2021) overlayed on tSNE representation.
Figure 2.
Figure 2.. Single-cell RNA-seq analysis identifies main immune cell populations.
(A) Dimensionally reduced tSNE projection of the scRNAseq data showing the annotated cell types. (B) Heatmap displaying centered and scaled normalized average expression values of characteristic cell-type specific genes used to annotate clusters. Columns are ordered by site and cell type, and rows show centered and scaled expression values, hierarchically clustered. Heatmap displaying genes whose expression is most specific to each cell type is shown in Figure 2—figure supplement 2. (C) Principal component analysis of pseudo-bulk scRNAseq samples aggregated by patient and cell type. Symbols represent individual patients and cell lineage is displayed by different colors. (D) Relative frequencies of immune populations among leukocytes between tumor center and periphery, shown as boxplots. Symbols represent individual patients (n=5) and paired samples are indicated by connecting lines. p-Values were calculated using diffcyt-DA-voom method (Figure 2—source data 1). (E–G) Differential abundance testing of the tumor innate immune compartment (E) using the miloR package which tests the abundance of each neighborhood of cells separately between tumor center und periphery (F, G).
Figure 2—figure supplement 1.
Figure 2—figure supplement 1.. Cross-referencing scRNA-seq data with published datasets.
(A–D) Using hierarchical clustering, identified cell clusters at different levels of granularity (A, B) which were then annotated into nine distinct cell types for the immune subset and four cell types for the CD45neg subset (C, D). (E, F) Immune cell types were annotated by referencing to a dataset of bulk RNA-seq samples of sorted immune cell types from human PBMC (E) (Monaco et al., 2019) and MdMs and microglia were annotated by comparing to a dataset of bulk RNA-seq samples of sorted immune cell types from the tumor microenvironment of human gliomas (F) (Klemm et al., 2020). Clusters are highlighted which were annotated using each respective reference dataset. (G–K) Subset analysis on tumor innate immune cells (G), showing re-clustering on the subset (H), annotation by referencing to a 10 X genomics scRNA-seq dataset of TAMs from the GBM TME of seven newly diagnosed human patients (I) (Pombo Antunes et al., 2021) and signature scores defined from scRNA-seq of glioma TAMs (J, K) (Müller et al., 2017). (L–O) Subset analysis on CD45neg cells (L), showing re-clustering on the subset (M), annotation by whole-transcriptome comparison to a scRNA-seq dataset of IDH1wt GBM (N) (Neftel et al., 2019) and an endothelial score which was defined by averaging the center and scaled expression levels of the genes CDH5, VWF, CD34, and PECAM1 (O).
Figure 2—figure supplement 2.
Figure 2—figure supplement 2.. Cell type specific gene expression.
(A) Heatmap displaying genes whose expression is most specific to each cell type. Columns are ordered by site and cell type, and rows show centered and scaled expression values, hierarchically clustered.
Figure 3.
Figure 3.. MG display regionally resolved transcriptional profiles that differ from those of DCs and MdMs.
(A) Microglia cluster highlighted on tSNE map and scatterplots showing differentially expressed genes (FDR <5%, indicated by blue and yellow) in Microglia (MG) cells from tumor periphery versus center. Volcano plot showing p value versus fold-change (left) and MA plot showing fold-change versus mean expression (right). For a complete list of differentially expressed genes per cell cluster between tumor periphery and center, please refer to Supplementary file 4. (B) Heatmap representation of Gene set enrichment analysis (GSEA) results between peripheral and center microglia using Gene Ontology (GO) collection (Biological Processes). The fraction of overlap between gene sets is calculated as Jaccard coefficient of overlap between the gene sets. (C, D) Heatmap representation of GSEA of DCs (C) and monocyte-derived macrophages (MdMs) (D) from tumor periphery versus tumor center using Hallmark collection of major biological categories. (E) Unsupervised hierarchical sub-clustering of the MG population revealed two transcriptionally distinct subsets of MG, termed MG_1 and MG_2, displayed on the tSNE map. (F) Heatmap displaying the cluster-specific genes identifying MG_1 subcluster. Columns are ordered by site and cell type, and rows show centered and scaled normalized average expression values, hierarchically clustered. A complete list of cluster specific genes for MG_1 and MG_2 subcluster is provided in Supplementary file 5. (G) Heatmap representation of GSEA between MG_1 and MG_2 subclusters using Hallmark collection of major biological categories. (H) Heatmap displaying previously described reactivity markers of MG. Columns are ordered by site and cell type, and rows show centered and scaled normalized average expression values, hierarchically clustered.
Figure 3—figure supplement 1.
Figure 3—figure supplement 1.. Regionally dependent transcriptional profiles of innate immune subsets and MG subclusters MG_1 and MG_2.
(A, B) Volcano plots showing differentially expressed genes (FDR corrected p-value <0.05, indicated by colors) in DCs (A) and MdMs (B) from tumor periphery versus center. (C) Volcano plot showing differentially expressed genes (FDR corrected p-value <0.05, indicated by colors) in DCs from tumor periphery versus PBMC. (D) Heatmap representation of GSEA between DCs from tumor periphery and PBMC using Hallmark collection of major biological categories. (E) Heatmap displaying the cluster-specific genes identifying MG_1 and MG_2 subclusters. Columns are ordered by site and cell type, and rows show centered and scaled normalized average expression values, hierarchically clustered. (F, G) Violin plots showing average expression levels (log2 counts) of selected markers among mononuclear phagocyte populations. (H) Frequencies of MG_1 and MG_2 subpopulations among total microglia between center and periphery, shown as boxplots. Symbols represent individual patients (n=5) and paired samples are indicated by connecting lines. Statistical significance was assessed by diffcyt-DA-voom method (Supplementary file 5), ***FDR corrected p value p≤0.001, ****FDR corrected p-value ≤0.0001.
Figure 4.
Figure 4.. The peripheral cytotoxic cell compartment exhibits an impaired activation signature.
(A, B) Volcano plots showing differentially expressed genes (FDR corrected p-value <0.05, indicated by blue and yellow) in CD8+ T cells (A) and NK cells (B) from tumor periphery versus tumor center. Colored rings mark genes belonging to selected GSEA Hallmark or Gene Ontology (GO) pathways as indicated. For a complete list of differentially expressed genes per cell cluster between tumor periphery and center, please refer to Supplementary file 4.
Figure 4—figure supplement 1.
Figure 4—figure supplement 1.. Differential expression analysis between tumor center and peripheral CD4+T cells.
(A) Volcano plot showing differentially expressed genes (FDR corrected p-value <0.05, indicated by blue and yellow) in CD4+T cells from tumor periphery versus tumor center.
Figure 5.
Figure 5.. CX3CR1 labels a specific CD8 +T cell population in the circulation of grade 4 glioma patients.
(A) CD8+ T cell cluster highlighted on tSNE map (left). CD8+ T cell cluster colored by site of origin (right). (B) Volcano plot showing differentially expressed genes (FDR corrected p-value <0.05, indicated by blue and green) in CD8+ T cells from tumor-periphery versus PBMC. For a complete list of differentially expressed genes per cell cluster between tumor periphery and PBMC, please refer to Supplementary file 6. (C) Frequency of CX3CR1+ CD8+ T cells among all CD8+ T cells in flow cytometry data (Figure 5—source data 1). (D) Unsupervised hierarchical sub-clustering of CD8+ T cells from PBMC and Periphery revealed two transcriptionally distinct subsets of PBMC CD8+ T cells, displayed on the tSNE map. (E) Expression of CX3CR1 overlaid on tSNE CD8+ T cell cluster. (F) Expression of genes associated with effector memory phenotype overlaid on tSNE CD8+ T cell cluster. Displayed genes are significantly, differentially expressed genes (DEGs) between tumor periphery and PBMC, as identified by differential gene expression analysis shown in panel (B). (G) Expression of selected genes associated with naive phenotype overlaid on tSNE CD8+ T cell cluster (H) Gating procedure applied to identify CD3+ CD8+ naive, T effector cells (Teff), effector memory (Tem), peripheral memory (Tpm) and central memory (Tcm), eluted from PBMCs. (I) Expression of CX3CR1 in PBMC CD8+ T cell subpopulations identified in (H) (Figure 5—source data 2). n=6 donors (C), n=11 donors (I). Statistics: Wilcoxon matched-pairs signed rank test (C); repeated measures one-way ANOVA with post-hoc Šidák’s correction for multiple comparisons (I). *p≤0.05, **p≤0.01, ***p≤0.001, ****p≤0.0001, no brackets indicate no significant difference.
Figure 5—figure supplement 1.
Figure 5—figure supplement 1.. Phenotypic characterization of PBMC CD8+ T cells.
(A) Gating strategy for paired tumor-periphery and PBMC cells; after debris, doublet and dead cell removal, CD8 +T cells were identified as CD3+CD8+events. (B) Single-cell expression of additional markers associated with naive/memory.
Figure 6.
Figure 6.. CD8+ T cells in the tumor periphery share features with tissue-resident memory T cells (Trm).
(A) Representative dot plot of tumor-periphery CD8+ T cells stained for CD45RA and CD45RO. (B) Quantification of tumor-periphery CD8+ T cells expressing CD45RA or CD45RO (Figure 6—source data 1). (C) Expression of genes associated with tissue-resident memory (Trm) phenotype overlaid on tSNE CD8+ T cell cluster. (D) Average expression levels of selected Trm markers between CD8+ T cells from PBMC versus tumor-periphery. Significance testing based on differential gene expression analysis shown in panel (Figure 5B) (E) Representative dot plots of CD69 and CD103 co-expression in CD8+ T cells from PBMC and tumor-periphery. (F) Quantification of CD69 and CD103 co-expression revealed CD69- CD103- in PBMC and CD69+ CD103- and CD69+ CD103+ in tumor-periphery as the dominant phenotypes (Figure 6—source data 2). (G) Expression of selected markers associated with T cell exhaustion/dysfunction, shown as boxplots between CD8+ T cell from PBMC and tumor-periphery and overlaid on tSNE CD8+ T cell cluster. Significance testing based on differential gene expression analysis shown in panel (Figure 5B). n=6 donors (B, F). Statistics: Wilcoxon matched-pairs signed rank test (B); repeated measures one-way ANOVA with post-hoc Šidák’s correction for multiple comparisons (F). *p≤0.05, **p≤0.01, ***p≤0.001, ****p≤0.0001, no brackets indicate no significant difference.
Figure 6—figure supplement 1.
Figure 6—figure supplement 1.. Phenotypic characterization of Periphery CD8+ T cells.
(A–C) Single-cell expression of additional markers associated with tissue-resident memory (A), T cell co-stimulation (B) and T cell exhaustion/dysfunction (C) overlaid on tSNE CD8+T cell cluster. (D) Volcano plot showing differentially expressed genes (FDR corrected p-value <0.05, indicated by blue and green) in CD4+ (left) and CD8+ T cells from tumor-periphery versus PBMC.
Figure 7.
Figure 7.. Cell-cell communication analysis using CellChat reveals critical role for SPP1-mediated crosstalk in tumor periphery.
(A) Chord diagram showing significant interactions from microglia to lymphocyte cell clusters. The inner bar colors represent the targets that receive signal from the corresponding outer bar. The inner bar size is proportional to the signal strength received by the targets. Chords indicate ligand-receptor pairs mediating interaction between two cell clusters, size of chords is proportional to signal strength of the given ligand-receptor pair. (B) Comparison of incoming and outgoing interaction strength allows identification of main senders and receivers. (C) Violin plots showing the expression distribution of signaling genes involved in the inferred SPP1 signaling network.
Figure 7—figure supplement 1.
Figure 7—figure supplement 1.. Cell-cell communication analysis using CellChat.
(A, B) Chord diagram showing significant interactions from microglia to all cell clusters in center (A) and periphery (B). The inner bar colors represent the targets that receive signal from the corresponding outer bar. The inner bar size is proportional to the signal strength received by the targets. Chords indicate ligand-receptor pairs mediating interaction between two cell clusters, size of chords is proportional to signal strength of the given ligand-receptor pair. (C, D) Violin plots showing the expression distribution of signaling genes (in log2 counts) involved in the inferred SPP1 signaling network in center (C) and periphery (D).

Update of

  • doi: 10.1101/2022.06.17.496574
  • doi: 10.7554/eLife.92678.1

References

    1. Abdelfattah N, Kumar P, Wang C, Leu J-S, Flynn WF, Gao R, Baskin DS, Pichumani K, Ijare OB, Wood SL, Powell SZ, Haviland DL, Parker Kerrigan BC, Lang FF, Prabhu SS, Huntoon KM, Jiang W, Kim BYS, George J, Yun K. Single-cell analysis of human glioma and immune cells identifies S100A4 as an immunotherapy target. Nature Communications. 2022;13:767. doi: 10.1038/s41467-022-28372-y. - DOI - PMC - PubMed
    1. Alegre ML, Noel PJ, Eisfelder BJ, Chuang E, Clark MR, Reiner SL, Thompson CB. Regulation of surface and intracellular expression of CTLA4 on mouse T cells. Journal of Immunology. 1996;157:4762–4770. - PubMed
    1. Amezquita RA, Lun ATL, Becht E, Carey VJ, Carpp LN, Geistlinger L, Marini F, Rue-Albrecht K, Risso D, Soneson C, Waldron L, Pagès H, Smith ML, Huber W, Morgan M, Gottardo R, Hicks SC. Orchestrating single-cell analysis with Bioconductor. Nature Methods. 2020;17:137–145. doi: 10.1038/s41592-019-0654-x. - DOI - PMC - PubMed
    1. Aran D, Looney AP, Liu L, Wu E, Fong V, Hsu A, Chak S, Naikawadi RP, Wolters PJ, Abate AR, Butte AJ, Bhattacharya M. Reference-based analysis of lung single-cell sequencing reveals a transitional profibrotic macrophage. Nature Immunology. 2019;20:163–172. doi: 10.1038/s41590-018-0276-y. - DOI - PMC - PubMed
    1. Bignon A, Régent A, Klipfel L, Desnoyer A, de la Grange P, Martinez V, Lortholary O, Dalloul A, Mouthon L, Balabanian K. DUSP4-mediated accelerated T-cell senescence in idiopathic CD4 lymphopenia. Blood. 2015;125:2507–2518. doi: 10.1182/blood-2014-08-598565. - DOI - PubMed

Associated data