. 2023 Dec 21;19(12):e1011063.
doi: 10.1371/journal.pgen.1011063. eCollection 2023 Dec.

Autophagic dysfunction and gut microbiota dysbiosis cause chronic immune activation in a Drosophila model of Gaucher disease

Affiliations

Autophagic dysfunction and gut microbiota dysbiosis cause chronic immune activation in a Drosophila model of Gaucher disease

Magda L Atilano et al. PLoS Genet. .

Abstract

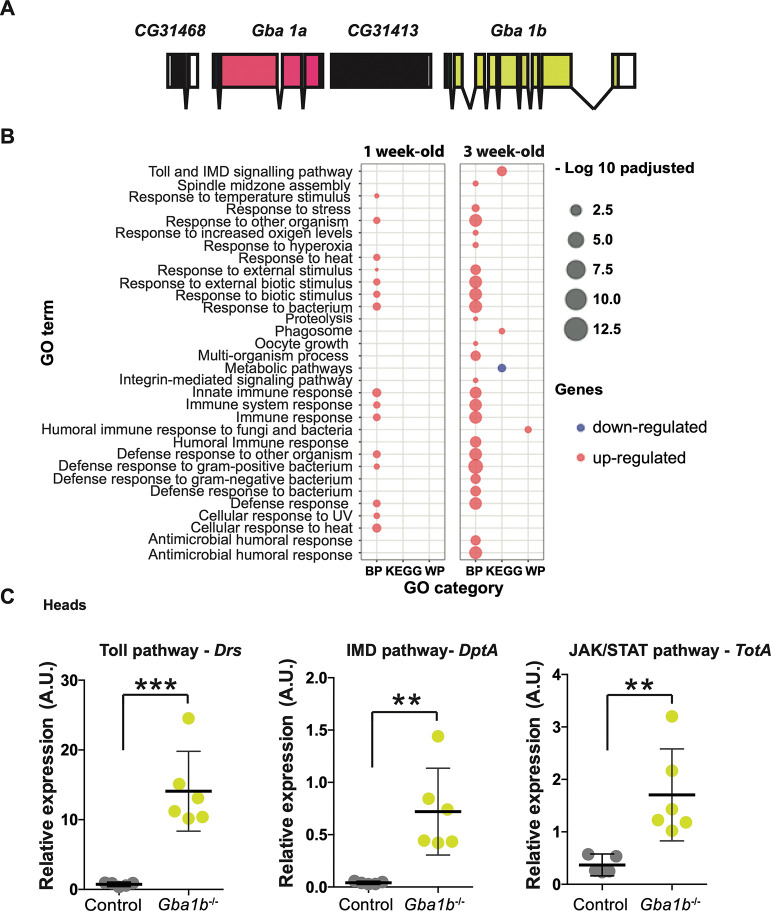
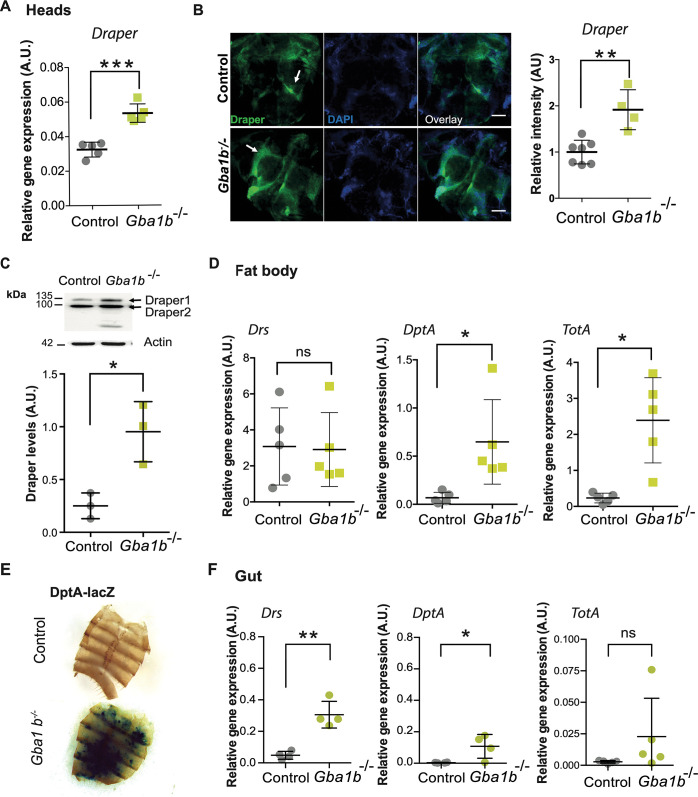
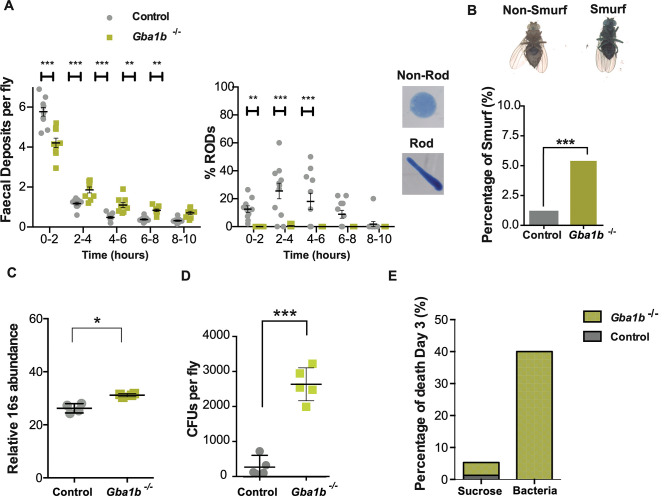
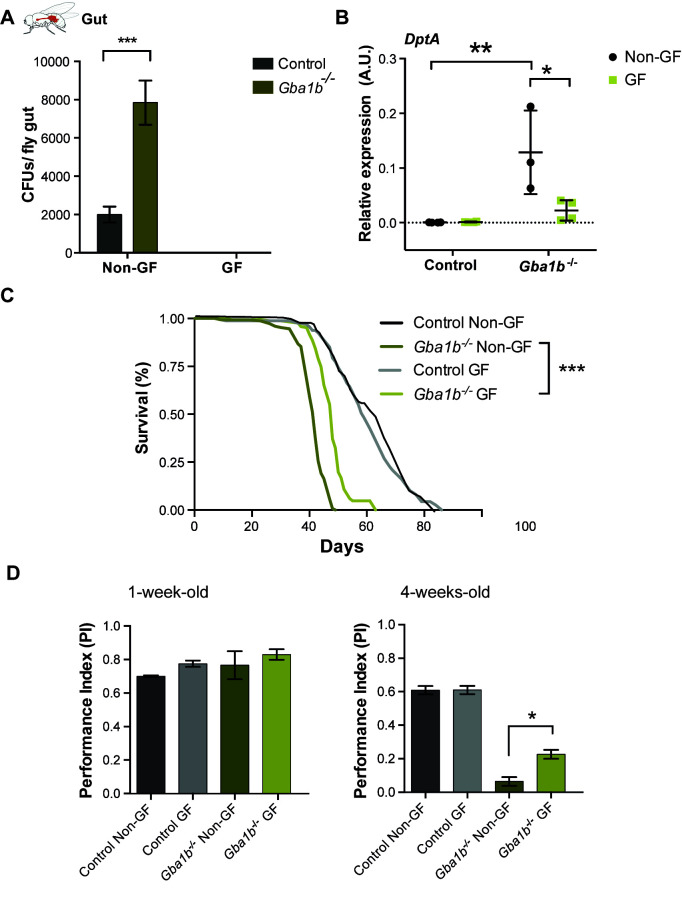
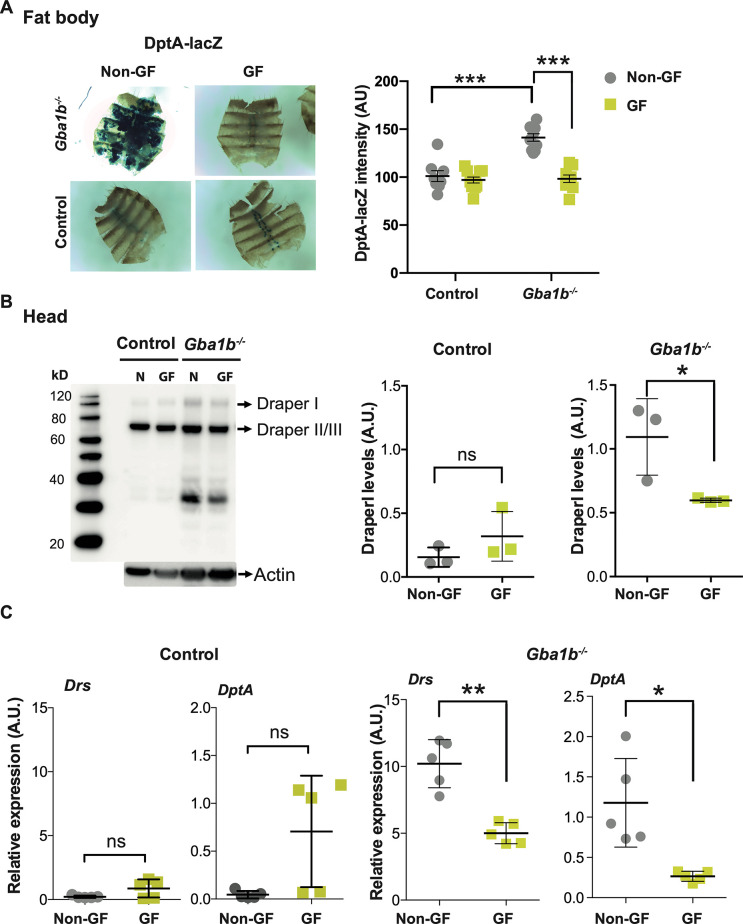
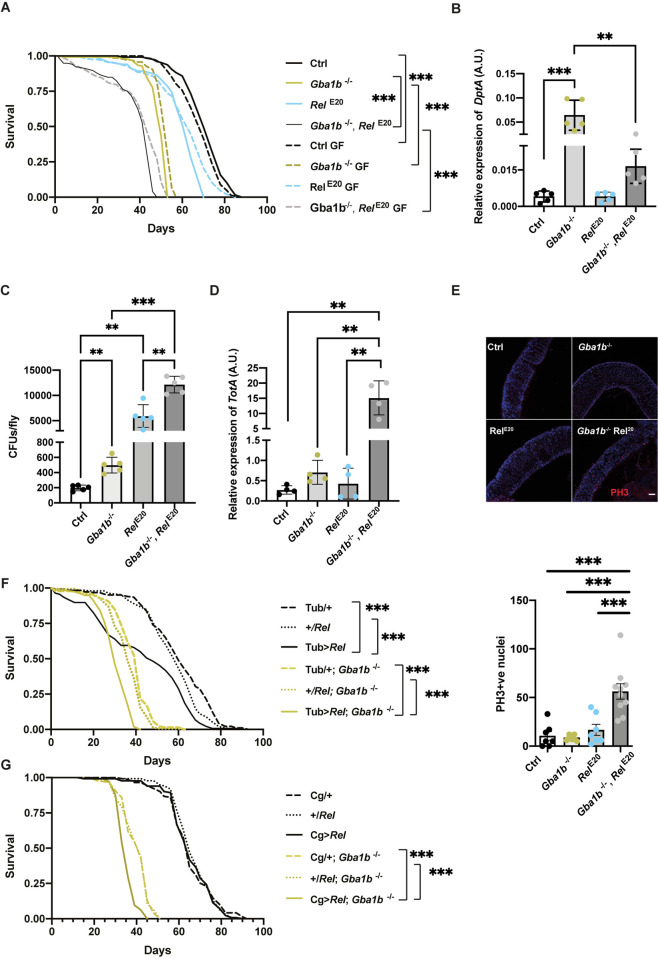
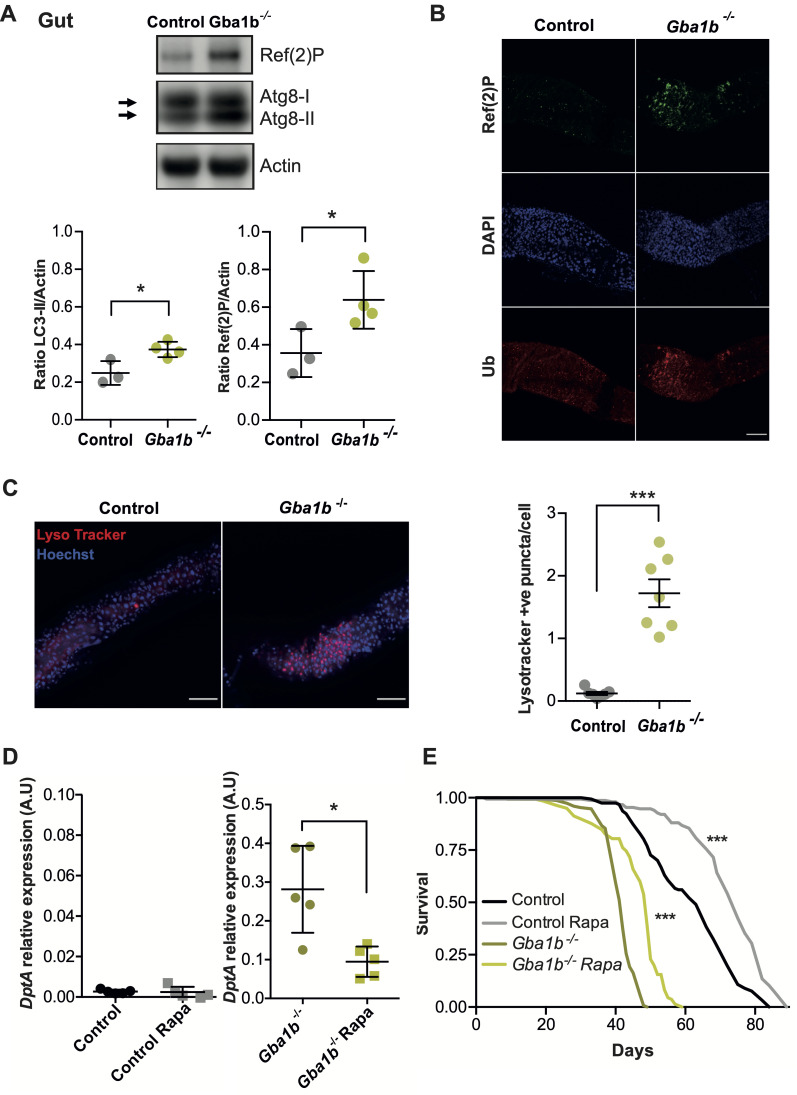
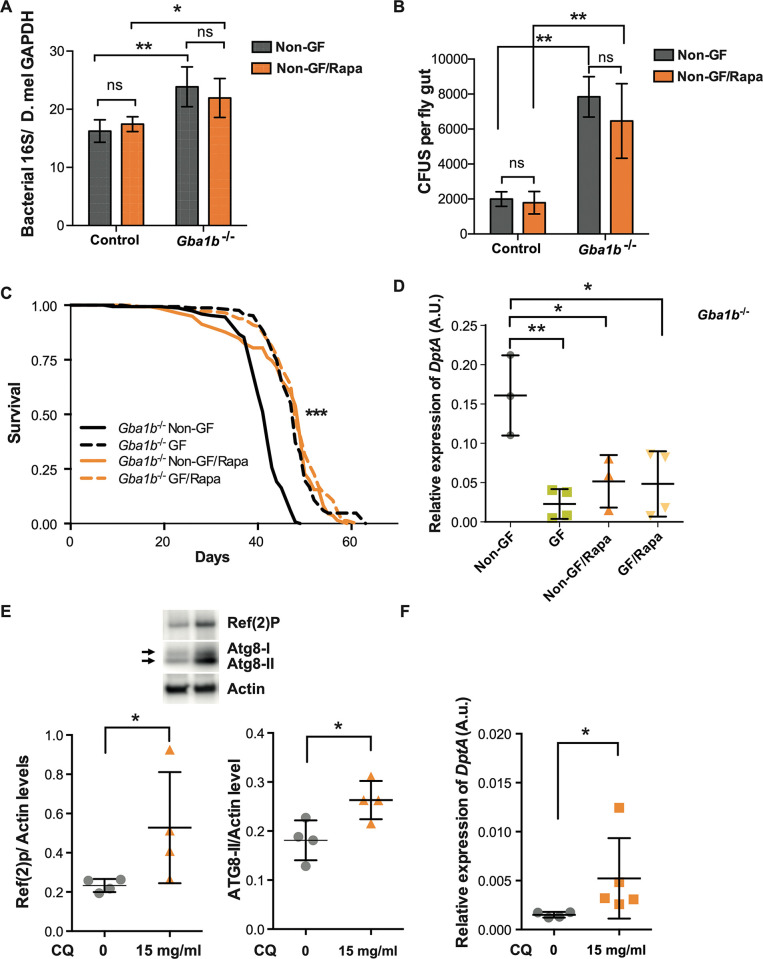
Mutations in the GBA1 gene cause the lysosomal storage disorder Gaucher disease (GD) and are the greatest known genetic risk factors for Parkinson's disease (PD). Communication between the gut and brain and immune dysregulation are increasingly being implicated in neurodegenerative disorders such as PD. Here, we show that flies lacking the Gba1b gene, the main fly orthologue of GBA1, display widespread NF-kB signalling activation, including gut inflammation, and brain glial activation. We also demonstrate intestinal autophagic defects, gut dysfunction, and microbiome dysbiosis. Remarkably, modulating the microbiome of Gba1b knockout flies, by raising them under germ-free conditions, partially ameliorates lifespan, locomotor and immune phenotypes. Moreover, we show that modulation of the immune deficiency (IMD) pathway is detrimental to the survival of Gba1 deficient flies. We also reveal that direct stimulation of autophagy by rapamycin treatment achieves similar benefits to germ-free conditions independent of gut bacterial load. Consistent with this, we show that pharmacologically blocking autophagosomal-lysosomal fusion, mimicking the autophagy defects of Gba1 depleted cells, is sufficient to stimulate intestinal immune activation. Overall, our data elucidate a mechanism whereby an altered microbiome, coupled with defects in autophagy, drive chronic activation of NF-kB signaling in a Gba1 loss-of-function model. It also highlights that elimination of the microbiota or stimulation of autophagy to remove immune mediators, rather than prolonged immunosuppression, may represent effective therapeutic avenues for GBA1-associated disorders.


Conflict of interest statement

The authors have declared that no competing interests exist.

Figures

Fig 1
Fig 1. GCase deficiency results in up-regulation of innate immune pathways in the fly head.
(A) Schematic representation of the two Drosophila Gba1 gene loci, Gba1a and Gba1b. (B) Functional enrichment of the up-regulated and down-regulated genes in the heads of 1- and 3-week-old Gba1b-/- flies relative to controls. All the significant GO-terms (adjusted p-values <0.05) for Biological Processes (BP), KEGG pathway (KEGG) and Wiki pathway (WP) are shown. There is strong up-regulation of GO-categories related to innate immune pathways. The size of the dots represents -log10 p-adjusted values for the GO-term enrichments. (C) Quantitative RT-PCR confirms up-regulation of the Toll (Drs) (***p = 0.0004), IMD (DptA) (**p = 0.0041) and JAK-STAT (TotA) (**p = 0.0069) reporter genes in 3-week-old Gba1b-/- fly heads compared to controls. All target gene expression levels are normalized to tubulin. Unpaired t-tests; data are presented as mean ± 95% confidence intervals, n = 5–6 per genotype.
Fig 2
Fig 2. Gba1b-/- flies display glial activation in the brain and immune activation in the fat body and gut.
(A) Quantitative RT-PCR analysis demonstrates increased Draper gene expression in the heads of 3-week-old Gba1b-/- flies compared to controls (***p = 0.0001). Unpaired t-test; data are presented as mean ± SD, n = 5 per genotype. (B) Draper immunofluorescence (green channel) is increased in 3-week-old Gba1b-/- fly brains compared to age-matched controls (**p = 0.0015). White arrows show Draper localization in the antennal lobes. Scale bars, 50 μm. Representative images are shown. Unpaired t-test; data are presented as mean ± SD, n = 4–7 per genotype. (C) Western blot analysis confirms increased Draper 1 protein levels in the heads of Gba1b-/- flies compared to controls. Draper levels are shown normalised to actin. Unpaired t-test (*p = 0.0354) and data presented as mean ± SD, n = 3 biological repeats per genotype. (D) Quantitative RT-PCR analysis confirms up-regulation of the IMD (DptA) (*p = 0.041) and JAK-STAT (TotA) (*p = 0.0147) reporter genes in the pooled dissected fat bodies of 3-week-old Gba1b-/- flies compared to controls. All target gene expression levels are normalized to tubulin. Unpaired t-tests; data are presented as mean ± SD, n = 5 per genotype. (E) Expression of the IMD reporter, DptA-LacZ, in CRIMIC inserted Gba1b null flies reveals strong LacZ staining in the dissected fat body tissue. Representative images are shown. (F) The expression of the Toll innate immune pathway reporter gene, Drs, is increased in the midgut of 3-week-old Gba1b-/- flies compared to controls (**p = 0.0011). The IMD (DptA) reporter gene is also significantly increased (*p = 0.0334), while the JAK-STAT reporter TotA is not significantly elevated (p = 0.1801). All target gene expression levels are normalized to tubulin. Unpaired t-tests; and data are presented as mean ± SD, n = 4–5 per genotype.
Fig 3
Fig 3. Gba1b-/- flies show reduced intestinal transit and an altered gut microbiome.
(A) The rate of intestinal transit is decreased in 3-week-old Gba1b-/- flies compared to controls as assessed by the number of faecal deposits over time (***p< 0.0001 and ** p< 0.01). Gba1b-/- flies produce almost exclusively non-ROD faecal deposits (***p< 0.0001 and ** p< 0.01). Two-way ANOVA followed by Fisher’s LSD multiple comparison test. Data are presented as mean ± SEM. (B) Assessment of gut permeability using a Smurf assay reveals that there is an increase in the number of Smurf flies among aged Gba1b-/- flies (28 days-old) compared to controls, suggesting increased gut wall permeability (Gba1b-/- vs control, ***p = 0.0002;). X2 (chi-squared) tests with Yates’ correction. (C) Quantitative PCR-based 16S rRNA gene abundance is significantly higher in the guts of Gba1b-/- flies than in controls (*p = 0.0286). Mann-Whitney test; data are presented as mean ± SD, n = 4 per genotype. (D) CFUs are significantly increased in the guts of 3-week-old Gba1b-/- flies compared to age-matched controls (p<0.001). Unpaired t-test; results are presented as mean ± SD, n = 5 per genotype). (E) Oral infection with Lactobacillus plantarum results in increased mortality among Gba1b-/- flies but not in control flies.
Fig 4
Fig 4. Raising Gba1 mutant flies under germ-free (GF) conditions partially ameliorates a number of disease phenotypes.
(A) CFUs in Gba1b-/- and control fly guts raised under non-GF and GF conditions at 3 weeks demonstrates that Gba1b-/- flies display higher microbial load in comparison with control flies (***p<0.0001). No bacterial load is observed for both control and mutant flies raised under GF conditions. Two-way ANOVA test followed by Tukey’s multiple comparison test. Data are presented as mean ± SEM, n = 5 per condition. (B) Quantitative RT-PCR analysis of DptA mRNA levels, in the gut of non-GF and GF Gba1b-/- and control flies, shows DptA levels are significantly reduced in GF Gba1b-/- flies (**p = 0.0027; *p = 0.0107). Two-way ANOVA test followed by Sidak’s multiple comparison test. Data are presented as mean ± SD, n = 3–4 per condition. (C) GF Gba1b-/- treated flies have an increased lifespan compared to those reared under standard non-GF conditions. Log-rank tests were used for all comparisons: GF vs non-GFGba1b-/-, p = 0.0003 (n = 150); GF control vs non-GF control p = 0.9813 (n = 150). (D) GF Gba1b-/- flies have improved climbing ability at 4 weeks of age compared to their non-GF counterparts (ns > 0.05; *p = 0.034 GF vs non-GF Gba1b-/-). One-way ANOVA test with Tukey’s post hoc analysis (n = 75 flies per condition).
Fig 5
Fig 5. Raising Gba1b-/- flies under GF conditions reverses immune activation in fat body and brain tissues.
(A) DptA-LacZ staining in the fat body is reduced to control levels in GF Gba1b-/- flies compared to their non-GF counterparts (***p<0.0001). One-way ANOVA and Tukey’s post hoc analysis; data are presented as mean ± 95% confidence intervals. (B) Western blot analysis reveals a decrease in Draper 1 levels in the heads of GF Gba1b-/- flies compared to non-GF flies (n = 3; GF Gba1b-/- vs non-GF *p = 0.045; GF controls vs non-GF p = 0.2472). (C) DptA and Drs transcript levels are reduced on qRT-PCR analysis of heads of 3-week-old GF Gba1b-/- flies compared to non-GF flies (*p = 0.0202; **p = 0.0014). Unpaired t-test. Data are presented as mean ± SD (n = 5 per condition).
Fig 6
Fig 6. Overexpression or knockout of Rel is toxic to flies lacking Gba1b.
(A) The lifespan of Gba1b-/-, RelE20 flies is significantly reduced under both GF and non-GF conditions when compared to single Gba1b-/- and RelE20 mutants. Log-rank tests were used for all the comparisons (n = 150), in non-GF: Ctrl vs Gba1b-/- ***p = 1.2x10-49; Ctrl vs RelE20 ***p = 2.3x10⁻²⁴; Gba1b-/- vs Gba1b-/-, RelE20 ***p = 1.9x10-40 and in GF vs non-GF: Ctrl *p = 0.02; Gba1b-/- ***p = 8.24x10⁻¹⁰; Gba1b-/-, RelE20 double mutant ***p = 1.22x10⁻⁶. (B) DptA transcript levels are reduced on qRT-PCR analysis of headless bodies of 3-week-old Gba1b-/-, RelE20 flies (n = 4–5 per condition; ***p = 0.0001 and **p = 0.0011). One-way ANOVA followed my multiple comparison tests. Data are presented as mean ± SD. (C) 3-week-old Gba1b-/-, RelE20 flies display higher microbial load. Ctrl vs Gba1b-/- **p = 0.0017; Ctrl vs RelE20 **p = 0.0047; Ctrl vs Gba1b-/-, RelE20 ***p<0.0001; Gba1b-/- vs Gba1b-/-, RelE20 ***p<0.0001; RelE20 vs Gba1b-/-, RelE20 **p = 0.0013). One-way ANOVA test followed by multiple comparison test; data are presented as mean ± SD. (D) TotA transcript levels are increased on qRT-PCR analysis of 3-week-old headless bodies of Gba1b, RelE20 flies (n = 4–5 per condition; Ctrl vs Gba1b-/-, RelE20 **p = 0.0023; RelE20 vs Gba1b-/-, RelE20 **p = 0.0025; and Gba1b-/- vs Gba1b-/-, RelE20 **p = 0.0035). One-way ANOVA followed by Fisher’s multiple comparison tests; data are presented as mean ± SD. (E) Gut immunostaining for PH3 demonstrates a greater number of PH3 positive cells in the midgut of 3-week-old Gba1b-/-, RelE20 flies (*** p<0.0001). One-way ANOVA followed by multiple comparison tests; data are presented as mean ± SD. Scale bar = 50μm. (F) Ubiquitous overexpression of Rel using Tubulin-GAL4 (Tub) driver is deleterious to Gba1b-/- flies. Log-rank tests were used for all the comparisons (n = 150): +/Tub; Gba1b-/- vs Tub>Rel; Gba1b-/- ***p = 1.69x10⁻²⁴ and +/Rel; Gba1b-/- vs Tub>Rel; Gba1b-/- ***p = 8.68x10⁻¹⁶, +/Tub; Gba1b-/- vs +/Rel; Gba1b-/- * p = 0.045, +/Rel vs Tub>Rel **p = 0.003 and +/Tub vs Tub>Rel ***p = 1.22x10⁻¹¹. (G) Overexpression of Rel in the fat body using the Cg-GAL4 (Cg) driver is deleterious to Gba1b-/- flies. Log-rank tests were used for all the comparisons (n = 150): +/Cg; Gba1b-/- vs Cg>Rel; Gba1b-/- ***p = 4.76x10⁻¹⁷ and +/Rel; Gba1b-/- vs Cg>Rel; Gba1b-/- ***p = 2.56x10⁻¹⁵, +/Cg; Gba1b-/- vs +/Rel; Gba1b-/- p = 0.9 and +/Cg vs Cg> Rel p = 0.70.
Fig 7
Fig 7. Loss of Gba1b results in gut autophagy impairment and administration of rapamycin rescues Gba1b-/- immune phenotypes.
(A) Gba1b-/- fly guts show significant accumulation of Atg8a-II and Ref(2)P proteins relative to control guts (*p = 0.024 and *p = 0.049, respectively). Unpaired t-tests; data are presented as mean ± SD (n = 3–4). (B) Immunostainings of guts labelled for Ref(2)P (green), DAPI (blue) and ubiquitin (Ub, red). Gba1b-/- flies display a higher number of aggregates of Ref(2)P and ubiquitinated proteins in the midgut. Scale bar 100 μm. (C) Gut staining with LysoTracker (red) and Hoechst (blue) of 3-week-old flies reveals an increased number of LysoTracker puncta in Gba1b-/- flies (***p<0.0001; unpaired t-test). Scale bar 50 μm. (D) DptA transcript levels are reduced on qRT-PCR analysis of the guts of 3-week-old Gba1b-/- flies treated with Rapamycin (Rapa) compared to non-treated flies (*p = 0.0159). No significant differences are found in control flies (ns = 0.5317). Mann Whitney tests; data are presented as mean ± SD (n = 5 per condition). (E) The survival of Rapa treated control and Gba1b-/- flies (n = 150) is significantly increased. Log-rank tests: Gba1b-/- vs Gba1b-/- Rapa, *** p<0.0001; Control vs Control Rapa *** p<0.0001.
Fig 8
Fig 8. Long-term rapamycin treatment improves Gba1b-/- fly survival by reducing inflammation without altering microbial load.
(A) Quantitative PCR using primers for 16S rRNA gene on the guts of 3-week-old flies does not reveal significant differences in bacterial load of Rapa treated flies for the two genotypes. Significant differences in the bacterial load are observed in control vs Gba1b-/- non-GF flies (**p = 0.0077) and control vs Gba1b-/- non-GF flies treated with Rapa (*p = 0.045). Two-way ANOVA followed by Tukey’s multiple comparison test; data are presented as mean ± SD (n = 4 per condition). (B) There are no significant differences in the CFUs of 3-week-old guts of non-GF flies treated or not treated with Rapa (control ns = 0.991; Gba1b-/- ns = 0.57). Significant differences were found in the comparisons control vs Gba1b-/- non-GF flies (**p = 0.0022) and control vs Gba1b-/- non-GF flies treated with Rapa (**p = 0.0087). Two-way ANOVA followed by Tukey’s multiple comparison tests; data are presented as mean ± SD. (C) GF and Rapa individual treatments extend the lifespan of Gba1b-/- flies to a similar extent (***p<0.0001). No significant additive lifespan extension is observed in GF Gba1b-/- flies treated with Rapa. Log rank test; n = 150. (D) Quantitative RT-PCR analysis of DptA transcript levels in guts from Gba1b-/- flies raised under GF, Rapa and GF/Rapa conditions demonstrates no additive effect on the lowering of DptA levels (non-GF vs GF, **p = 0.0030; non-GF vs non-GF/Rapa, *p = 0.0207; non-GF vs GF/Rapa, *p = 0.0117; GF vs non-GF/Rapa, p = 0.7434; GF vs GF/Rapa, p = 0.766; non-GF/Rapa vs GF/Rapa, p = 0.999). One-way ANOVA followed by Tukey’s multiple comparison test. Data presented as mean ± SD (n = 3–4). (E) Western blot analysis of Ref(2)P and Atg8a on the guts from 3-week-old control flies treated with chloroquine (CQ) for 48 hours. CQ treatment significantly induces accumulation of Ref(2)P (*p = 0.028) and Atg8a-II (*p = 0.0269). Mann Whitney tests; data are presented as mean ± SD (n = 4 per condition). (F) DptA transcript levels are increased on qRT-PCR analysis of 3-week-old control fly guts treated with CQ for 48 hours compared to non-treated flies (*p = 0.0159; Mann Whitney test; n = 4 per condition). Data are presented as mean ± SD.

References

    1. Migdalska-Richards A, Schapira AH. The relationship between glucocerebrosidase mutations and Parkinson disease. J Neurochem. 2016;139 Suppl 1(Suppl Suppl 1):77–90. Epub 2016/02/11. doi: 10.1111/jnc.13385 ; PubMed Central PMCID: PMC5111601. - DOI - PMC - PubMed
    1. Schapira AH. Glucocerebrosidase and Parkinson disease: Recent advances. Mol Cell Neurosci. 2015;66(Pt A):37–42. Epub 2015/03/25. doi: 10.1016/j.mcn.2015.03.013 ; PubMed Central PMCID: PMC4471139. - DOI - PMC - PubMed
    1. Cox TM. Gaucher disease: clinical profile and therapeutic developments. Biologics. 2010;4:299–313. Epub 2011/01/07. doi: 10.2147/BTT.S7582 ; PubMed Central PMCID: PMC3010821. - DOI - PMC - PubMed
    1. Zunke F, Moise AC, Belur NR, Gelyana E, Stojkovska I, Dzaferbegovic H, et al.. Reversible Conformational Conversion of alpha-Synuclein into Toxic Assemblies by Glucosylceramide. Neuron. 2018;97(1):92–107 e10. Epub 2018/01/02. doi: 10.1016/j.neuron.2017.12.012 ; PubMed Central PMCID: PMC6013314. - DOI - PMC - PubMed
    1. Alcalay RN, Levy OA, Waters CC, Fahn S, Ford B, Kuo SH, et al.. Glucocerebrosidase activity in Parkinson’s disease with and without GBA mutations. Brain. 2015;138(Pt 9):2648–58. Epub 2015/06/29. doi: 10.1093/brain/awv179 ; PubMed Central PMCID: PMC4564023. - DOI - PMC - PubMed

LinkOut - more resources