. 2023 Dec 26;120(52):e2318274120.
doi: 10.1073/pnas.2318274120. Epub 2023 Dec 21.

Mammalian circadian clock proteins form dynamic interacting microbodies distinct from phase separation

Affiliations

Mammalian circadian clock proteins form dynamic interacting microbodies distinct from phase separation

Pancheng Xie et al. Proc Natl Acad Sci U S A. .

Abstract

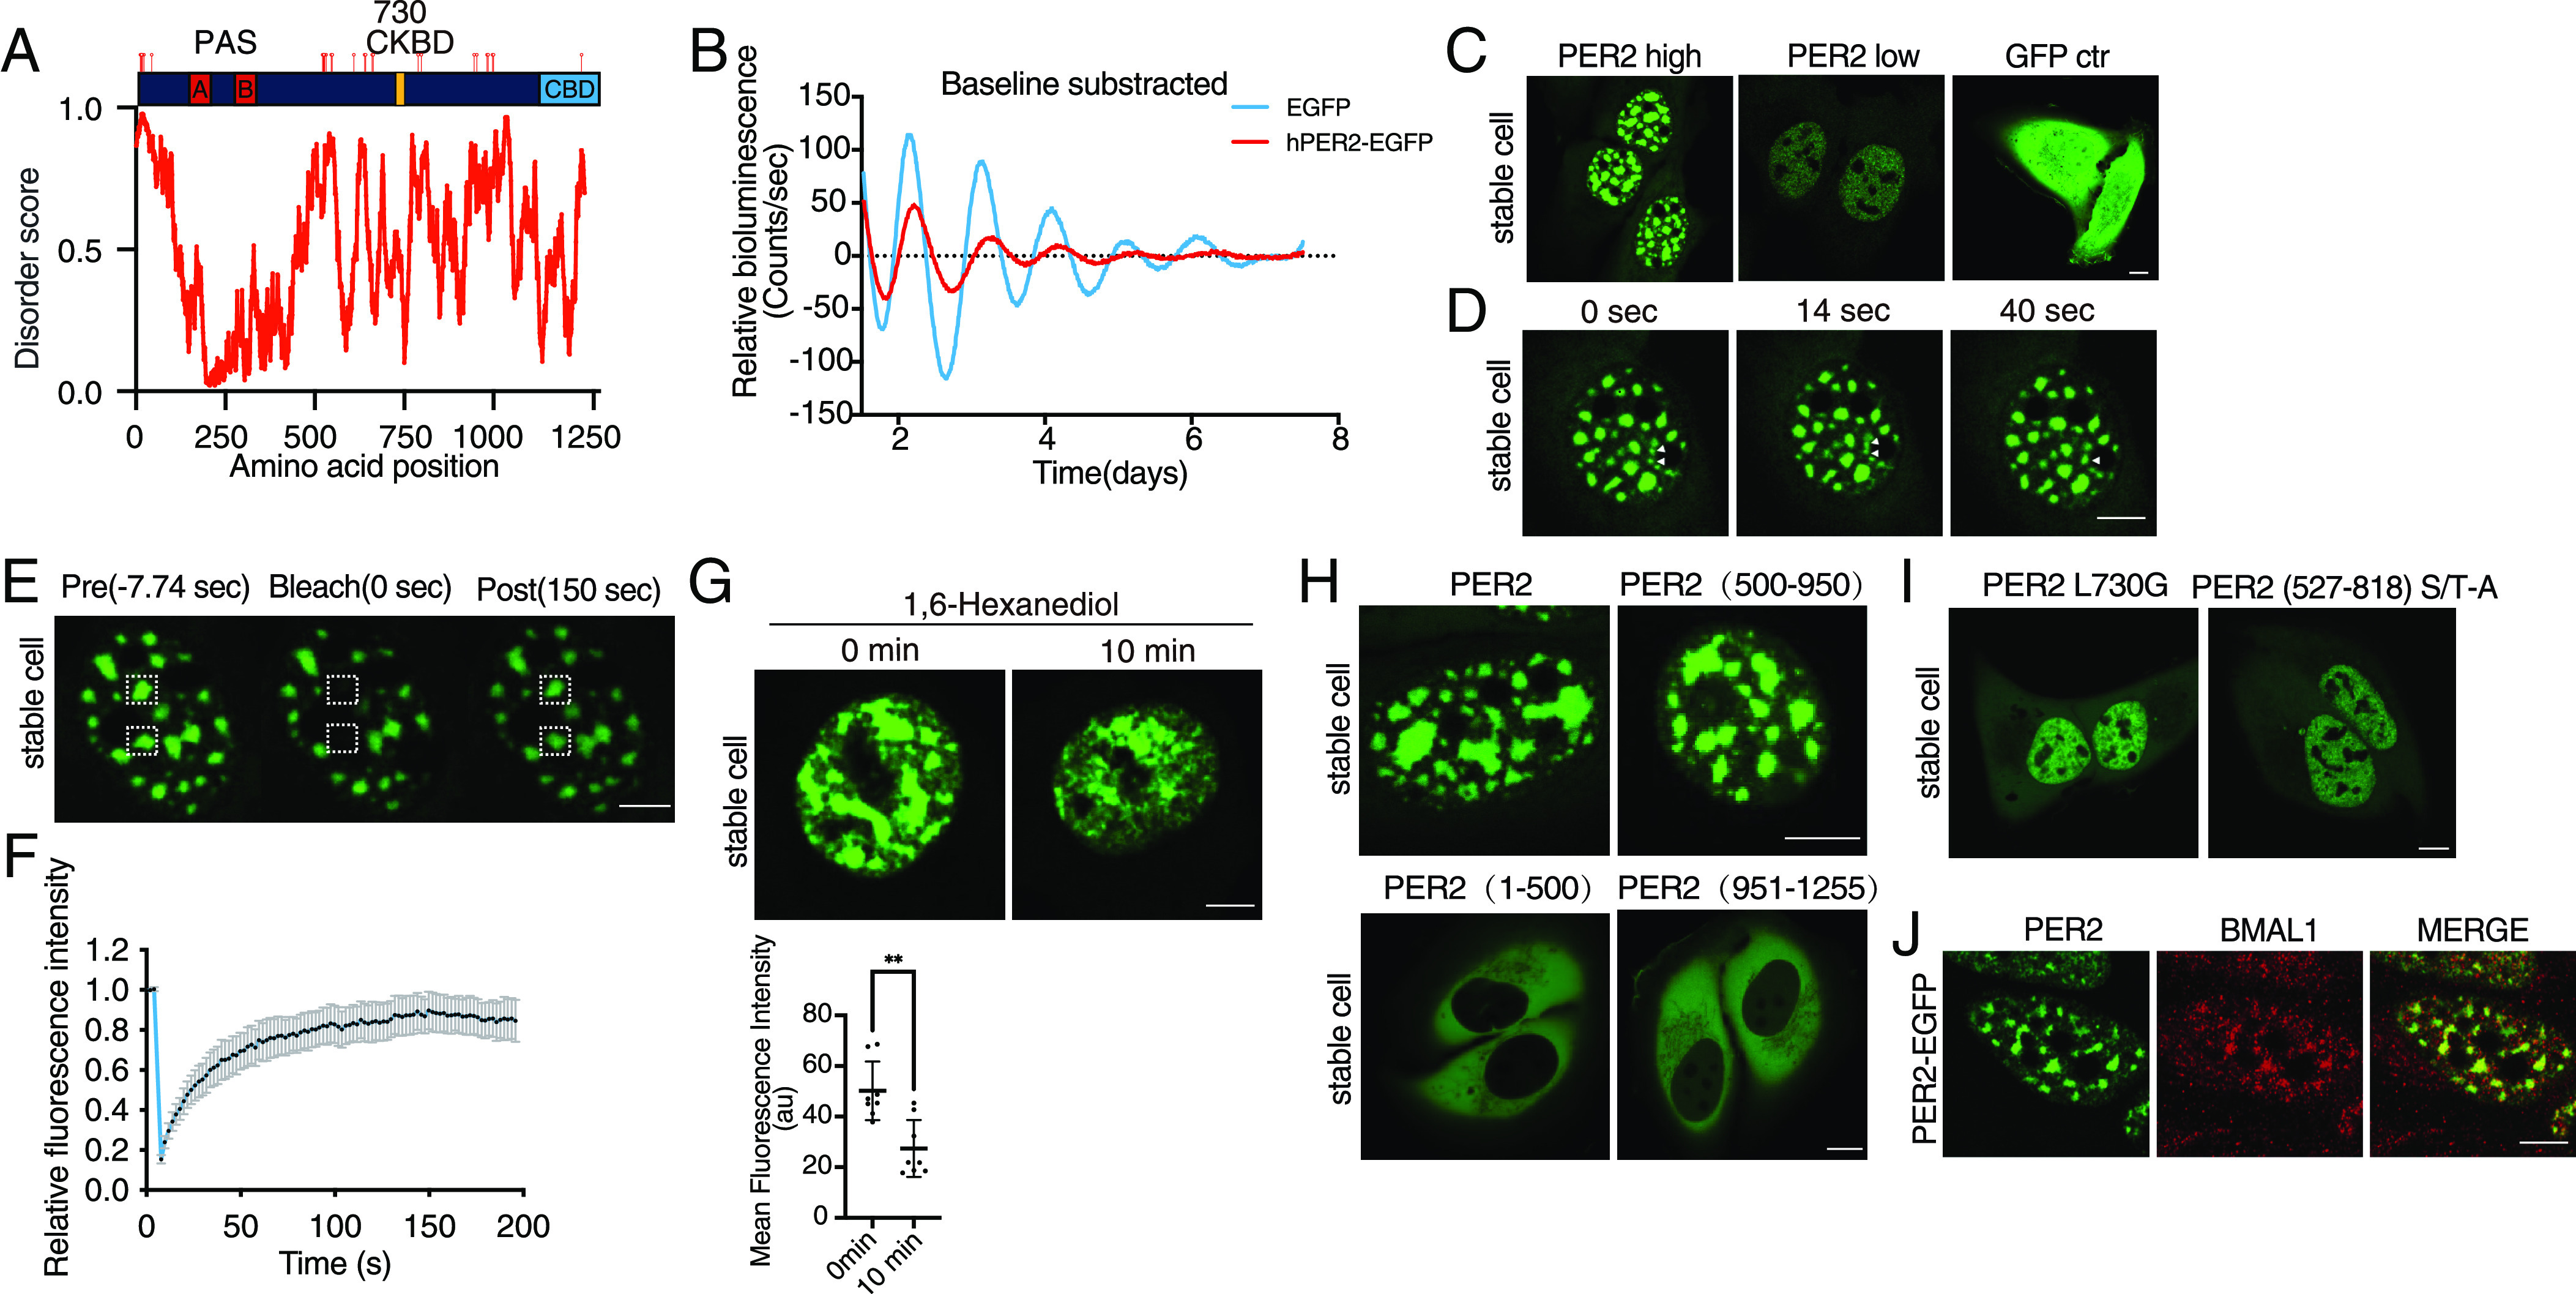
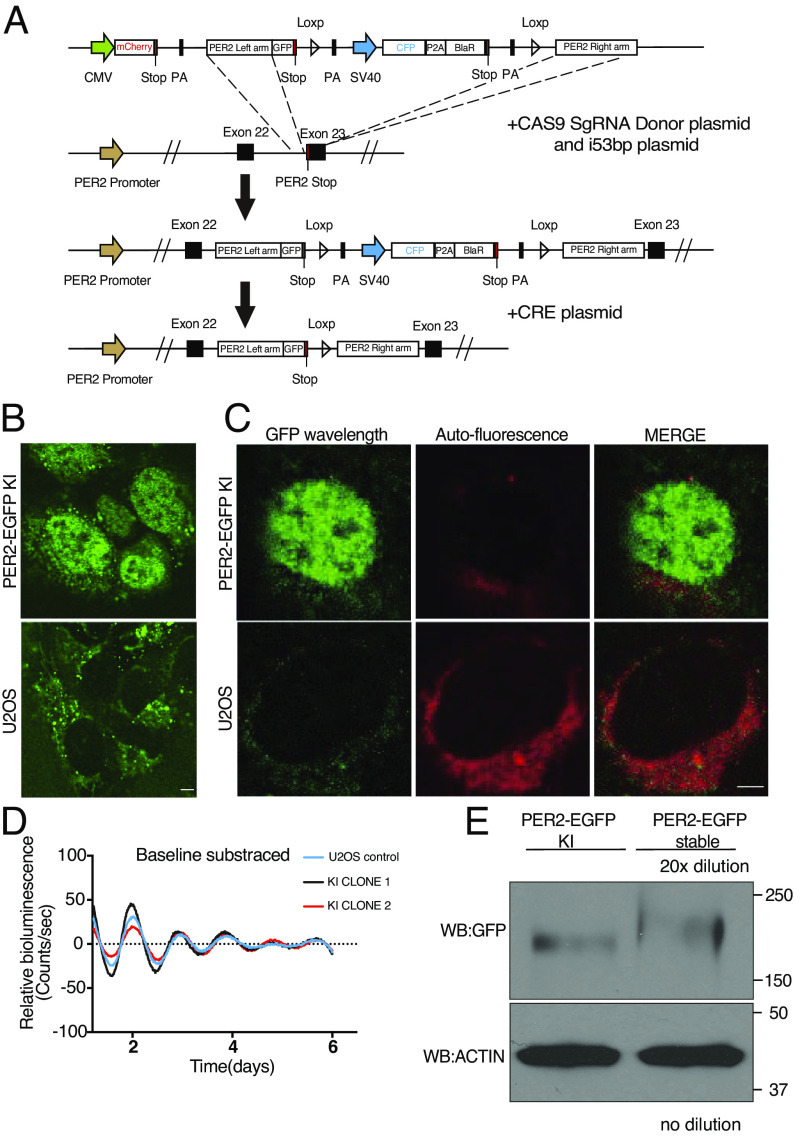
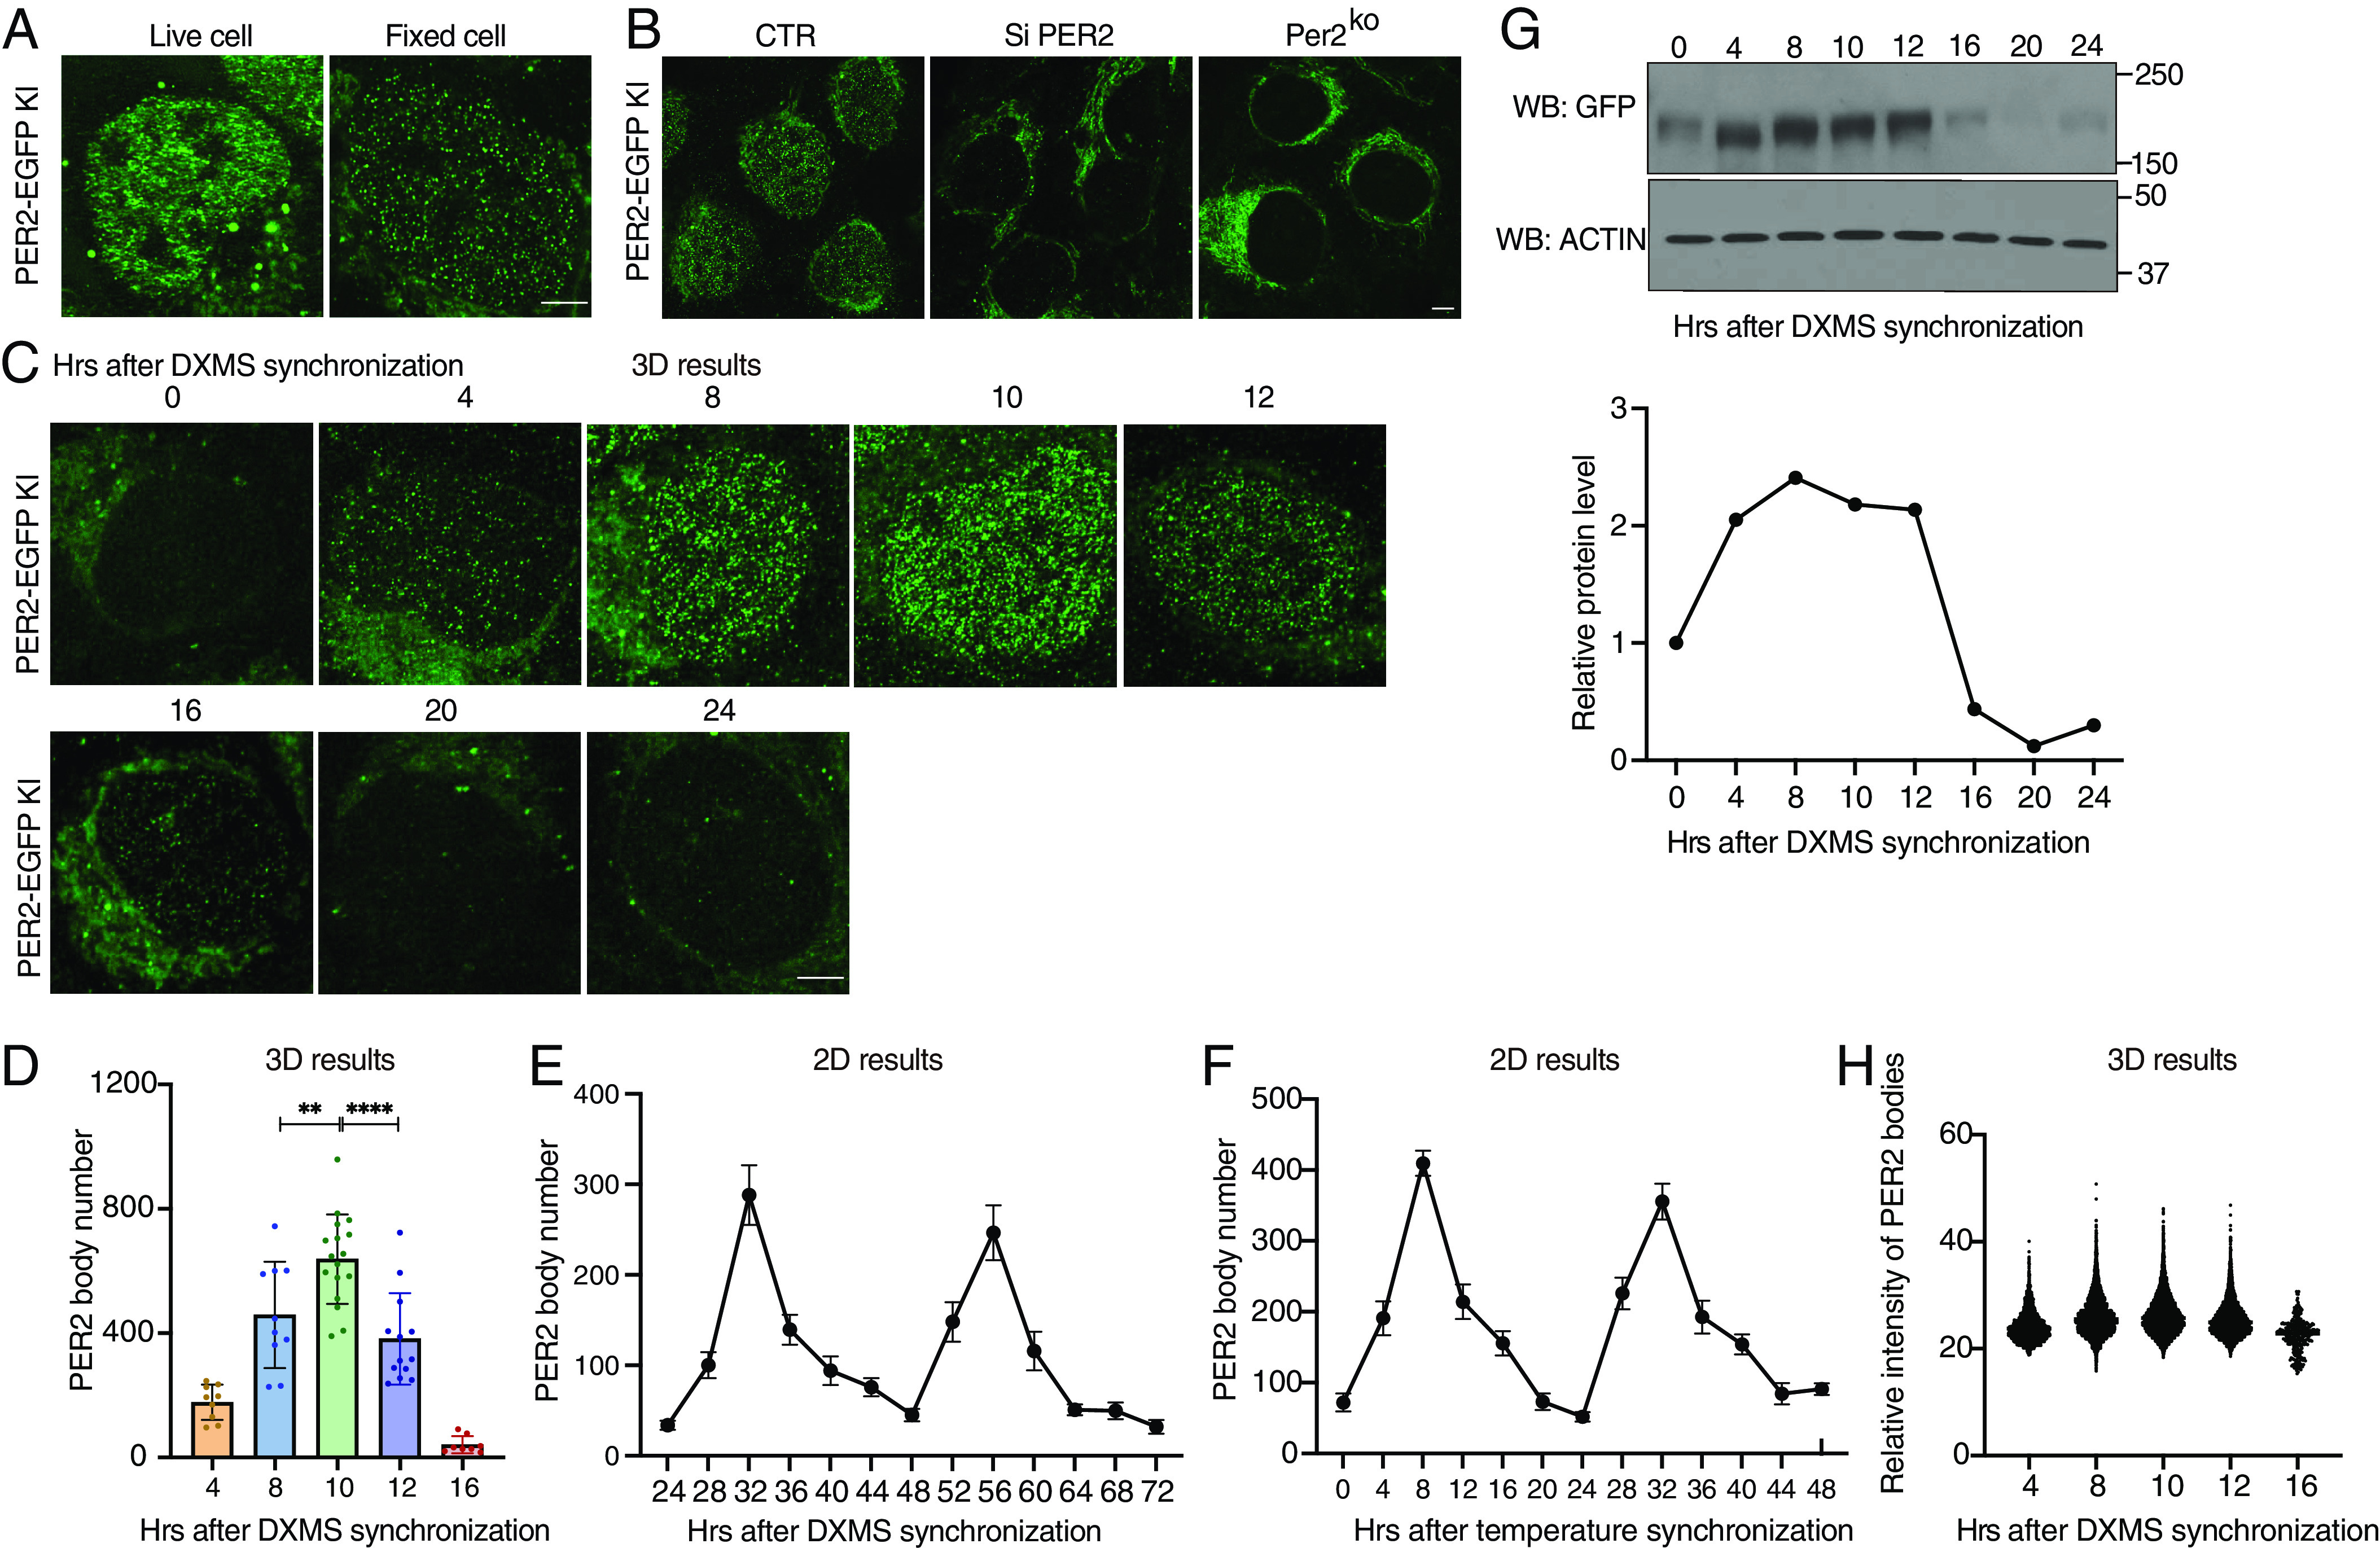
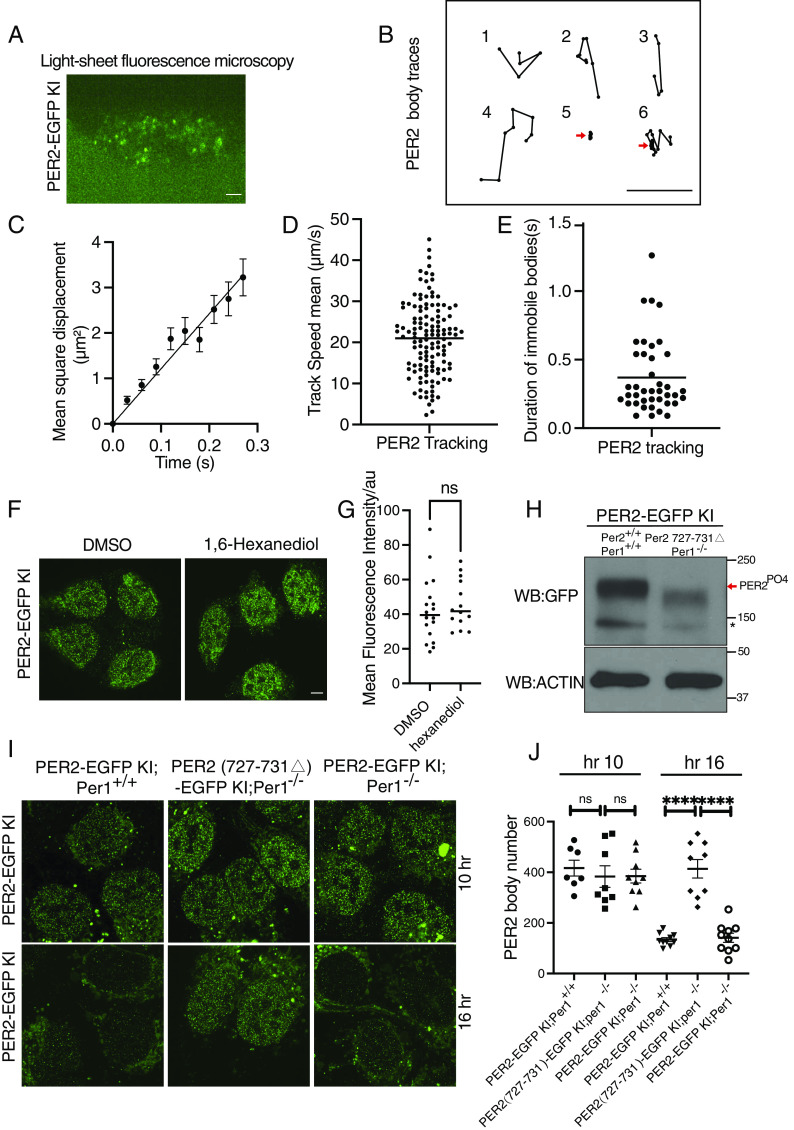
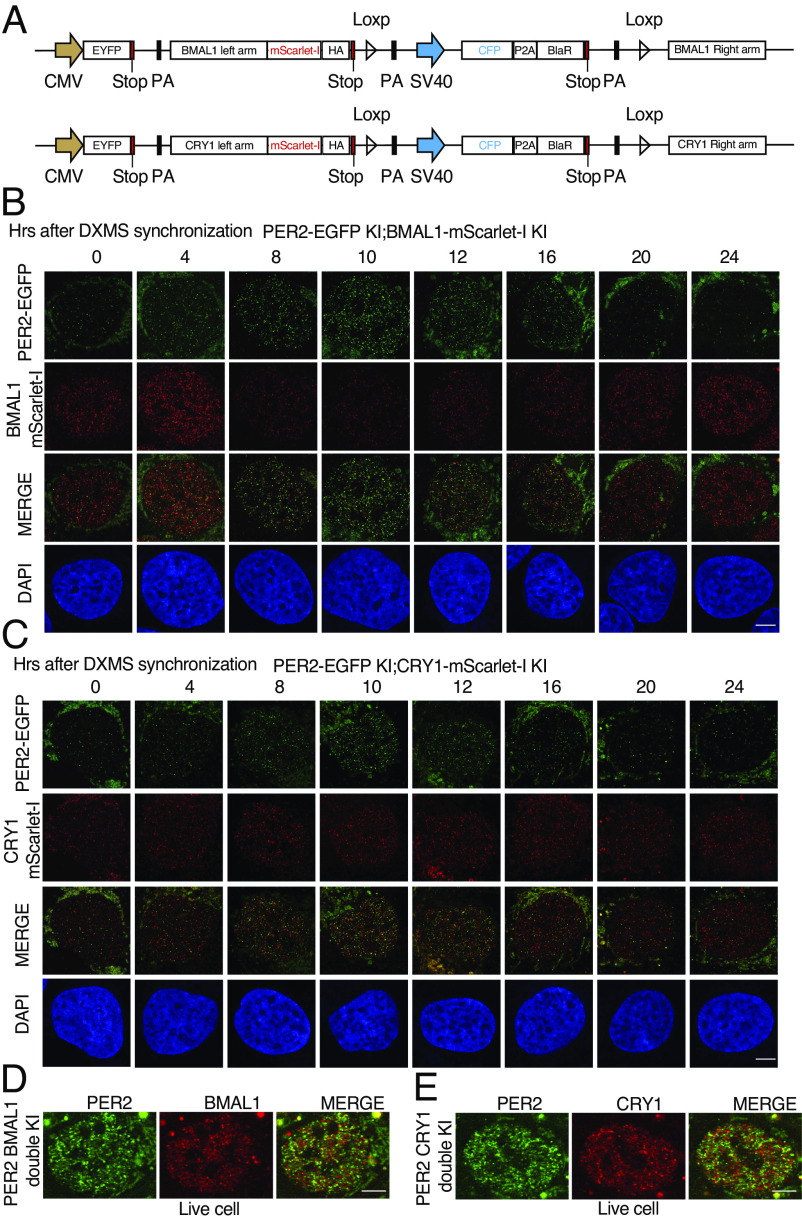
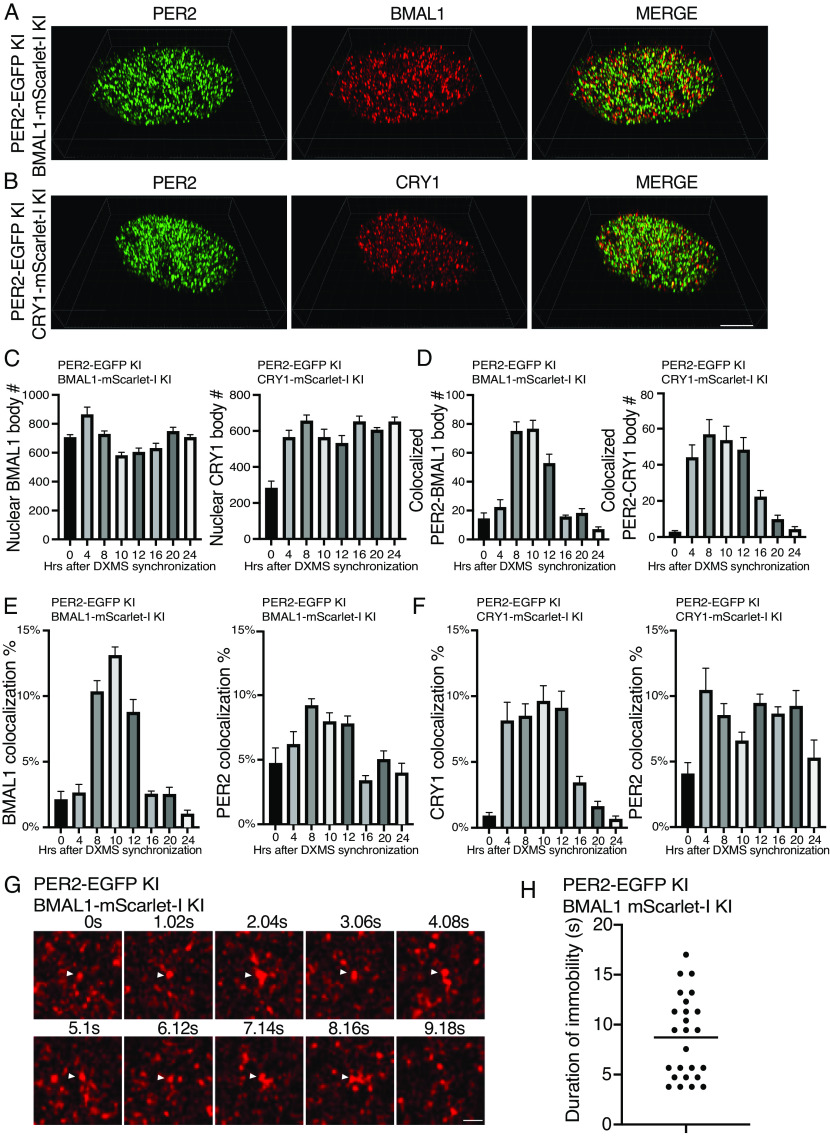
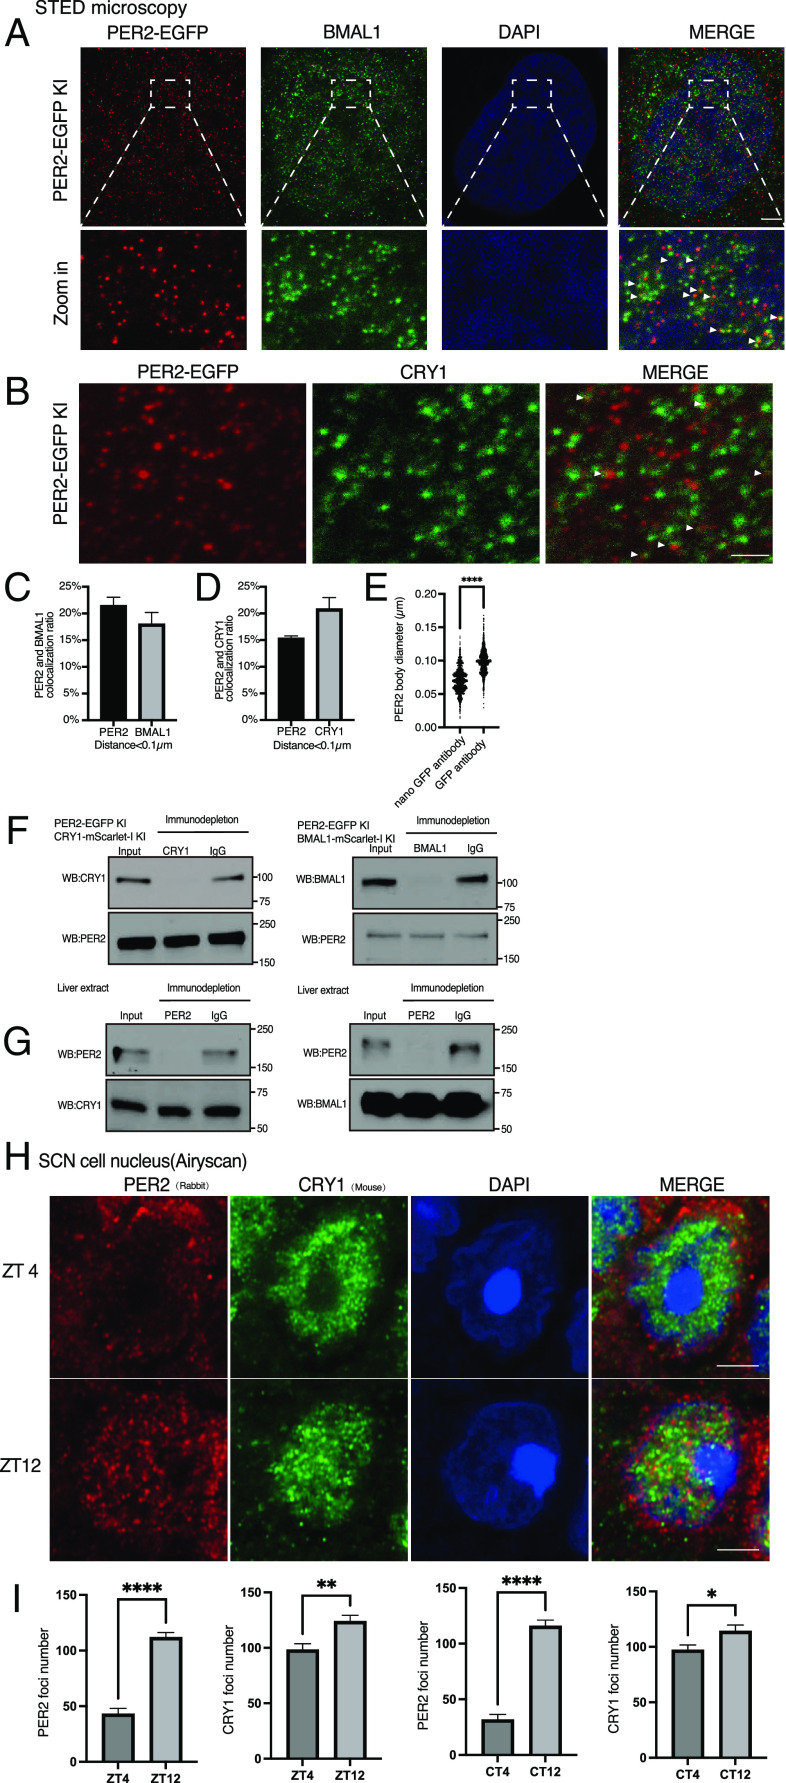
Liquid-liquid phase separation (LLPS) underlies diverse biological processes. Because most LLPS studies were performed in vitro using recombinant proteins or in cells that overexpress protein, the physiological relevance of LLPS for endogenous protein is often unclear. PERIOD, the intrinsically disordered domain-rich proteins, are central mammalian circadian clock components and interact with other clock proteins in the core circadian negative feedback loop. Different core clock proteins were previously shown to form large complexes. Circadian clock studies often rely on experiments that overexpress clock proteins. Here, we show that when Per2 transgene was stably expressed in cells, PER2 protein formed nuclear phosphorylation-dependent slow-moving LLPS condensates that recruited other clock proteins. Super-resolution microscopy of endogenous PER2, however, revealed formation of circadian-controlled, rapidly diffusing nuclear microbodies that were resistant to protein concentration changes, hexanediol treatment, and loss of phosphorylation, indicating that they are distinct from the LLPS condensates caused by protein overexpression. Surprisingly, only a small fraction of endogenous PER2 microbodies transiently interact with endogenous BMAL1 and CRY1, a conclusion that was confirmed in cells and in mice tissues, suggesting an enzyme-like mechanism in the circadian negative feedback process. Together, these results demonstrate that the dynamic interactions of core clock proteins are a key feature of mammalian circadian clock mechanism and the importance of examining endogenous proteins in LLPS and circadian clock studies.

Keywords: PERIOD protein; circadian clock; phase separation; protein interaction.


Conflict of interest statement

Competing interests statement:The authors declare no competing interest.

Figures

Fig. 1.
Fig. 1.
LLPS behavior of PER2-EGFP when it is constitutively overexpressed in U2OS cells. (A) Top: A diagram depicting human PER2 domains and phosphorylation sites. CKBD:Casein Kinase Binding domain. CBD: CRY binding domain. Location of the known phosphorylation sites was indicated (11). Bottom: Disorder score across the human PER2 protein as predicted by IUPred. (B) Representative bioluminescence rhythms of the U2OS cells that stably express either EGFP or PER2-EGFP as well as a Per2(E2)-Luc reporter. Rhythms were monitored by LumiCycle, and baseline-subtracted bioluminescence data are plotted (n = 3). (C) Representative confocal images of cells stably express PER2-EGFP (high and low levels) and of control cells that express EGFP. (Scale bar: 5 μm.) (D) Images of a live cell that stably expresses PER2-EGFP over time. Two condensates that fused during the time course are indicated. (E) Images of a live U2OS cell that stably expresses PER2-EGFP before and after photobleaching of regions marked by squares. (F) Relative fluorescence intensity of PER2-EGFP condensates after photobleaching in the PER2-EGFP stable cells. Data are presented as mean ± SD (n = 11). (G) Top: Images of live cells that express PER2-EGFP at 0 min and 10 min after treatment with 1,6-hexanediol (1.5%). Bottom: Quantification of mean fluorescence intensity of PER2-EGFP nuclei at 0 min and 10 min after treatment with 1,6-hexanediol. n = 8 cells. Data are presented as mean ± SD, unpaired two-tailed Student’s t test, ∗∗P < 0.01. (H) Representative confocal images of U2OS cells that overexpress the indicated PER2-EGFP proteins. (I) Confocal images cells that constitutively express PER2(L730G)-EGFP or PER2(527-818 S/T-A)-EGFP (PER2 with known and potential phosphorylation sites within aa 527-818 mutated to alanines). (J) Fluorescence immunostaining of endogenous BMAL1 in cells that stably overexpresses PER2-EGFP. Endogenous BMAL1 was stained with a BMAL1 antibody, and PER2-EGFP was monitored using the GFP channel.
Fig. 2.
Fig. 2.
CRISPR/Cas9-mediated knock-in to tag the endogenous PER2 with EGFP. (A) Schematic of PER2-EGFP knock-in donor plasmid and genome editing strategy. (B) Live cell confocal imaging of PER2-EGFP KI U2OS cells and U2OS cells without KI. (Scale bar: 5 μm.) (C) Lambda scan of PER2-EGFP KI cells and control cells. The GFP wavelength was extracted, and all other wavelengths were merged as background. (D) Representative bioluminescence rhythms of the Per2(E2)-Luc reporter in the PER2-EGFP KI and control U2OS cells. Baseline-subtracted bioluminescence data are plotted (n = 3). (E) Western blot showing the PER2-EGFP levels in the PER2-EGFP KI cells and cells that stably overexpress PER2-EGFP. The protein sample from the cells that stably overexpress PER2-EGFP was diluted 20-fold.
Fig. 3.
Fig. 3.
Super-resolution imaging of PER2-EGFP KI cells showing PER2 is concentrated in nuclear microbodies. (A) Airyscan confocal imaging of live (Left) and fixed (Right) PER2-EGFP KI cells in the nucleus. (Scale bar: 5 μm.) (B) Airyscan imaging of fixed PER2-EGFP KI cells (Left), KI cells treated with Per2-specific siRNA (si-PER2), and Per2KO cells. (C) Time course 3D imaging results of nuclear GFP signals in PER2-EGFP KI cells after dexamethasone synchronization. Representative 2D images from the 3D results are shown. (D) Numbers of nuclear PER bodies at different time points after dexamethasone synchronization (n = 8 to 17 cells), unpaired two-tailed Student’s t test. (E and F) Quantification of the PER2-EGFP microbodies of time course 2D imaging results of the PER2-EGFP KI cells after dexamethasone synchronization from h 24 to 72 (E) or after temperature cycle synchronization from h 0 to 48 (F). (G) Top: Western blot of EGFP in PER2-EGFP KI cells after dexamethasone synchronization. Equal amount of protein was loaded in each lane. Bottom: Quantification of PER2-EGFP levels. (H) Nuclear PER body mean fluorescence intensities after dexamethasone synchronization (n = 8 to 17 cells).
Fig. 4.
Fig. 4.
Most PER2 bodies diffuse freely in the nucleus and are formed by a mechanism distinct from overexpression-caused LLPS condensates. (A) Representative image of nuclear PER bodies in PER2-EGFP KI cell under light-sheet fluorescence microscopy at hour 10 after synchronization. (Scale bar: 5 μm.) (B) Representative movement tracks of PER bodies. 1 to 4: freely diffusing tracks. 5: immobile tracks. 6: a diffusing PER body became immobile. (C) The averaged MSD of PER bodies computed from data collected from three cells. Data are presented as means ± SEM. (D) Mean speeds of different tracks (n = 3 cells). (E) Duration of immobility of PER2 bodies of the identified immobile PER2 bodies (data collected from three cells). (F) Representative image of nuclear PER bodies at 10 min after treatment with DMSO or 1,6-hexanediol in KI cells at hour 10 after synchronization. (G) Comparison of nuclear PER2-EGFP fluorescence intensities of KI cells at 10 min after treatment with DMSO or 1,6-hexanediol at hour 10 after synchronization. Data are presented as median fluorescence intensity in each cell. n = 14 to 18 cells. (H) Western blot of PER2-EGFP in the indicated cells at hour 10 after synchronization. The arrow indicates the phosphorylated PER2-EGFP species. * a background band. (I) Representative Airyscan images of PER bodies in the indicated cells at hour 10 after synchronization. (J) Nuclear PER2 body numbers in the indicated cells at 10 h and 16 h after dexamethasone synchronization.
Fig. 5.
Fig. 5.
Airyscan imaging analyses of dual fluorescence reporter U2OS cells in which the endogenous PER2 and BMAL/CRY1 are tagged by EGFP and mScarlet-I, respectively. (A) Diagrams showing the design of the knock-in donor plasmids. (B) Time course Airyscan fluorescence imaging of PER2 and BMAL1 in fixed indicated KI cells after dexamethasone synchronization. (Scale bar: 5 μm.) (C) Time course Airyscan imaging of PER2 and CRY1 in fixed double KI cells after dexamethasone synchronization. (D and E) Airyscan fluorescence imaging of PER2 and BMAL1/CRY1 in live double KI cells.
Fig. 6.
Fig. 6.
Airyscan imaging analyses of double KI cells showing that most PER2 bodies do not associate with BMAL1/CRY1 and the DNA residence time of BMAL1. (A and B) 3D Airyscan imaging result of PER2-EGFP and BMAL1/CRY1-mScarlet-I double KI cells at hour 10 after synchronization. Representative converted 2D nuclear images were shown. The 3D Airyscan imaging results for other time points are presented in SI Appendix, Supplemental Data Files. (Scale bar: 5 μm.) (C) Numbers of BMAL1 bodies and CRY1 bodies after dexamethasone synchronization in the double KI cells. Data are means ± SEM (n = 8 cells). (D) Numbers of PER2 and BMAL/CRY1 foci that colocalize after dexamethasone synchronization. Threshold distance for colocalization was set <100 nm. n = 8 cells. (E and F) Percentages of BMAL1/CRY1 and PER2 foci that colocalize after synchronization in the indicated PER2 and BMAL1/CRY1 double KI cells. n = 8 cells. (G) Time series of live cell Airyscan imaging of nuclear BMAL1 foci in the BMAL1-mScarlet-I knock-in cells. The arrow indicates immobile BMAL1 foci. Frame rate: 1.02 s/frame. (Scale bar: 5 μm.) (H) Summary of duration of immobility of identified immobile BMAL1 foci in the BMAL1-mScarlet-I KI cells. n = 10 cells.
Fig. 7.
Fig. 7.
PER, BMAL1, and CRY1 microbodies and their interactions revealed by STED microscopy. (A and B) STED microscopy images of PER2 and BMAL1/CRY1 puncta in the PER2-EGFP KI cells at 10 h after synchronization. PER2, BMAL1, and CRY1 were stained by anti-GFP (mouse), anti-BMAL1 antibody (rabbit), and anti-CRY1 antibody, respectively. (Scale bar: 5 μm.) (C and D) Percentages of PER2 and BMAL1/CRY1 bodies that colocalize at 10 h after synchronization. Distance threshold was set <100 nm. Data are presented as mean ± SEM (n = 8 cells). (E) Comparison of PER body sizes estimated by conventional anti-GFP antibody and anti-GFP nanobody. n = 5 cells. (F and G) Immunodepletion assay of CRY1 or BMAL1 in extracts prepared from the indicated double KI U2OS cells 10 h after synchronization (F) or from mice liver tissue (ZT18) (G). After immunodepletion, western blot analyses were performed using the indicated antibodies. (H) Representative immunofluorescence imaging results in the nucleus using mice SCN tissues harvested at the indicated ZT time points using a rabbit polyclonal PER2 and a mouse CRY1 antibody, respectively. Cells from the core SCN region were selected. (I) Quantification of the nuclear PER2/CRY1 foci numbers in the SCN cells at the indicated time points.

Update of

References

    1. Takahashi J. S., Transcriptional architecture of the mammalian circadian clock. Nat. Rev. Genet. 18, 164–179 (2017). - PMC - PubMed
    1. Partch C. L., Green C. B., Takahashi J. S., Molecular architecture of the mammalian circadian clock. Trends Cell Biol. 24, 90–99 (2014). - PMC - PubMed
    1. Hastings M. H., Reddy A. B., Maywood E. S., A clockwork web: Circadian timing in brain and periphery, in health and disease. Nat. Rev. Neurosci. 4, 649–661 (2003). - PubMed
    1. Schmalen I., et al. , Interaction of circadian clock proteins CRY1 and PER2 is modulated by zinc binding and disulfide bond formation. Cell 157, 1203–1215 (2014). - PubMed
    1. Nangle S. N., et al. , Molecular assembly of the period-cryptochrome circadian transcriptional repressor complex. Elife 3, e03674 (2014). - PMC - PubMed