. 2023 Dec 26;120(52):e2311460120.
doi: 10.1073/pnas.2311460120. Epub 2023 Dec 21.

p53 deficient breast cancer cells reprogram preadipocytes toward tumor-protective immunomodulatory cells

Affiliations

p53 deficient breast cancer cells reprogram preadipocytes toward tumor-protective immunomodulatory cells

Ori Hassin et al. Proc Natl Acad Sci U S A. .

Abstract

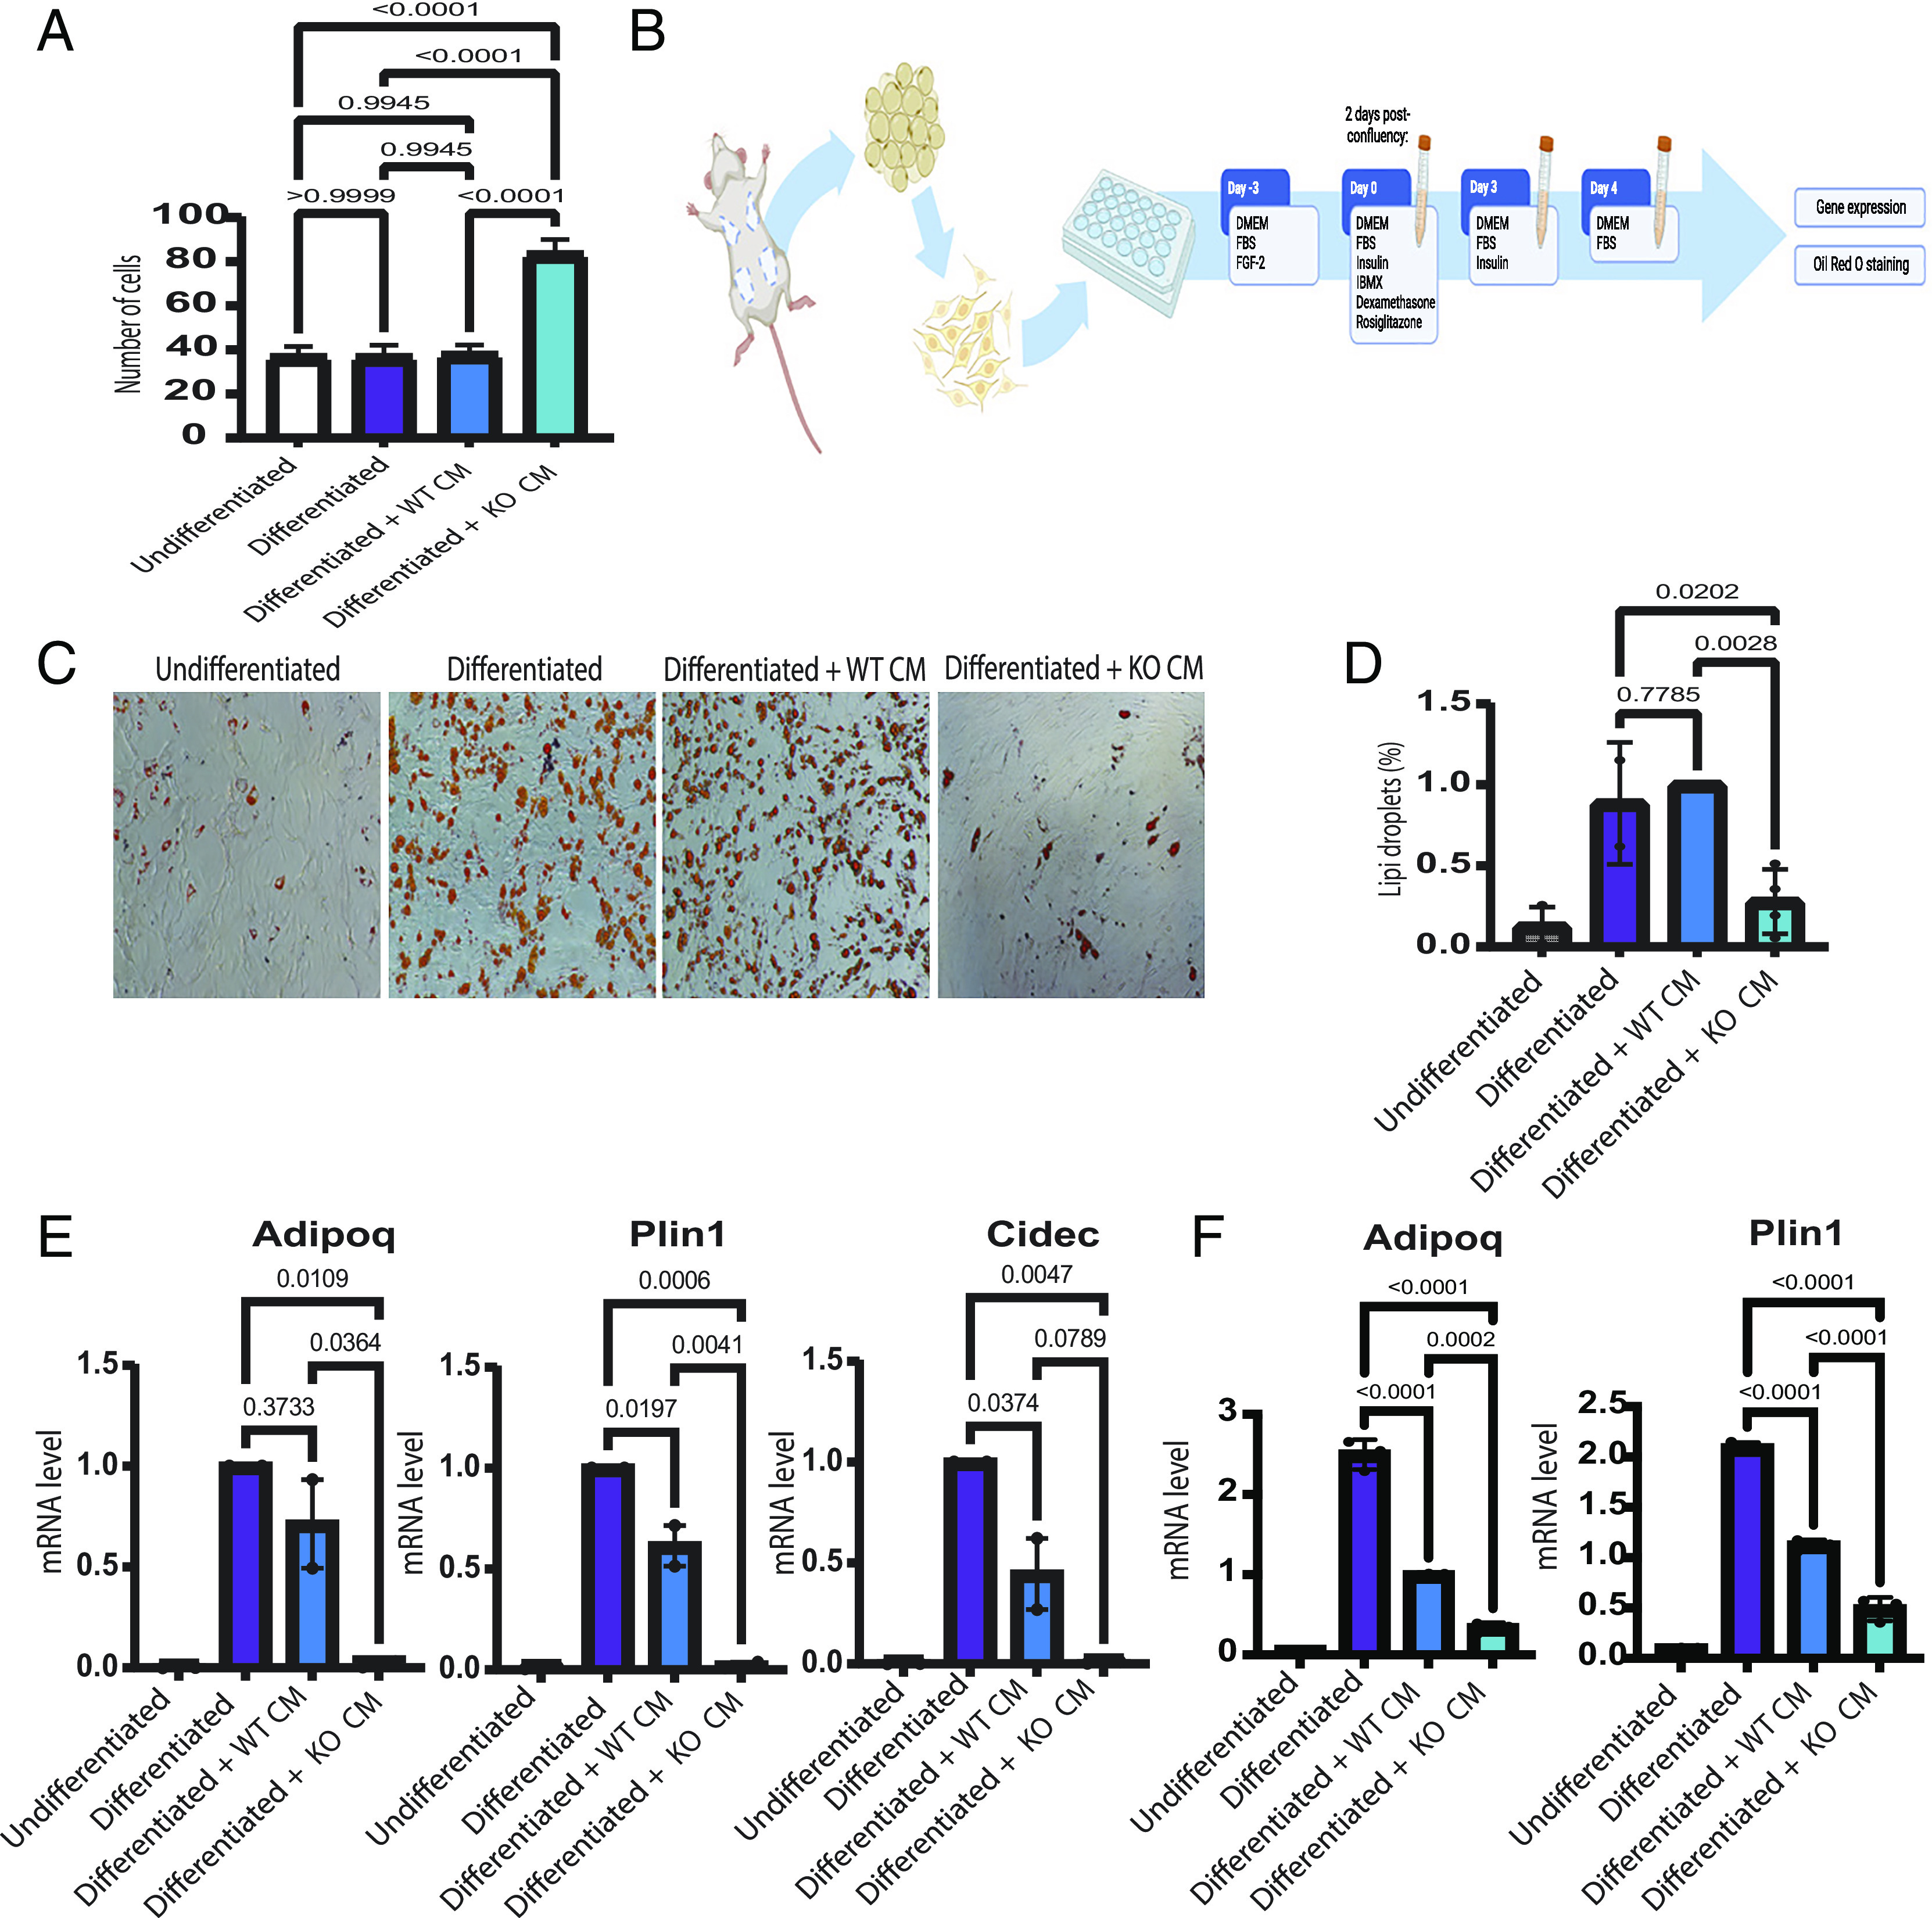
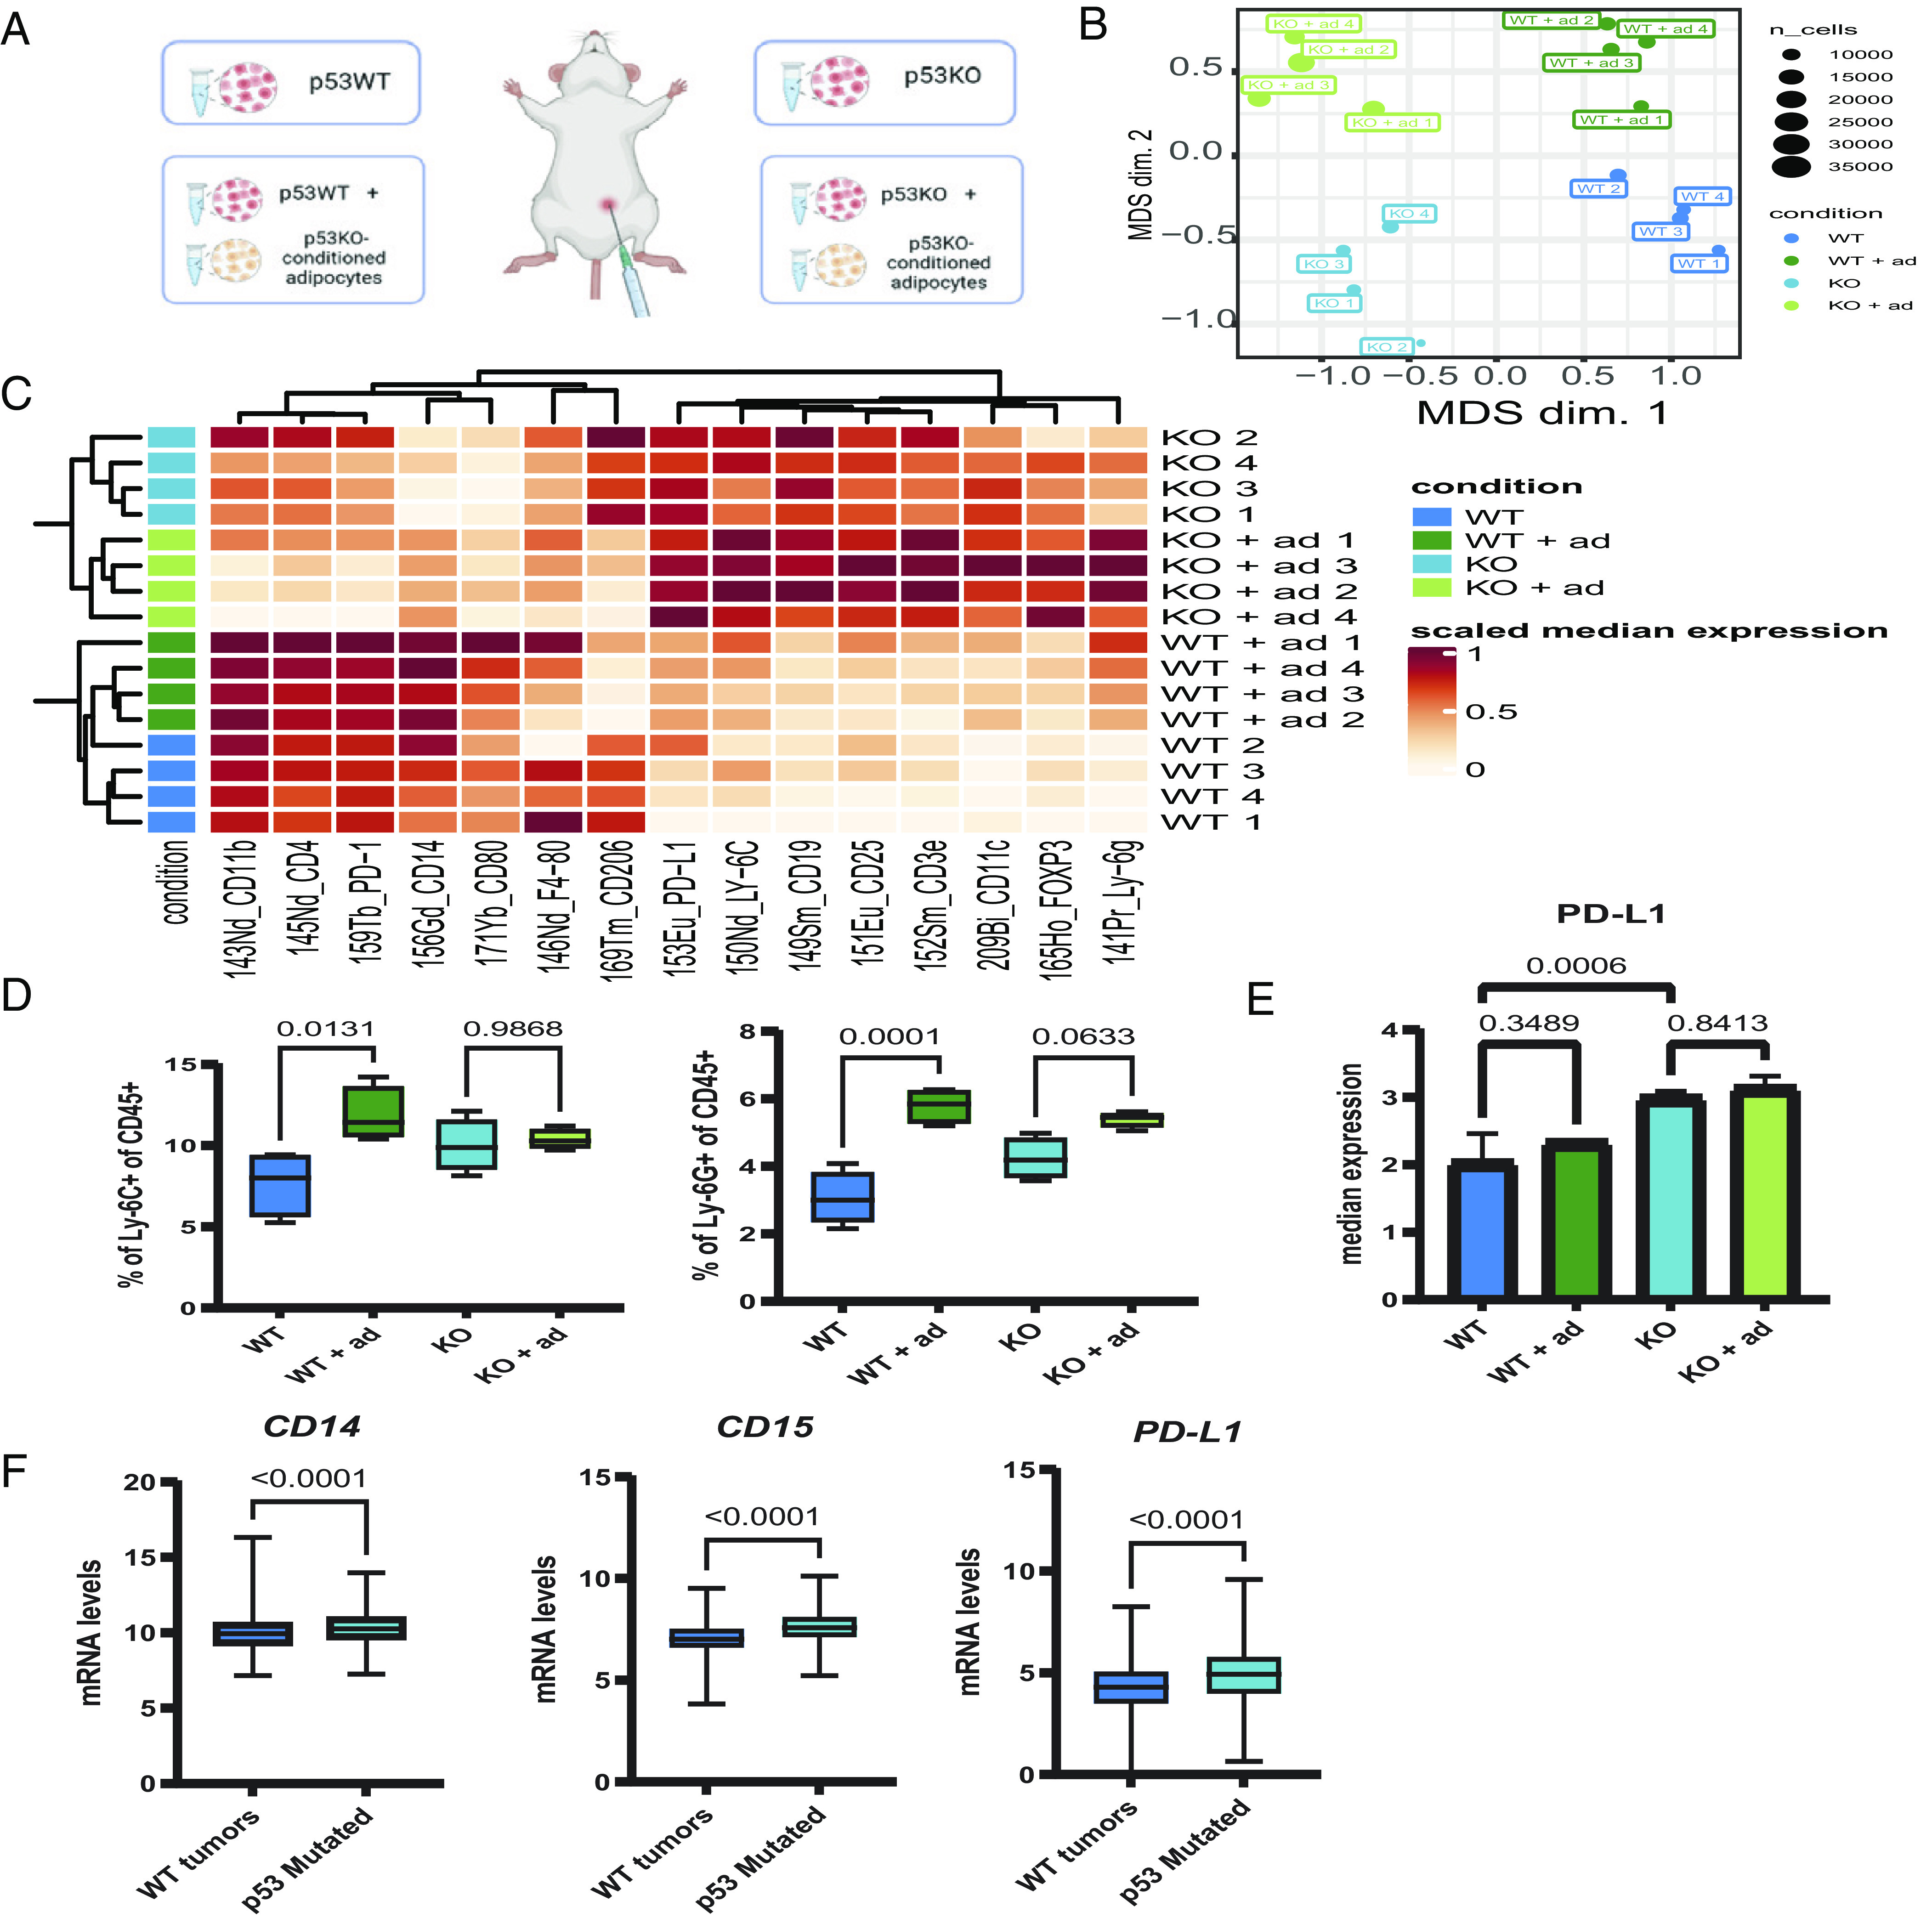
The TP53 gene is mutated in approximately 30% of all breast cancer cases. Adipocytes and preadipocytes, which constitute a substantial fraction of the stroma of normal mammary tissue and breast tumors, undergo transcriptional, metabolic, and phenotypic reprogramming during breast cancer development and play an important role in tumor progression. We report here that p53 loss in breast cancer cells facilitates the reprogramming of preadipocytes, inducing them to acquire a unique transcriptional and metabolic program that combines impaired adipocytic differentiation with augmented cytokine expression. This, in turn, promotes the establishment of an inflammatory tumor microenvironment, including increased abundance of Ly6C+ and Ly6G+ myeloid cells and elevated expression of the immune checkpoint ligand PD-L1. We also describe a potential gain-of-function effect of common p53 missense mutations on the inflammatory reprogramming of preadipocytes. Altogether, our study implicates p53 deregulation in breast cancer cells as a driver of tumor-supportive adipose tissue reprogramming, expanding the network of non-cell autonomous mechanisms whereby p53 dysfunction may promote cancer. Further elucidation of the interplay between p53 and adipocytes within the tumor microenvironment may suggest effective therapeutic targets for the treatment of breast cancer patients.

Keywords: adipocytes; breast cancer; p53; preadipocytes.


Conflict of interest statement

Competing interests statement:K.E.d.V. is consultant for Macomics.

Figures

Fig. 1.
Fig. 1.
p53 loss in murine breast cancer cells inhibits adipocytic differentiation. (A) Relative abundance of PLIN1 and CIDEC mRNA in p53wt breast tumors (n = 1,236) versus p53 mutated tumors (n = 653) in the METABRIC dataset. Two-sample t test. Note: The METABRIC microarrays do not include ADIPOQ probes. (B) Relative abundance of ADIPOQ, PLIN1, and CIDEC mRNA in p53wt breast tumors (n = 638) versus p53 mutated tumors (n = 327) in TCGA dataset (BRCA cohort). Two-sample t test. (C) Protocol for 3T3-L1 differentiation in the presence of conditioned medium (CM) from parental or Trp53 knockout mouse breast cancer cells (WEA or WEP cell lines). Figure created with https://www.BioRender.com. (D) Oil-Red-O staining of undifferentiated 3T3-L1 preadipocytes, 3T3-L1 cells induced to differentiate in the presence of regular differentiation medium (Differentiated) or differentiation medium supplemented (1:1 ratio) with CM from WT or p53KO WEA cells. (E) Quantification of lipid droplets in the cell cultures in (D). Quantification was done with ImageJ Macro script. Mean + SEM from three biological repeats (one-way ANOVA and Tukey’s post hoc test). (F) qRT-PCR analysis of mature adipocyte marker mRNAs in the cells in (D). Values were first normalized to Nono mRNA in the same samples and are shown relative to 3T3-L1 preadipocytes undergoing regular differentiation. Mean + SEM from three biological repeats (one-way ANOVA and Tukey’s post hoc test).
Fig. 2.
Fig. 2.
Phenotypic and transcriptional changes induced by CM from p53KO breast cancer cells are recapitulated in primary preadipocytes. (A) Cell counts (in thousands) of undifferentiated 3T3-L1 preadipocytes and 3T3-L1 cells induced to differentiate in the presence of regular differentiation medium or differentiation medium supplemented (1:1) with CM from WT or p53KO WEA cells. Mean + SEM from three repeats (one-way ANOVA and Tukey’s post hoc test). (B) Protocol for isolation and differentiation of murine mammary fat pad primary preadipocytes. Figure created with https://www.BioRender.com. (C) Oil-Red-O staining of undifferentiated primary preadipocytes and primary preadipocytes induced to differentiate in the presence of regular differentiation medium or differentiation medium supplemented (1:1) with CM from WT or p53KO WEA cells. (D) Quantification of lipid droplets in the cell cultures in (C). Quantification was done with ImageJ Macro script. Mean + SEM from multiple biological repeats (one-way ANOVA and Tukey’s post hoc test). (E) qRT-PCR analysis of mature adipocyte marker mRNAs in the cells in (C). Values were normalized to Nono mRNA and are shown relative to primary preadipocytes undergoing regular differentiation. Mean + SEM from two biological repeats (one-way ANOVA and Tukey’s post hoc test). (F) qRT-PCR analysis of Adipoq and Plin1 mRNA in differentiated 3T3-L1 adipocytes incubated with CM from WT or p53KO WEA cells. 3T3-L1 cells were differentiated for 7 d and then incubated for two consecutive 48 h periods with the indicated CM. Values were normalized to Nono mRNA in the same samples and are shown relative to differentiated adipocytes exposed to WT CM. Mean + SEM from three technical replicates (one-way ANOVA and Tukey’s post hoc test). Similar results were obtained in two additional independent experiments.
Fig. 3.
Fig. 3.
CM of p53-deficient breast cancer cells orchestrates a distinct transcriptional program in differentiation-induced preadipocytes. (A) Venn diagram displaying the numbers of significant (fold change > 1.5, Padj < 0.1) downregulated genes in 3T3-L1 cells differentiated with p53KO WEA or WEP CM, respectively, when compared to the corresponding WT CM. Of those downregulated genes, 242 were shared between both cell line models. (B) Heatmap of the relative expression of the 242 common downregulated genes in (A) in undifferentiated 3T3-L1 cells (Undiff) versus 3T3-L1 induced to differentiate with regular differentiation medium (Diff) or differentiation medium supplemented (1:1) with CM from WT or p53KO WEA cells. (C) Top enriched pathways of the 242 common downregulated genes from (A). Data from Metascape software. (D) Venn diagram displaying the numbers of significant (fold change > 1.5, Padj < 0.1) upregulated genes in 3T3-L1 cells differentiated with p53KO WEA or WEP CM, respectively, when compared to the corresponding WT CM. Of those upregulated genes, 123 were shared between both cell line models. (E) Heatmap of the relative expression of the 123 common upregulated genes in (D) in undifferentiated 3T3-L1 cells (Undiff) versus 3T3-L1 induced to differentiate with regular differentiation medium (Diff) or differentiation medium supplemented (1:1) with CM from WT or p53KO WEA cells. The black rectangle on upper right indicates a cluster of 32 genes that were significantly upregulated in 3T3-L1 cells differentiated with WEA p53KO CM relative to undifferentiated 3T3-L1 cells. (F) Top enriched pathways of 41 genes out of the 123 common upregulated genes in (D) that encode secreted proteins, as defined by DAVID analysis. Data from Metascape software.
Fig. 4.
Fig. 4.
CM from p53-deficient breast cancer cells reprograms the intracellular lipidome of 3T3-L1 preadipocytes. (A) Volcano plot of lipidomic analysis of 3T3-L1 cells induced to differentiate in the presence of differentiation medium supplemented (1:1) with CM from p53 WT or p53KO WEP cells treated for 24 h with 7 μM Nutlin-3a. Significantly up or downregulated lipids in 3T3-L1 cells exposed to p53KO CM, relative to cells exposed to WT CM, are defined by P-value < 0.01 (Two-sample t test) and log2FC cutoff ±1. Triacylglycerides (TG) are marked by squares; the top five upregulated lipids are indicated individually. (B) Summed abundance of detected neutral and storage lipids in the cells in (A). (C) Summed abundance of significantly altered membrane-phospholipids in the cells in (A). (D) Summed abundance of significantly altered lysophospholipids in the cells in (A). (E) Summed abundance of sphingolipids (SM) in the cells in (A). (F) Summed abundance of significantly altered phospholipids containing poly-unsaturated fatty acids (PUFA) in the cells in (A). Abbreviations: phosphatidylcholine (PC); monoacylglycerides (MG); diacylglycerides (DG); ether-linked plasmanyl PE (PE(O-)); phosphatidylethanolamine (PE); phosphatidylglycerol (PG); phosphatidylserine (PS); lysophosphatidylcholine (LPC); ether-linked LPC (O-LPC); lysophosphatidylserine (LPS); sphingomyelin (SM). In (BF) data (n = 5) are expressed as mean ± SD; unpaired Two-sample t test, P-value <0.05 = *, <0.01 = **, <0.001 = ***, <0.0001 = ****.
Fig. 5.
Fig. 5.
CM from p53-deficient breast cancer cells reprograms primary preadipocytes toward an immunomodulatory state in vivo. (A) WT or p53KO WEA cells were injected orthotopically, alone or in combination with primary adipocytes differentiated with p53KO WEA CM, into mammary fat pads of syngeneic FVB/N female mice (n = 4 tumors of each group). Tumors were harvested after 20 d and subjected to CyTOF analysis of immune cell (CD45+) subpopulations. Figure created with https://www.BioRender.com. (B) Multidimensional scaling (MDS) plot of the CyTOF data for the tumors in (A). MDS plot calculated based on the median (arcsinh-transformed) marker expression across all cells measured for each sample. Distances between samples in the plot approximate the change in medians. (C) Heatmap showing the median (arcsinh-transformed) marker expression across all cells measured for the 16 samples in (B). Values are scaled for better visualization. The intensity of the red color correlates with the markers’ expression. Dendrograms present clustering of samples (rows) and markers (columns) based on hierarchical clustering with Euclidean distance metric and average linkage. Row annotations on the right of the heatmap represent the samples. ad = adipocytes. (D) Boxplots of the percentage of Ly6G+ and Ly6C+ cells out of the total population of CD45+ cells, based on the CyTOF analysis of the tumors in (A) (n = 4 for each group). ad = adipocytes. (E) Median expression of PD-L1 in the tumors in (A), based on CyTOF analysis (n = 4 for each group). (F) Relative mRNA levels of the indicated genes in p53wt (n = 638) versus p53 mutated breast tumors (n = 327) in TCGA dataset (BRCA cohort). Unpaired two sample t test.
Fig. 6.
Fig. 6.
Hotspot p53 mutants display a potential gain-of-function activity in adipocyte reprogramming. (A) qRT-PCR analysis of mature adipocyte marker mRNAs in 3T3-L1 cells induced to differentiate in the presence of differentiation medium supplemented (1:1) with CM from control p53KO WEA cells and p53KO WEA cells stably expressing the mouse p53 mutants R245W, R270H, and R277K. Values were normalized to Nono mRNA and are shown relative to p53KO WEA cells. Mean + SEM from four biological repeats (one-way ANOVA and Tukey’s post hoc test). (B) qRT-PCR analysis of Il6 and Saa3 mRNA in the cells in (A). Values were normalized as in (A). Mean + SEM from four biological repeats (one-way ANOVA and Tukey’s post hoc test).

References

    1. Levine A. J., p53: 800 million years of evolution and 40 years of discovery. Nat. Rev. Cancer 20, 471–480 (2020). - PubMed
    1. Wang M., Attardi L. D., A balancing act: p53 activity from tumor suppression to pathology and therapeutic implications. Annu. Rev. Pathol. 17, 205–226 (2022). - PubMed
    1. Bargonetti J., Prives C., Gain-of-function mutant p53: History and speculation. J. Mol. Cell Biol. 11, 605–609 (2019). - PMC - PubMed
    1. Mukherjee S., et al. , Cross-talk between mutant p53 and p62/SQSTM1 augments cancer cell migration by promoting the degradation of cell adhesion proteins. Proc. Natl. Acad. Sci. U.S.A. 119, e2119644119 (2022). - PMC - PubMed
    1. Hassin O., et al. , Different hotspot p53 mutants exert distinct phenotypes and predict outcome of colorectal cancer patients. Nat. Commun. 13, 2800 (2022). - PMC - PubMed

Substances

LinkOut - more resources