. 2023 Dec 21;18(12):e0266586.
doi: 10.1371/journal.pone.0266586. eCollection 2023.

Cortical effects of wrist tendon vibration during an arm tracking task in chronic stroke survivors: An EEG study

Affiliations

Cortical effects of wrist tendon vibration during an arm tracking task in chronic stroke survivors: An EEG study

Dylan B Snyder et al. PLoS One. .

Abstract

The purpose of this study was to characterize changes in cortical activity and connectivity in stroke survivors when vibration is applied to the wrist flexor tendons during a visuomotor tracking task. Data were collected from 10 chronic stroke participants and 10 neurologically-intact controls while tracking a target through a figure-8 pattern in the horizontal plane. Electroencephalography (EEG) was used to measure cortical activity (beta band desynchronization) and connectivity (beta band task-based coherence) with movement kinematics and performance error also being recorded during the task. All participants came into our lab on two separate days and performed three blocks (16 trials each, 48 total trials) of tracking, with the middle block including vibration or sham applied at the wrist flexor tendons. The order of the sessions (Vibe vs. Sham) was counterbalanced across participants to prevent ordering effects. During the Sham session, cortical activity increased as the tracking task progressed (over blocks). This effect was reduced when vibration was applied to controls. In contrast, vibration increased cortical activity during the vibration period in participants with stroke. Cortical connectivity increased during vibration, with larger effect sizes in participants with stroke. Changes in tracking performance, standard deviation of hand speed, were observed in both control and stroke groups. Overall, EEG measures of brain activity and connectivity provided insight into effects of vibration on brain control of a visuomotor task. The increases in cortical activity and connectivity with vibration improved patterns of activity in people with stroke. These findings suggest that reactivation of normal cortical networks via tendon vibration may be useful during physical rehabilitation of stroke patients.


Conflict of interest statement

The authors have declared that no competing interests exist.

Figures
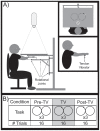
Fig 1
Fig 1. Experimental setup and protocol.
A) Illustration of the mechanical linkage and experimental setup from the side (top inset displays the scene from above, bottom inset shows the location of the tendon vibrator). The white cursor projected onto a horizontal screen was linked to hand position. Participants were required to move the cursor from the home location (light gray annulus) to the target (dark gray annulus) and track the target while it moved in a figure-8 pattern. B) Experimental protocol: a single trial consisted of 3 repetitions of the figure-8 pattern. Participants performed three blocks of 16 trials each where the middle block included tendon vibration applied to the wrist flexor tendons.
Fig 2
Fig 2. Single subject EEG data flow.
Diagram of EEG data flow for artefact removal via ICA, and the tracking period beta band ERD and tb-SCORCH analyses for a single stroke participant (S8). After preprocessing, EEG data was standardized (z-score) and temporally concatenated across block, session, participant and group. The resulting matrix was then input into an ICA which output 64 independent temporal components. ICA components containing artefacts (eye blink, EMG and movement) were removed and the remaining components were transformed back to the EEG channel space where individual data were extracted. The tracking period beta band ERD averaged across epochs was thresholded at a z-score of two and tb-SCORCH topographic maps were displayed using the corresponding Fisher z-values. The hemisphere contralateral to the tested arm (paretic) was displayed on the left.
Fig 3
Fig 3. EEG source localization of beta band ERD during the tracking period.
The hemisphere contralateral to the tested arm (paretic/non-dominant) is displayed on the left. A) Average ERD during the Pre-TV block. Z-scores averaged across participants and sessions are shown for each group. Only values above or below a z-score threshold of ±2 are displayed. Positive values indicate ERD while negative values indicate a resynchronization, relative to baseline. The dark translucent overlay denotes the deficit ROI. B) Average ERD in the deficit ROI expressed as the percent change from baseline averaged across participants (error bars denote the 95% confidence interval about the mean). C) Difference ERDs from Pre-TV (Control: C-Vibe and C-Sham, Stroke: S-Vibe and S-Sham). The percent change (%Δ) values denotes the difference between the respective block and the Pre-TV block for each session with a positive/negative %Δ indicating a larger/smaller ERD within the respective block. Only values above or below a %Δ difference of ± 9 are displayed for clarity. The dark translucent overlay denotes the deficit ROI.
Fig 4
Fig 4. Tracking period task-based coherence (tb-Coh) in the beta band during Pre-TV.
The hemisphere contralateral to the tested arm (paretic/non-dominant) is displayed on the left. The spatial variation in tb-Coh (coherence change from baseline period) averaged across participants and sessions is shown for each coherence measure. Values of tb-Coh were interpolated between electrodes. Negative values indicate a decrease in tb-Coh while positive values indicate an increase in tb-Coh relative to the baseline period. The black dot on the single electrode coherence maps indicates the location of the electrode.
Fig 5
Fig 5. Beta band tb-SCORCH during the tracking period.
The hemisphere contralateral to the tested arm (paretic/non-dominant) is displayed on the left. A) tb-SCORCH in the Pre-TV block (Control: C-Vibe and C-Sham, Stroke: S-Vibe and S-Sham). The tb-SCORCH Fisher z-values averaged across participants and sessions are shown for each group. Larger Fisher z-values indicate a stronger correlation of connectivity patterns between the group and the ground truth connectivity pattern (average of control-Vibe and control-Sham Pre-TV) during tracking. The black dot indicates the deficit electrode (C3). Values of tb-SCORCH were interpolated between electrodes B) tb-SCORCH in the deficit electrode. The bar chart shows tb-SCORCH Fisher z-values averaged across participants. Error bars denote the 95% confidence interval about the mean. C) Differences in beta band tb-SCORCH from Pre-TV for control participants. Black dots indicate the electrodes that were significantly different, using an FDR correction at α = 0.05. The Fisher z-values correspond to the differences between the respective block and the control Pre-TV block with a positive/negative Fisher z-value indicating an increase/decrease in the correlation of the connectivity maps within the respective block. Values of tb-SCORCH were interpolated between electrodes.
Fig 6
Fig 6. Stroke beta band tb-Coh in the deficit electrode (C3) during the tracking period.
The hemisphere contralateral to the tested arm (paretic/non-dominant) is displayed on the left. The tb-Coh (coherence change from baseline period) averaged across participants is shown for the deficit electrode (C3). The control reference inset shows electrode C3’s tb-Coh averaged across participants and sessions (control-Vibe and control-Sham) for the Pre-TV block. Values of tb-Coh were interpolated between electrodes for mapping. Positive/negative values indicate an increase/decrease in tb-Coh relative to the baseline period. The black dots indicate the location of the deficit electrode (C3).
Fig 7
Fig 7. Correlations of FMA with stroke ERD and tb-SCORCH from Pre-TV.
Correlations of upper extremity motor FMA scores with tracking period beta band ERD and tb-SCORCH during the Pre-TV block for stroke participants. The hemisphere contralateral to the tested arm (paretic/non-dominant) is displayed on the left. A) Correlations of vertex-wise ERD within the Pre-TV block (averaged across sessions: stroke-Vibe and stroke-Sham) with upper extremity motor FMA scores. Black and white shaded overlays indicate the deficit and functional ROIs, respectively. B) Correlations of tb-SCORCH for each electrode, within the Pre-TV block (averaged across sessions: stroke-Vibe and stroke-Sham), with upper extremity motor FMA scores. Correlation values are interpolated between electrodes for display purposes. The black and white dots indicate the deficit (C3) and functional (Cz) electrodes, respectively. C) Correlation of the ERD within the Pre-TV block for the deficit and functional ROIs with upper extremity motor FMA scores. ERD was averaged across sessions (stroke-Vibe and stroke-Sham) before correlation with the motor FMA. Control ERD during the Pre-TV block for the same ROIs was averaged across sessions (control-Vibe and control-Sham) and plotted against a perfect upper extremity motor FMA of 66. D) Correlation of stroke electrode tb-SCORCH within the Pre-TV block with upper extremity motor FMA scores. Tb-SCORCH was averaged across sessions (stroke-Vibe and stroke-Sham) before correlation with the motor FMA. Control tb-SCORCH during the Pre-TV block for the same electrodes were averaged across sessions (control-Vibe and control-Sham) and plotted against a perfect upper extremity motor FMA of 66.
Fig 8
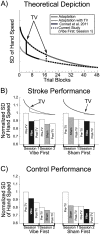
Fig 8. Tracking performance.
Tracking period SD of hand speed adaptation over time with possible step increase in adaptation due to application of tendon vibration. A) Theoretical depiction of typical tracking period SD of hand speed adaptation curve and hypothesized TV adaptation curve. When TV is applied near the beginning of the adaptation process [14] there would theoretically be a larger decrease in SD of hand speed than when TV is applied later (current study). B) Stroke SD of hand speed during tracking period. Data were averaged across the 5 stroke participants that received TV during session 1 (Vibe First) and the across the 5 stroke participants that received the sham TV during session 1 (Sham First). The curves above the bar plots display the theoretical tracking period SD of hand speed adaptation curve with the point at which TV was applied. C) Control SD of hand speed during tracking period. Data were averaged across the 5 control participants that received TV during session 1 (Vibe First) and the across the 5 control participants that received the sham TV during session 1 (Sham First). Data for B and C were normalized (for each participant) by calculating the ratio of each condition relative to session 1’s Pre-TV condition. Error bars were withheld for display purposes.

Similar articles

Cited by

References

    1. Centers for Disease Control and Prevention (CDC). Prevalence and most common causes of disability among adults—United States, 2005. MMWR Morb Mortal Wkly Rep. 2009. May 1;58(16):421–6. - PubMed
    1. Vestling M, Tufvesson B, Iwarsson S. Indicators for return to work after stroke and the importance of work for subjective well-being and life satisfaction. J Rehabil Med. 2003;35(3):127–31. doi: 10.1080/16501970310010475 - DOI - PubMed
    1. Brunnstrom S. Movement therapy in hemiplegia: a neurophysiological approach. New York: Harper & Row; 1970.
    1. Lance JW. The control of muscle tone, reflexes, and movement: Robert Wartenbeg Lecture. Neurology. 1980. Dec 1;30(12):1303–1303. doi: 10.1212/WNL.30.12.1303 - DOI - PubMed
    1. Gracies J-M. Pathophysiology of spastic paresis. II: Emergence of muscle overactivity. Muscle Nerve. 2005. May;31(5):552–71. doi: 10.1002/mus.20285 - DOI - PubMed