. 2024 Jan 2;36(1):48-61.e6.
doi: 10.1016/j.cmet.2023.11.011. Epub 2023 Dec 20.

Disrupted RNA editing in beta cells mimics early-stage type 1 diabetes

Affiliations

Disrupted RNA editing in beta cells mimics early-stage type 1 diabetes

Udi Ehud Knebel et al. Cell Metab. .

Abstract

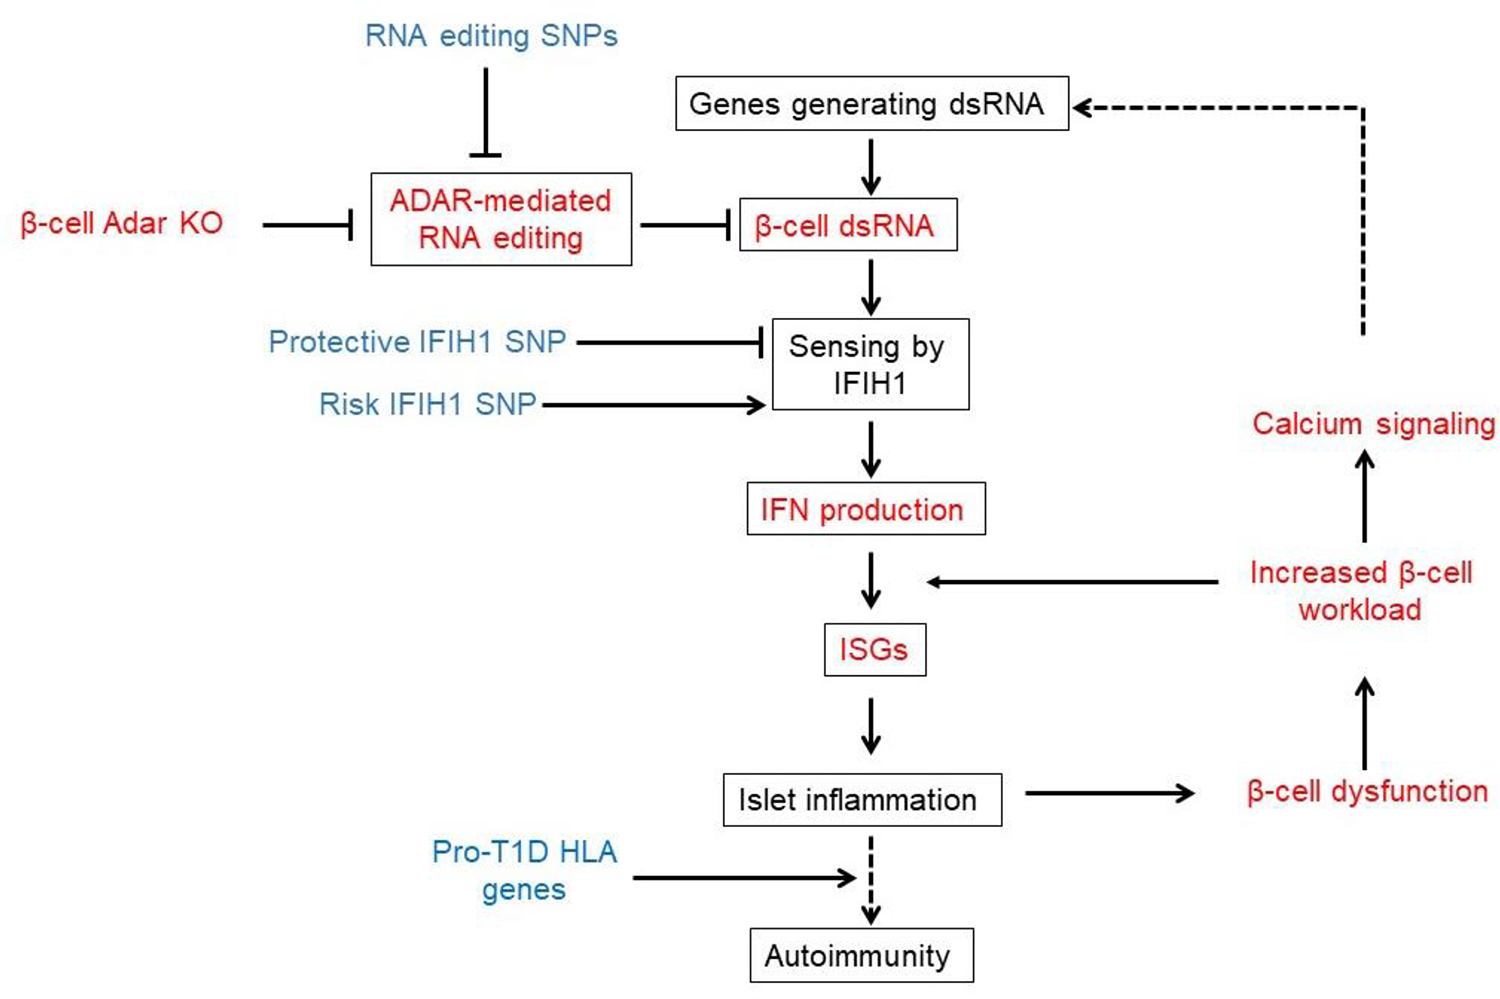
A major hypothesis for the etiology of type 1 diabetes (T1D) postulates initiation by viral infection, leading to double-stranded RNA (dsRNA)-mediated interferon response and inflammation; however, a causal virus has not been identified. Here, we use a mouse model, corroborated with human islet data, to demonstrate that endogenous dsRNA in beta cells can lead to a diabetogenic immune response, thus identifying a virus-independent mechanism for T1D initiation. We found that disruption of the RNA editing enzyme adenosine deaminases acting on RNA (ADAR) in beta cells triggers a massive interferon response, islet inflammation, and beta cell failure and destruction, with features bearing striking similarity to early-stage human T1D. Glycolysis via calcium enhances the interferon response, suggesting an actionable vicious cycle of inflammation and increased beta cell workload.

Keywords: RNA editing; beta cells; interferon response; islet inflammation; metabolic stress; type 1 diabetes.


Conflict of interest statement

Declaration of interests The authors declare no competing interests.

Figures

Figure 1:
Figure 1:. Loss of RNA editing in mouse beta cells disrupts glucose homeostasis
(A) Global A-to-I RNA editing index across short interspersed nuclear elements (SINE) in human (Alu) and mouse (B1 and B2) RNA-seq data (E-MTAB-1294, GSE76268, GSE149488, GSE54973, GSE76992, GSE86949, GSE87530) (human alpha cell datasets (n=5), human beta-cell datasets (n= 2), mouse alpha and beta-cell datasets (n=12)) demonstrates a higher A-to-I editing signal in human samples. Noise levels (non-A-to-G mismatches) are similar between human and mouse. (B) A-to-I RNA editing in inverted elements within 3’UTR is twice as high as the global editing index. Noise levels remain similar or lower than seen in the global editing index. Minimal element length was set to reflect average element length in human and mouse (200bp and 120bp, respectively). (C) Experimental approach to study the effects of Adar inactivation in mouse beta cells. (D) Reduced expression of Adar floxed exons and reduced editing at oppositely oriented B1/B2 repetitive elements in RNA from βAdarKO (n=4) versus βAdarHET (n=8) and βAdarWT (n=4) beta cells. Data are means ± SE. Student’s unpaired two-tailed t-test; *** P<0.001, **** P<0.0001 (E) Blood glucose was measured for 30 days after Tamoxifen injection in βAdarHET (n=36). and βAdarKO (n=52) mice (n=27 males, 25 females). (F) Representative micrographs of pancreatic sections from βAdarHET and diabetic βAdarKO mice 1 month after tamoxifen injection, immunostained for Insulin. Insulin and GFP positive area per pancreas were measured 1 month after tamoxifen injection in βAdarHET and diabetic βAdarKO mice (n=3 for each genotype, 5 sections per mice 150μM apart analyzed). * p<0.05 and ** p<0.005; Student’s two-tailed t-test; error bars indicate mean ± SEM (standard error of the mean). (G) Measurement of GFP/Insulin ratio reveals a higher rate of cell death among Adar mutant β-cells compared to wild-type β-cells in diabetic βAdarKO mice. GFP/Insulin ratio in islets from β−AdarHET (n=4), non-diabetic βAdarKO (n=4) and diabetic βAdarKO (n=3) mice 30–50 days after tamoxifen injection. Pancreatic sections (5 sections per mice 150mM apart) were immunostained for Insulin and GFP. The surface area staining positive for each marker was measured using Image J software.
Figure 2:
Figure 2:. Insulitis and interferon response in βAdarKO mice.
(A) Classification of islets from βAdarKO mice according to the extent of inflammatory infiltrates as assessed by immunostaining for insulin (β-cells), GFP (mutant β-cells) and CD45 (immune cells). Islets from βAdarHET, βAdarKO and βAdarKO; Ifih1−/− mice were scored 7 days (n=4, for each genotype) and 12 days after tamoxifen injection (βAdarHET (n=7), βAdarKO (n=13), βAdarKO; Ifih1−/− (n=4)). At least 100 islets from 5 different slides (80μm apart) were scored for each mouse. Each dot represents score for a single mouse. Student’s unpaired two-tailed t-test; error bars indicate mean ± SEM. ** p<0.01; **** p<0.0001. Scale bar, 20 micrometers. (B) Pancreas sections from βAdarHET (top) and βAdarKO (bottom) were stained for CD45 (pan-leukocyte marker), Iba1 (macrophages), CD3 (T cells), CD8 (T cells) and CD19 (B cells). Scale bar, 20 micrometers. (C) Correlation of impaired glucose tolerance to extent of insulitis. IP-GTT was performed on βAdarKO male mice (n=9) 9 days after Tamoxifen injection and 3 days later pancreatic islet insulitis score was determined as described in A. The values of the area under the GTT curve (IP-GTT AUC) were plotted versus insulitis score. (D) RNA-Seq heatmap representing ISG expression levels (after logarithmic transformation and row-centering) and hierarchical clustering (using Euclidean distance) in sorted β-cells from βAdarHET (HET) and βAdarKO (KO) mice (each RNA sample (n=4, for each genotype) was purified from beta cells FACS-sorted from islets that were pooled from one male and one female). Brown and green reflect low and high expression levels, respectively, as indicated in the log2-transformed scale. (E) Bubble plot based on GSEA analysis showing top upregulated MSigDB hallmark gene sets in AdarKO compared to AdarHET β-cells. The bubble color, size and transparency represent −log10 (FDR), normalized enrichment score (NES) and gene set size, respectively. (F) ISG expression in pancreatic islets was measured by qRT-PCR. Pancreatic islets were isolated from βAdarWT; Ifih1WT (n=2), βAdarKO (n=4), βAdarWT; Ifih1KO (n=2) and βAdarKO; Ifih1KO (n=2) mice, 3 days after tamoxifen injection and cultured ex-vivo for 3 days in RPMI medium before RNA extraction. (G, H) ADAR1 knockdown in human islets induces ISG expression. RNA isolated from human pseudoislets (n=11 donors) transduced with either ADAR1 shRNA or scramble shRNA pseudoislets was assessed for expression of ADAR1 (G) and interferon-stimulated genes (H) by RT-PCR, with normalization to scramble shRNA samples. * p<0.05; ** p<0.01; *** p<0.001.
Figure 3:
Figure 3:. Adar inactivation combined with islet inflammation alters beta cell expression program.
Pancreatic sections from non-diabetic βAdarKO and control βAdarHET mice, 12–14 days after Tamoxifen injection were immunostained for GFP, CD45 and beta cell markers (n>=4 mice from each genotype). (A-D) Pancreatic sections from βAdarHET (upper panel) and βAdarKO mice (mid and lower panel) were immunostained for GFP, CD45 and Insulin (A) and serial sections stained for GFP, Insulin and PC1/3 (B-D). Representative micrographs of islets demonstrate reduced insulin and PC1/3 staining in inflamed islets of βAdarKO mice (C-D, lower panels). (E, F) Pancreatic sections from βAdarHET (upper panel) and βAdarKO mice (mid and lower panel) were immunostained for GFP, CD45 and Insulin (E) and serial sections stained for GFP, proinsulin and MafA (F). Insets show dramatic reduction in MafA coinciding with reduced proinsulin levels in Adar-deficient (GFP-positive) beta cells of inflamed islets, but not in their neighboring Adar-positive GFP-negative counterparts (marked by red arrows) (F, lower panel). (G, H) Pancreatic sections from βAdarKO mice were immunostained for GFP, Insulin and CD45 (G) and serial sections were stained for GFP, proinsulin and insulin (H). Representative micrographs from non-inflamed (upper panel) and inflamed (lower panel) islets from the same section show that in inflamed islets, Adar-knockout GFP-positive beta cells (marked by green arrows) exhibit lower levels of insulin and proinsulin, while Adar-positive GFP-negative beta cells (red arrows) retain high levels of proinsulin together with reduced insulin levels. Scale bars, 20 micrometers. (I) Scheme depicting how Adar inactivation and inflammation affect beta cell marker expression.
Figure 4:
Figure 4:. Adar inactivation causes decreased expression of beta cell markers in mouse and human islets ex-vivo.
(A-B) βAdarHET and βAdarKO islets (at least 100 islets/mice from n>=5 mice) were isolated 7 days after Tamoxifen injection and cultured ex-vivo for three additional days with or without ruxolitinib (4μM), a JAK/STAT inhibitor before immunostaining for insulin, proinsulin and GFP and FACS analysis. (A) Representative FACS dot plot of GFP-positive beta cells reveals decrease in proinsulin and MafA levels in AdarKO beta cells compared to AdarHET beta cells. Ruxolitinib prevented the reduction in proinsulin and MafA levels in GFP-positive AdarKO β-cells. (B) Quantification of average MafA, proinsulin and insulin staining levels in GFP-positive beta cells from 5–6 independent experiments shows significant reduction in MafA and proinsulin levels but not in insulin levels in AdarKO compared to AdarHET β-cells and in untreated versus ruxolitinib treated AdarKO GFP-positive beta cells. *p<0.05, ***p<0.001, ****p<0.0001, ns: non-significant; Student’s two-tailed t-test; error bars indicate mean ± SEM. (C) Expression of islet cell-enriched transcription factors is reduced in ADAR1 knock down human islets (n=11 donors). * p<0.05, *** p<0.01. (D) Insulin secretion and insulin content in islets isolated from βAdarHET and βAdarKO mice (n=4 each) seven days after tamoxifen injection. The islets were cultured in RPMI for 24h prior to stimulation with 2.8mM or 16.7mM glucose. (E) Insulin secretion (static culture for 30 minutes at 1.7 mm and 16.7 mm glucose) and insulin content were assessed in human pseudoislets transduced with. Scrambled shRNA or ADAR1 shRNA. * p<0.05, ** p<0.01.
Figure 5:
Figure 5:. Glucose metabolism and calcium influx enhance the interferon response in islets from βAdarKO mice.
(A) Graphical model depicting glucose metabolism and glucose-induced pathways to insulin secretion. Pharmacological interventions that modulate insulin secretion (marked in red) were tested to delineate necessary pathways for glucose-induced ISG expression in βAdarKO islets. (B-D) Islets from βAdarKO mice were isolated 3 days after tamoxifen injection and cultured for three additional days in RPMI medium supplemented with 5mM or 11mM glucose and pharmacological modulators of insulin secretion, as indicated: 10uM GKA (glucokinase activator), 4μM ruxolitinib (B), 325uM diazoxide (C), and 10uM nifedipine (D). Each dot represents RNA expression levels from 30 islets isolated from βAdarKO mice (n>=3). ISG mRNA expression was assayed by RT-qPCR and normalized to Actb gene expression. (E) Glucose activates transcription of type I IFN genes in islets from βAdarKO mice. Islets from βAdarKO mice were isolated 3 days after tamoxifen injection and cultured for three days in RPMI medium supplemented with 5mM or 11mM glucose. Each dot represents RNA expression levels from 30 islets isolated from βAdarKO mice (n=6). Expression of Ifna4 and Ifnb1 genes was assessed by RT-ddPCR (Droplet Digital PCR). *p<0.05; Student’s paired t-test; error bars indicate mean ± SEM. (F) Glucose modulates the interferon response in wild-type islets. Islets from βAdarWT mice were cultured for three days in 5mM or 11mM glucose and treated for 24 hours with 800u/ml IFNα with or without 4μM ruxolitinib. Each dot represents RNA expression levels from 30 islets isolated from βAdarKO mice (n>=5). ISG expression was assayed by RT-qPCR and normalized to Actb expression. n>=6. (G) Glucose metabolism modulates the interferon response in wild-type islets. Dissociated islets from wild-type mice were cultured in RPMI supplemented with 5mM glucose or 5mM glucose together with 10μM GKA. 48h later, islets were treated for 24h with 800u/ml IFNα Each dot represents RNA expression levels from 30 islets isolated from βAdarKO mice (n=4). ISG expression was assessed by RT-qPCR and normalized to Actb expression. *p<0.05, **p<0.01, ***p<0.001; Student’s unpaired two-tailed t-test; error bars indicate mean ± SEM.
Figure 6:
Figure 6:. Schematic model for the involvement of defective RNA editing in the pathogenesis of T1D.
This model is supported by our results (in red) and published human genetic evidence (in blue). Dashed lines represent possible but as yet unproven links.

References

    1. Eisenberg E, and Levanon EY (2018). A-to-I RNA editing - immune protector and transcriptome diversifier. Nat. Rev. Genet. 19, 473–490. 10.1038/s41576-018-0006-1. - DOI - PubMed
    1. Ahmad S, Mu X, Yang F, Greenwald E, Park JW, Jacob E, Zhang C-Z, and Hur S (2018). Breaching Self-Tolerance to Alu Duplex RNA Underlies MDA5-Mediated Inflammation. Cell 172, 797–810.e13. 10.1016/j.cell.2017.12.016. - DOI - PMC - PubMed
    1. Rice GI, Kasher PR, Forte GMA, Mannion NM, Greenwood SM, Szynkiewicz M, Dickerson JE, Bhaskar SS, Zampini M, Briggs TA, et al. (2012). Mutations in ADAR1 cause Aicardi-Goutières syndrome associated with a type I interferon signature. Nat. Genet. 44, 1243–1248. 10.1038/ng.2414. - DOI - PMC - PubMed
    1. Liddicoat BJ, Piskol R, Chalk AM, Ramaswami G, Higuchi M, Hartner JC, Li JB, Seeburg PH, and Walkley CR (2015). RNA editing by ADAR1 prevents MDA5 sensing of endogenous dsRNA as nonself. Science 349, 1115–1120. 10.1126/science.aac7049. - DOI - PMC - PubMed
    1. Liu H, Golji J, Brodeur LK, Chung FS, Chen JT, deBeaumont RS, Bullock CP, Jones MD, Kerr G, Li L, et al. (2019). Tumor-derived IFN triggers chronic pathway agonism and sensitivity to ADAR loss. Nat. Med. 25, 95–102. 10.1038/s41591-018-0302-5. - DOI - PubMed

Publication types