. 2024 Apr 4;147(4):1553-1570.
doi: 10.1093/brain/awad405.

A novel SMARCC1 BAFopathy implicates neural progenitor epigenetic dysregulation in human hydrocephalus

Affiliations

A novel SMARCC1 BAFopathy implicates neural progenitor epigenetic dysregulation in human hydrocephalus

Amrita K Singh et al. Brain. .

Abstract

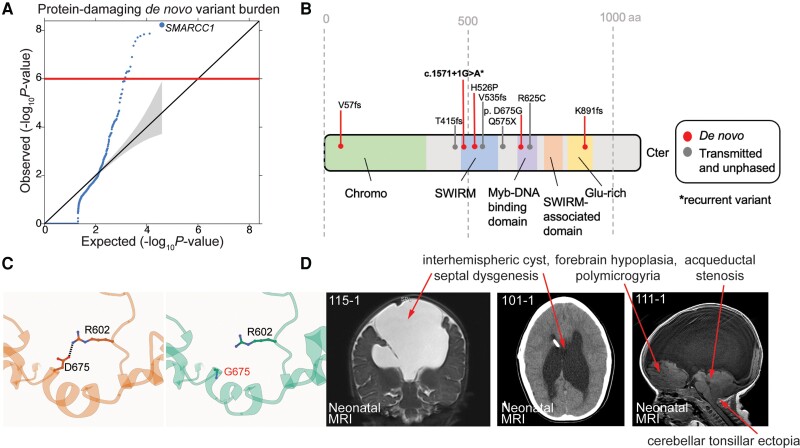
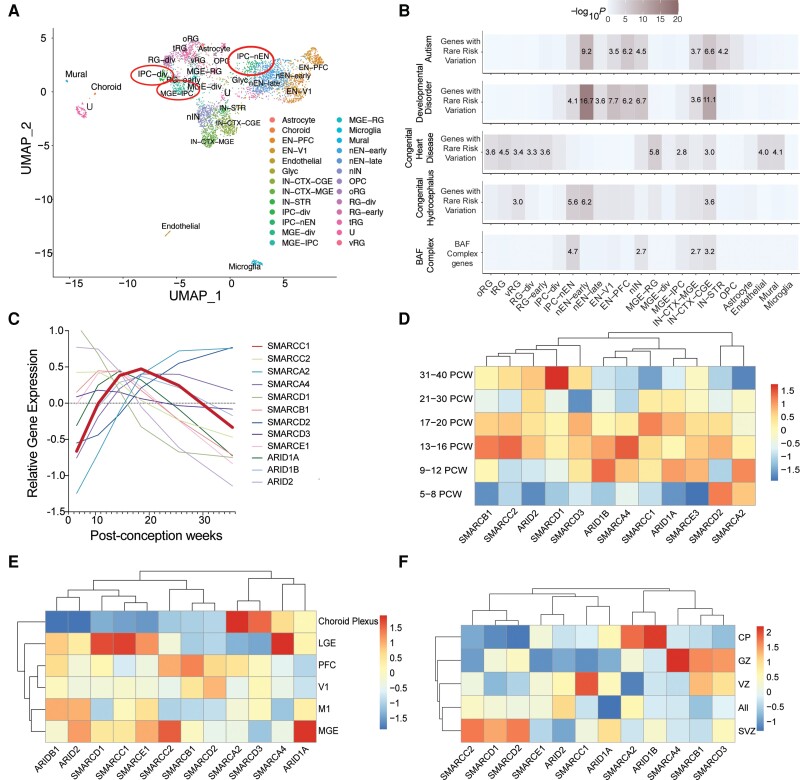
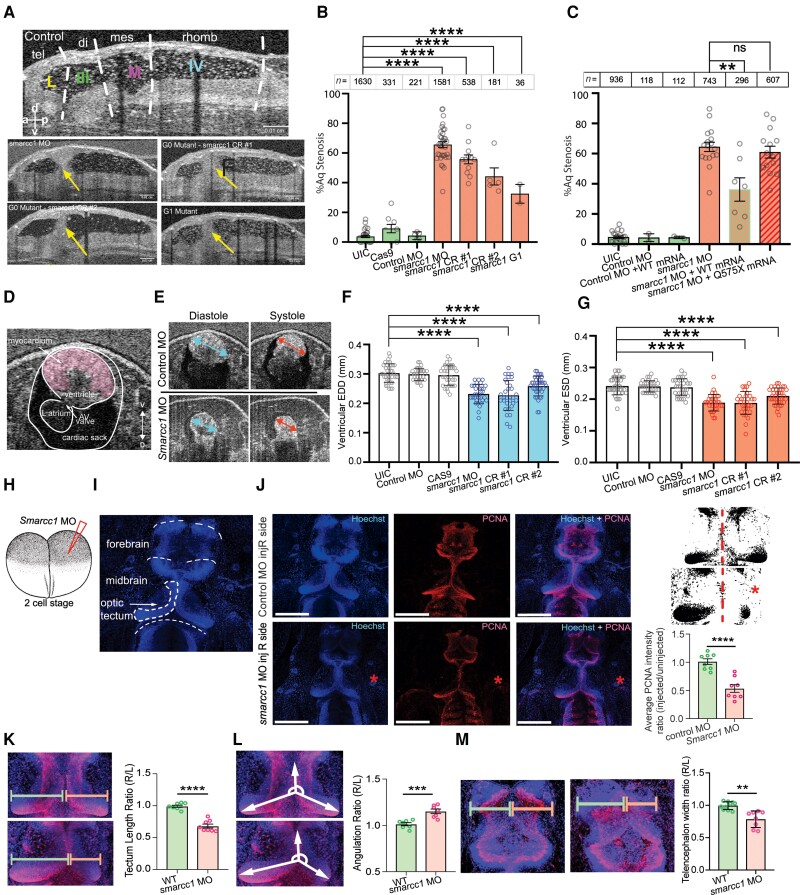
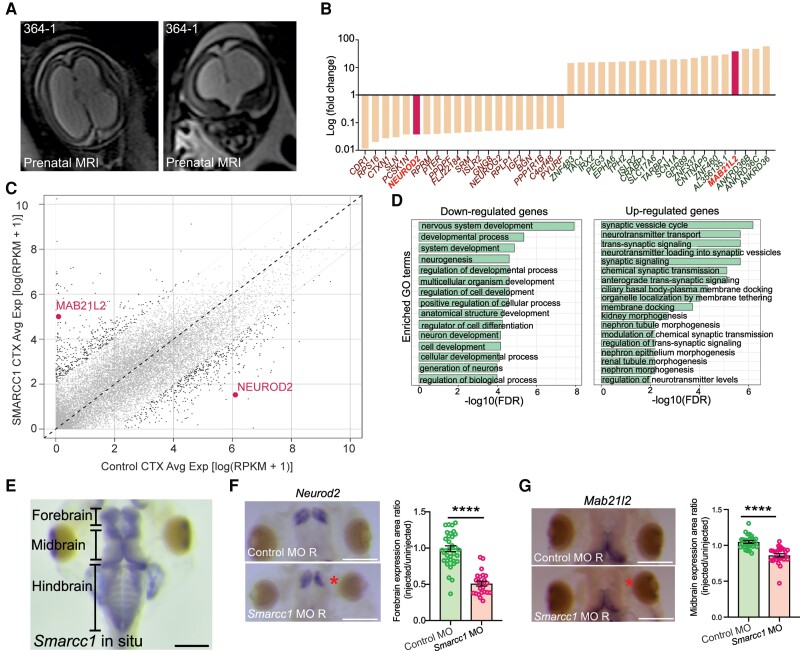
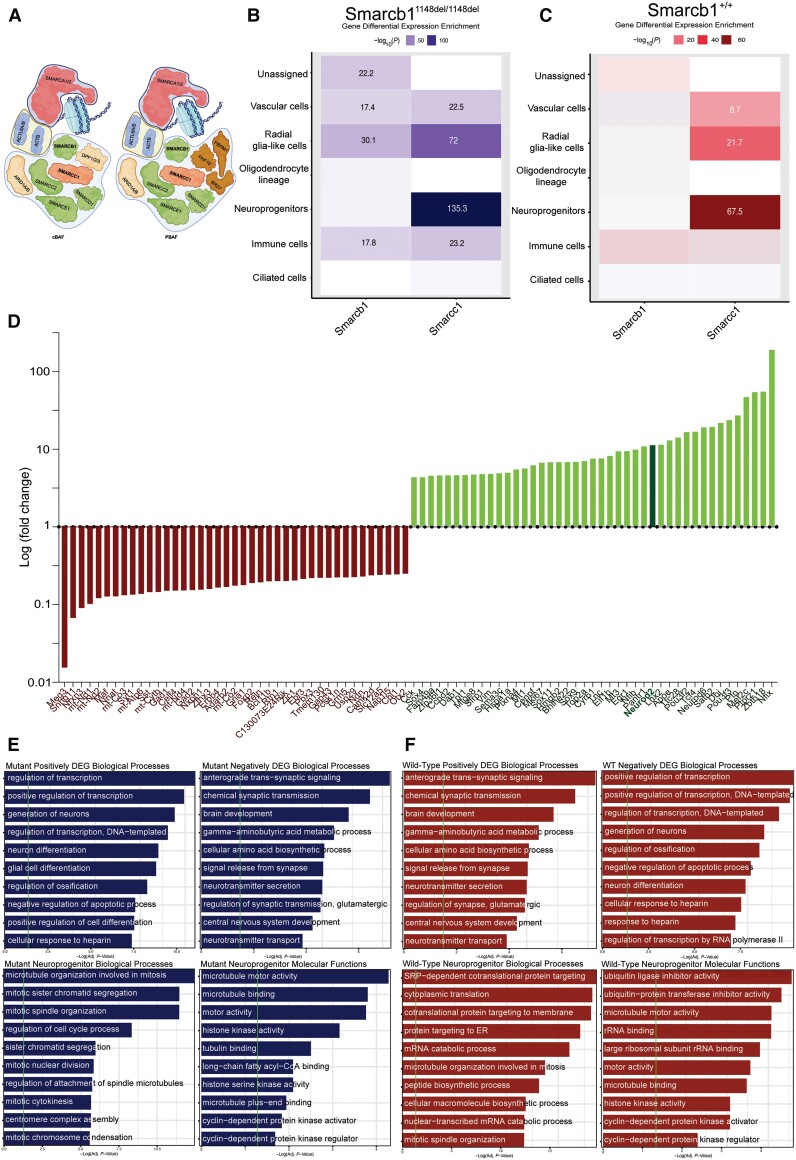
Hydrocephalus, characterized by cerebral ventriculomegaly, is the most common disorder requiring brain surgery in children. Recent studies have implicated SMARCC1, a component of the BRG1-associated factor (BAF) chromatin remodelling complex, as a candidate congenital hydrocephalus gene. However, SMARCC1 variants have not been systematically examined in a large patient cohort or conclusively linked with a human syndrome. Moreover, congenital hydrocephalus-associated SMARCC1 variants have not been functionally validated or mechanistically studied in vivo. Here, we aimed to assess the prevalence of SMARCC1 variants in an expanded patient cohort, describe associated clinical and radiographic phenotypes, and assess the impact of Smarcc1 depletion in a novel Xenopus tropicalis model of congenital hydrocephalus. To do this, we performed a genetic association study using whole-exome sequencing from a cohort consisting of 2697 total ventriculomegalic trios, including patients with neurosurgically-treated congenital hydrocephalus, that total 8091 exomes collected over 7 years (2016-23). A comparison control cohort consisted of 1798 exomes from unaffected siblings of patients with autism spectrum disorder and their unaffected parents were sourced from the Simons Simplex Collection. Enrichment and impact on protein structure were assessed in identified variants. Effects on the human fetal brain transcriptome were examined with RNA-sequencing and Smarcc1 knockdowns were generated in Xenopus and studied using optical coherence tomography imaging, in situ hybridization and immunofluorescence. SMARCC1 surpassed genome-wide significance thresholds, yielding six rare, protein-altering de novo variants localized to highly conserved residues in key functional domains. Patients exhibited hydrocephalus with aqueductal stenosis; corpus callosum abnormalities, developmental delay, and cardiac defects were also common. Xenopus knockdowns recapitulated both aqueductal stenosis and cardiac defects and were rescued by wild-type but not patient-specific variant SMARCC1. Hydrocephalic SMARCC1-variant human fetal brain and Smarcc1-variant Xenopus brain exhibited a similarly altered expression of key genes linked to midgestational neurogenesis, including the transcription factors NEUROD2 and MAB21L2. These results suggest de novo variants in SMARCC1 cause a novel human BAFopathy we term 'SMARCC1-associated developmental dysgenesis syndrome', characterized by variable presence of cerebral ventriculomegaly, aqueductal stenosis, developmental delay and a variety of structural brain or cardiac defects. These data underscore the importance of SMARCC1 and the BAF chromatin remodelling complex for human brain morphogenesis and provide evidence for a 'neural stem cell' paradigm of congenital hydrocephalus pathogenesis. These results highlight utility of trio-based whole-exome sequencing for identifying pathogenic variants in sporadic congenital structural brain disorders and suggest whole-exome sequencing may be a valuable adjunct in clinical management of congenital hydrocephalus patients.

Keywords: chromatin; congenital; genetics; genomics; neurodevelopment; neurosurgery.


Conflict of interest statement

S.M. and P.K. are employees of GeneDx. All other co-authors have no conflicts of interest to disclose.

Figures

Figure 1
Figure 1
SMARCC1 mutations are associated with congenital hydrocephalus and cause a novel human BAFopathy featuring cerebral ventriculomegaly. (A) Quantile–quantile (Q-Q) plot of observed versus expected P-values for de novo variants (DNVs) in each gene in 2697 trio cases. P-values were calculated using a one-sided Poisson test (refer to the ‘Materials and methods’ section). For protein-damaging de novo SMARCC1 variants [loss-of-function (LoF), MetaSVM = D and/or MPC > 2], P = 5.83 × 10⁻⁹. (B) Schematic diagram showing variant locations in SMARCC1 protein domains. Identified DNVs, transmitted and unknown inheritance variants, are indicated with markers. *Recurrent variant. (C) The p.Asp675Gly variant was predicted to be detrimental to SMARCC1 structure and function by alpha-fold biophysical modelling. Structural protein modelling predicts that p.Asp675Gly alters a conserved residue in the Myb domain resulting in loss of an ion pair interaction with p.Arg602, with a predicted ΔG of 0.73 kcal/mol. (D) Brain MRIs of congenital hydrocephalus patients with SMARCC1 variants demonstrate consistent structural abnormalities. Prenatal imaging is shown for Patients 115-1 (contrast MRI), 101-1 and 111-1. Red asterisks denote ventricular catheter of a ventriculo-peritoneal shunt used to treat obstructive hydrocephalus.
Figure 2
Figure 2
SMARCC1 is expressed in intermediate progenitors of the cortical lamina during human brain development. (A) Analysed transcriptomic dataset showing uniform manifold approximation and projection (UMAP) clustering of developmental human brain cells, coloured by cell type. EN-PFC = early and late born excitatory neuron prefrontal cortex; EN-V1 = early and late born excitatory neuron V1; IN-CTX-CGE = caudal ganglionic eminence (CGE)/lateral ganglionic eminence (LGE)-derived inhibitory neurons; IN-CTX-MGE = medial ganglionic eminence (MGE)-derived cortex inhibitory neuron; IN-STR = striatal neurons; IPC-div = dividing intermediate progenitor cells radial glia (RG)-like; IPC-nEN = intermediate progenitor cells excitatory neuron (EN)-like; MGE-div = dividing MGE progenitors; MGE-IPC = MGE progenitors; MGE-RG = MGE radial glia; Mural = mural/pericyte; Nen-early = newborn excitatory neuron-early born; nEN-late = newborn excitatory neuron-late born; nIN = MGE newborn neurons; OPC = oligodendrocyte progenitor cell; oRG = outer radial glia; RG-div = dividing radial glia; RG-early = earlyvRG; tRG = truncated radial glia; U = unknown; vRG = ventricular radial glia. Expression in neural progenitors is featured in red circles. (B) Analysed transcriptomic dataset showing enrichment analysis across cell type markers of the developmental human brain for genes with rare risk variation in autism, developmental disorders, congenital heart disease and congenital hydrocephalus compared to BAF complex genes. Tiles labelled with −log10(P-value) and an asterisk represent significant enrichment at the Bonferroni multiple-testing cut-off (α = 0.05/23 = 2.17 × 10⁻³). (C) Temporal gene expression profiles for SMARCC1 and other BAF complex genes between post-conception weeks (PCW) 5–36. (D) Analysed transcriptomic dataset showing heat map of gene expression levels for SMARCC1 and other BAF complex genes across different developmental time points. Vertical axis shows time points in post-conception weeks. (E) Analysed transcriptomic dataset showing heat map of gene expression levels for SMARCC1 and other BAF complex genes across different brain regions. V1 = primary visual cortex; M1 = primary motor cortex. (F) Analysed transcriptomic dataset showing heat map of gene expression levels for SMARCC1 and other BAF complex genes across cortical lamina, PCW 5–40. CP = cortical plate; GZ = germinal zone; VZ = ventricular zone; SVZ = subventricular zone.
Figure 3
Figure 3
SMARCC1 mutation causes hydrocephalus by disrupting midbrain architecture in Xenopus tropicalis. (A) Mid-sagittal view of the Xenopus ventricular system. Dotted white lines indicate boundaries between labelled regions: tel = telencephalon; di = diencephalon; mes = mesencephalon; rhomb = rhombencephalon; L = lateral ventricle; III = third ventricle; M = midbrain ventricle; IV = fourth ventricle. Representative mid-sagittal views for experimental conditions (G0 variant from morpholino oligo, G0 variant from CRISPR #1, G0 variant from CRISPR #2, and G1 variant progeny from Smarcc1 MO animals) are shown with aqueductal occlusion marked by arrows. (B) Quantification of per cent aqueductal stenosis in uninjected controls (UIC); Cas9 control and control MO, as well as in the experimental conditions Smarcc1 MO, Smarcc1 CRISPR #1, Smarcc1 CRISPR #2 and Smarcc1 G1 variant. Data are shown as mean ± standard error of the mean (SEM). Open circles indicate the number of experiments, with animal counts indicated above each column. Significance was calculated by one-way ANOVA; ****P ≤ 0.0001. (C) Quantification of rescue of aqueductal stenosis phenotype with Smarcc1 MO + WT mRNA (P = 0.0024) with recapitulation of phenotype by pathogenic mRNA from p.Q575* variant (P = 0.4888). Data are shown as mean ± SEM. Open circles indicate number of experiments, with animal counts indicated above each column. Significance was calculated by Mann-Whitney test. (D) Representative X. tropicalis cardiac OCT image on ventral-dorsal axis, the ventral three chamber view (VTCV). Labelled structures are myocardium, ventricle, left atrium, AV valve and cardiac sack. (E) Representative cardiac measurements by OCT shown for UIC and smarcc1 MO. EDD = end diastolic diameter; ESD = end systolic diameter. (F) Quantification of EDD in UIC, Cas9 control and control MO, as well as experimental conditions smarcc1 MO, smarcc1 CRISPR #1 and smarcc1 CRISPR #2. Data are shown as mean ± SEM. Significance was calculated by one-way ANOVA using GraphPad Prism. ****P ≤ 0.0001. (G) Quantification of ESD in UIC, Cas9 control and control MO, as well as experimental conditions smarcc1 MO, smarcc1 CRISPR #1 and smarcc1 CRISPR #2. Data are shown as mean ± SEM. Significance was calculated by one-way ANOVA using GraphPad Prism. ****P ≤ 0.0001. (H) Schematic of two-cell injection protocol in X. tropicalis. (I) Labelled representative fluorescence microscopy of wild-type (WT) stage 46 X. tropicalis stained with Hoechst. Olfactory bulb, forebrain, midbrain, optic tectum and cerebellum are indicated. (J) Representative immunofluorescence images of right side-injected control MO and right side-injected Smarcc1 MO stage 46 X. tropicalis for PCNA (red) and merged images (with Hoechst, blue). Scale bar = 500 um. Schematic and chart for quantification of average PCNA intensity ratio for control and smarcc1 MO injected on the right side with left side uninjected, P ≤ 0.0001 with unpaired t-test. Data are shown as mean ± SEM. (K) Schematic and chart for quantification of optic tectum length ratio for wild-type control and Smarcc1 MO injected on the right side with left side uninjected, P ≤ 0.0001 with unpaired t-test. Data are shown as mean ± SEM. (L) Schematic and chart for quantification of optic tectum angulation ratio for wild-type control and Smarcc1 MO injected on the right side with left side uninjected, P = 0.0008 with unpaired t-test. Data are shown as mean ± SEM. (M) Schematic and chart for quantification of telencephalon width ratio for wild-type control and Smarcc1 MO injected on the right side with left side uninjected, P = 0.0019 with unpaired t-test. Data are shown as mean ± SEM. ns = not significant; OCT = optical coherence tomography.
Figure 4
Figure 4
SMARCC1 mutation dysregulates transcription factors involved in intermediate progenitor biology in human and Xenopus tropicalis. (A) Prenatal ultrasound imaging for Patient CHYD364-1 demonstrates severe cerebral ventriculomegaly and aqueductal stenosis. (B) Median fold-change of top 20 differentially expressed genes. NEUROD2 and MAB21L2 are highlighted. (C) Dot plot showing differentially expressed genes between SMARCC1 variant and control CTX samples. Each dot represents a gene. The x- and y-axes represent average gene expression in control and variant samples, respectively. Genes with a fold change >5 between samples are in black; others are in grey. MAB21L2 and NEUROD2 are highlighted with text. (D) Gene ontology (GO) analysis of congenital hydrocephalus risk genes, including ranked and selected terms. Significance was calculated by two-sided Fisher’s exact test. Scale bar = 500 μm. (E) Representative photomicrograph of DNA in situ hybridization showing Smarcc1 expression in wild-type stage 46 of X. tropicalis. The forebrain, midbrain and hindbrain are indicated. Scale bar = 500 μm. (F) Representative photomicrographs of DNA in situ hybridization showing Neurod2 expression in stage 46 X. tropicalis, control and Smarcc1 MO-injected on the right side, with left side uninjected. Quantification of forebrain expression area is shown, P ≤ 0.0001 with unpaired t-test. Data are shown as means ± SEM. Scale bar = 500 μm. (G) Representative photomicrographs of DNA in situ hybridization showing Mab21l2 expression and quantification as in F. Scale bar = 500 μm.
Figure 5
Figure 5
Altered Smarcc1 expression in NPCs and disrupted neurogenesis in Smarcb1-mutant hydrocephalic mice. (A) Schematic of the human SWItch/Sucrose Non-Fermentable (SWI/SNF complex), highlighting SMARCC1 and SMARCB1, core subunits of the complex. (B) Differential expression of Smarcc1 and Smarcb1 by cell type in Smarcb1-mutant mice. Significant values are labelled numerically. (C) Representation of positively and negatively differentially expressed genes (DEGs) by log(fold-change) in hydrocephalic Smarcb1-mutant mice relative to wild-type. Neurod2 is highlighted. (D) Smarcb1-mutant positively and negatively DEGs gene ontology (GO) biological processes. Vertical green line indicates statistical significance corrected by the Benjamini-Hochberg method. (E) Smarcb1-mutant NPC-type marker GO biological processes and molecular functions. Vertical green line indicates statistical significance corrected by the Benjamini-Hochberg method. NPC = neural progenitor cell.

Update of

References

    1. Masliah-Planchon J, Bieche I, Guinebretiere JM, Bourdeaut F, Delattre O. SWI/SNF chromatin remodeling and human malignancies. Annu Rev Pathol. 2015;10:145–171. - PubMed
    1. Clapier CR, Cairns BR. The biology of chromatin remodeling complexes. Annu Rev Biochem. 2009;78:273–304. - PubMed
    1. Clapier CR, Iwasa J, Cairns BR, Peterson CL. Mechanisms of action and regulation of ATP-dependent chromatin-remodelling complexes. Nat Rev Mol Cell Biol. 2017;18:407–422. - PMC - PubMed
    1. Wang W, Xue Y, Zhou S, Kuo A, Cairns BR, Crabtree GR. Diversity and specialization of mammalian SWI/SNF complexes. Genes Dev. 1996;10:2117–2130. - PubMed
    1. Alfert A, Moreno N, Kerl K. The BAF complex in development and disease. Epigenetics Chromatin. 2019;12:19. - PMC - PubMed

Publication types

MeSH terms

Substances

Supplementary concepts