

Diffusion MRI tracks cortical microstructural changes during the early stages of Alzheimer's disease
- PMID: 38128551
- PMCID: PMC10907088
- DOI: 10.1093/brain/awad428
Diffusion MRI tracks cortical microstructural changes during the early stages of Alzheimer's disease
Abstract
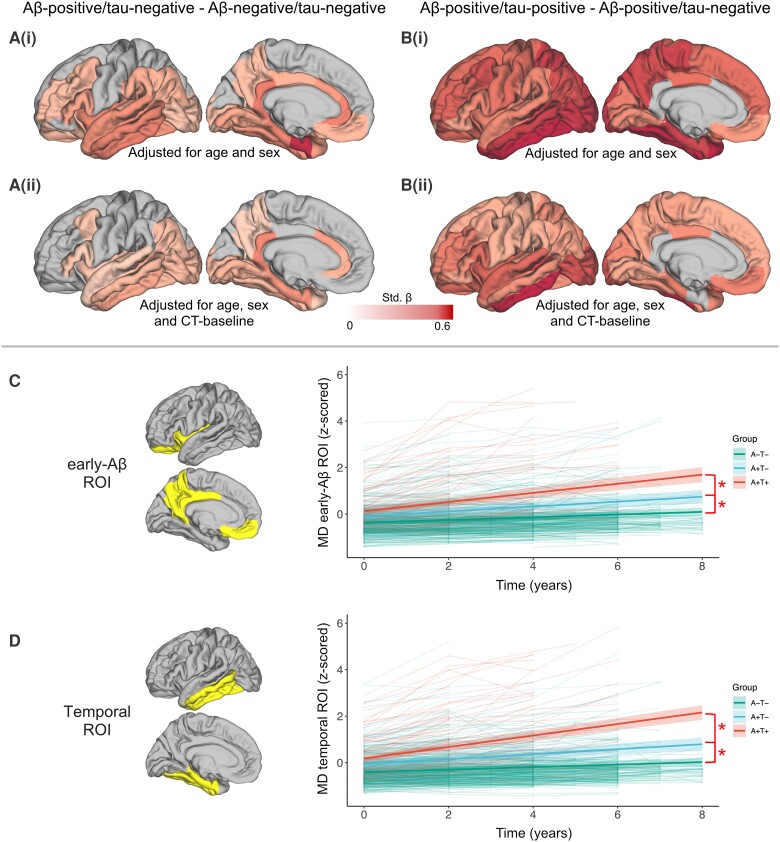
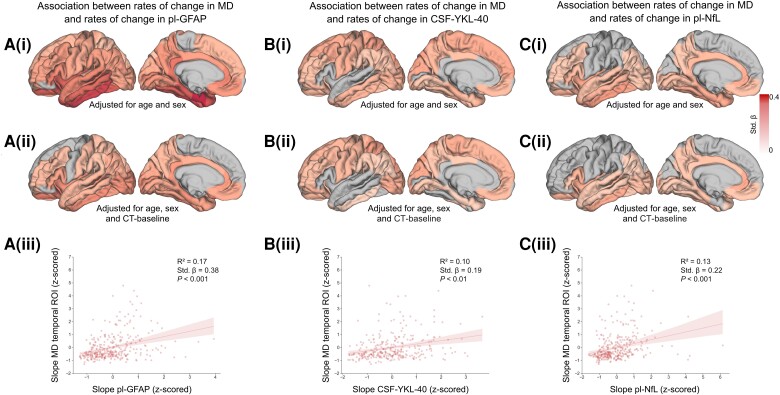
There is increased interest in developing markers reflecting microstructural changes that could serve as outcome measures in clinical trials. This is especially important after unexpected results in trials evaluating disease-modifying therapies targeting amyloid-β (Aβ), where morphological metrics from MRI showed increased volume loss despite promising clinical treatment effects. In this study, changes over time in cortical mean diffusivity, derived using diffusion tensor imaging, were investigated in a large cohort (n = 424) of non-demented participants from the Swedish BioFINDER study. Participants were stratified following the Aβ/tau (AT) framework. The results revealed a widespread increase in mean diffusivity over time, including both temporal and parietal cortical regions, in Aβ-positive but still tau-negative individuals. These increases were steeper in Aβ-positive and tau-positive individuals and robust to the inclusion of cortical thickness in the model. A steeper increase in mean diffusivity was also associated with both changes over time in fluid markers reflecting astrocytic activity (i.e. plasma level of glial fibrillary acidic protein and CSF levels of YKL-40) and worsening of cognitive performance (all P < 0.01). By tracking cortical microstructural changes over time and possibly reflecting variations related to the astrocytic response, cortical mean diffusivity emerges as a promising marker for tracking treatments-induced microstructural changes in clinical trials.
Keywords: Alzheimer’s disease; amyloid-β; astrocytes; clinical trials; cortical mean diffusivity.
© The Author(s) 2023. Published by Oxford University Press on behalf of the Guarantors of Brain.
Conflict of interest statement
O.H. has acquired research support (for the institution) from ADx, AVID Radiopharmaceuticals, Biogen, Eli Lilly, Eisai, Fujirebio, GE Healthcare, Pfizer and Roche. In the past 2 years, he has received consultancy/speaker fees from AC Immune, Amylyx, Alzpath, BioArctic, Biogen, Cerveau, Eisai, Eli Lilly, Fujirebio, Genentech, Merck, Novartis, Novo Nordisk, Roche, Sanofi and Siemens.
Figures
Comment in
-
Cortical microstructural imaging from diffusion MRI: towards sensitive biomarkers for clinical trials.Brain. 2024 Mar 1;147(3):746-748. doi: 10.1093/brain/awae054. Brain. 2024. PMID: 38408356 No abstract available.
Similar articles
-
Measures of cortical microstructure are linked to amyloid pathology in Alzheimer's disease.Brain. 2023 Apr 19;146(4):1602-1614. doi: 10.1093/brain/awac343. Brain. 2023. PMID: 36130332 Free PMC article.
-
In Vivo Detection of Changes Related to Cortical Columnar Organization and Neuroinflammation Across the AD Continuum.J Prev Alzheimers Dis. 2022;9(4):769-779. doi: 10.14283/jpad.2022.59. J Prev Alzheimers Dis. 2022. PMID: 36281682
-
Associations between white matter microstructure and amyloid burden in preclinical Alzheimer's disease: A multimodal imaging investigation.Neuroimage Clin. 2014 Feb 19;4:604-14. doi: 10.1016/j.nicl.2014.02.001. eCollection 2014. Neuroimage Clin. 2014. PMID: 24936411 Free PMC article.
-
Core candidate neurochemical and imaging biomarkers of Alzheimer's disease.Alzheimers Dement. 2008 Jan;4(1):38-48. doi: 10.1016/j.jalz.2007.08.006. Epub 2007 Dec 21. Alzheimers Dement. 2008. PMID: 18631949 Review.
-
Intracortical surface-based MR diffusivity to investigate neurologic and psychiatric disorders: a review.J Neuroimaging. 2022 Jan;32(1):28-35. doi: 10.1111/jon.12930. Epub 2021 Sep 10. J Neuroimaging. 2022. PMID: 34506674 Review.
Cited by
-
Comprehensive Analysis of the 5xFAD Mouse Model of Alzheimer's Disease Using dMRI, Immunohistochemistry, and Neuronal and Glial Functional Metabolic Mapping.Biomolecules. 2024 Oct 13;14(10):1294. doi: 10.3390/biom14101294. Biomolecules. 2024. PMID: 39456227 Free PMC article.
-
Advanced brain aging, selective vulnerability in gray matter, and cognition in Parkinson's disease.J Gerontol A Biol Sci Med Sci. 2025 Aug 23;80(9):glaf124. doi: 10.1093/gerona/glaf124. J Gerontol A Biol Sci Med Sci. 2025. PMID: 40493890 Free PMC article.
-
Subjective memory concern, negative affect, and cortical microstructural integrity in community-dwelling middle-aged men.Geroscience. 2025 Jul 8. doi: 10.1007/s11357-025-01778-4. Online ahead of print. Geroscience. 2025. PMID: 40627124
-
Microstructural associations between locus coeruleus, cortical, and subcortical regions are modulated by astrocyte reactivity: a 7T MRI adult lifespan study.Cereb Cortex. 2024 Jun 4;34(6):bhae261. doi: 10.1093/cercor/bhae261. Cereb Cortex. 2024. PMID: 38904081 Free PMC article.
-
Macro and micro structural preservation of grey matter integrity after 24 weeks of rTMS in Alzheimer's disease patients: a pilot study.Alzheimers Res Ther. 2024 Jul 5;16(1):152. doi: 10.1186/s13195-024-01501-z. Alzheimers Res Ther. 2024. PMID: 38970141 Free PMC article. Clinical Trial.
References
Publication types
MeSH terms
Substances
Grants and funding
LinkOut - more resources
Full Text Sources
Medical
