. 2023 Dec 21;7(3):e202302338.
doi: 10.26508/lsa.202302338. Print 2024 Mar.

Loss-of-function cancer-linked mutations in the EIF4G2 non-canonical translation initiation factor

Affiliations

Loss-of-function cancer-linked mutations in the EIF4G2 non-canonical translation initiation factor

Sara Meril et al. Life Sci Alliance. .

Abstract

Tumor cells often exploit the protein translation machinery, resulting in enhanced protein expression essential for tumor growth. Since canonical translation initiation is often suppressed because of cell stress in the tumor microenvironment, non-canonical translation initiation mechanisms become particularly important for shaping the tumor proteome. EIF4G2 is a non-canonical translation initiation factor that mediates internal ribosome entry site (IRES)- and uORF-dependent initiation mechanisms, which can be used to modulate protein expression in cancer. Here, we explored the contribution of EIF4G2 to cancer by screening the COSMIC database for EIF4G2 somatic mutations in cancer patients. Functional examination of missense mutations revealed deleterious effects on EIF4G2 protein-protein interactions and, importantly, on its ability to mediate non-canonical translation initiation. Specifically, one mutation, R178Q, led to reductions in protein expression and near-complete loss of function. Two other mutations within the MIF4G domain specifically affected EIF4G2's ability to mediate IRES-dependent translation initiation but not that of target mRNAs with uORFs. These results shed light on both the structure-function of EIF4G2 and its potential tumor suppressor effects.


Conflict of interest statement

The authors declare that they have no conflict of interest.

Figures

Figure S1.
Figure S1.. Analysis of the EIF4G2 mRNA expression in tumor samples (related to Fig 1).
(A) EIF4G2 log2 fold change of normalized read count from healthy and primary tumor samples, as sequenced in 24 cancer histology subtypes. Data were collected from the UCSC Xena Functional Genomic Explorer. Significance was assessed using a two-tailed t test (*P < 0.05; **P < 0.01; and ***P < 0.001). (B) Table listing all the histology subtype names presented in (A).
Figure 1.
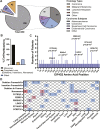
Figure 1.. Distribution of mutations in the EIF4G2 gene in cancer patients.
(A) Pie chart representing the distribution of 369 patient samples with EIF4G2 mutations according to the tumor histology type (left). Pie-of-pie chart representing the tumor histology subtype of the 290 carcinoma patients with EIF4G2 mutations (right). (B) Bar graph showing the mutation classification in 248 EIF4G2 coding mutations. (C) Distribution and occurrence of 191 verified somatic missense mutations in the EIF4G2 coding region, from 248 independent tumor samples, as identified in the COSMIC database. Positions with significant mutation occurrences are labeled with the amino acid substitution and P-value, calculated for windows of 1, 3, 9, 15, 30, and 60 bases, with steps of 1 (for windows of one base) or 3. The most significant P-values are shown, found with the one base window. (D) Number of patients with each deleterious or significant missense mutation, distributed according to the histology subtype.
Figure 2.
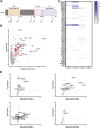
Figure 2.. MIF4G point mutations reduce EIF4G2 protein–protein interactions.
(A) Schematic representation of the EIF4G2 protein. The domains with a known crystal structure are designated by amino acid position and labeled in red. Proteins shown to interact with these regions are indicated in black. The approximate locations of the significant mutations are represented by arrows in the relevant domains. Scheme was created with BioRender.com. (B) Volcano plot of the fold ratio of the abundance of the detected proteins in WT EIF4G2 versus control IP samples, versus their significance expressed as −log10 P-value. Proteins with significantly increased abundance, that is, EIF4G2 interactors, are indicated in red. (C) Comparison of the binding abilities of EIF4G2 mutants with the 60 identified EIF4G2 interacting proteins. A heat map shows the fold ratio of the abundance of specific interacting proteins in the IP of the mutants compared with the WT EIF4G2 IP. The interactors presented are the ones identified as EIF4G2 interacting proteins (P < 0.05, fold change >1.5 of WT/control) regardless of their significance in the WT versus mutant comparison, and are listed in order of their relative abundance in the WT versus control IP. Decreased interaction with the mutant EIF4G2 is represented by a stronger blue strip; white indicates no change in protein abundance. Only significant fold changes >1.5 with a P-value < 0.05 after correction for levels of EIF4G2 in IP are indicated, and only mutants for which such changes were observed are shown. (D) Volcano plot of the fold-ratio protein abundance in IPs of WT EIF4G2 compared with either R165C, 178Q, R714C, or N785K mutants, versus their significance expressed as −log10 P-value. Only interacting proteins are shown. Proteins showing significantly decreased abundance (>1.5 fold change, P < 0.05) in the mutant IP relative to the WT IP after correction for EIF4G2 levels are represented by blue dots.
Figure S2.
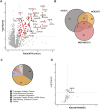
Figure S2.. Additional analysis of IP-MS data and EIF4G2 interacting proteins (related to Fig 2).
(A) Volcano plot of the second MS experiment, showing the fold ratio of the abundance of the detected proteins in WT EIF4G2 versus control IP samples, versus their significance expressed as −log10 P-value. Proteins with significantly increased abundance, that is, EIF4G2 interactors, are indicated in red. (B) Venn diagram showing overlap with previously reported DAP5 IP-MS data. 118 significant interactors from IPs of EIF4G2 from mESCs (as reported in Table S1 of reference 40), all proteins enriched over control IP with P < 0.05) and 82 significant interactors from MDA-MB-231 breast cancer cells (as reported in Supplementary Data 2 of reference 15), all proteins enriched over control IP with FDR < 0.05). (C) Pie chart showing gene annotation of protein interactors of EIF4G2 identified in the current study in HEK293T cells. (D) Volcano plot of the fold-ratio protein abundance in IPs of WT EIF4G2 compared with R505H mutant, versus their significance expressed as −log10 P-value. Only interacting proteins are shown. Proteins showing significantly decreased abundance (>1.5 fold change, P < 0.05) in the mutant IP relative to the WT IP after correction for EIF4G2 levels are represented by blue dots.
Figure S3.
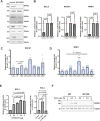
Figure S3.. Additional analysis of the translational activity of EIF4G2 mutants (related to Fig 3).
(A) Total cell lysates from HEK293T WT and EIF4G2 KO cells were subjected to Western blot analysis using EIF4G2 and the indicated antibodies to EIF4G2 targets. Each protein was run separately, and its loading control, tubulin, is shown below each respective blot. Shown are representative blots of three independent experiments. (B) HEK293T EIF4G2 KO cells were co-transfected with WT or R505H mutant EIF4G2 and reporters containing BCL2 internal ribosome entry site upstream of firefly luciferase (F-LUC) along with Renilla luciferase (R-LUC) as an internal control (left graph), or ROCK1 5′UTR (middle graph) or WNK1 5′UTR (right graph) upstream of R-LUC along with F-LUC as an internal control. F/R-LUC activity was quantified and normalized to the control R/F-LUC activity; the graph shows the relative normalized LUC activity with WT EIF4G2 transfection set as 1 (dashed red line). (C, D) qRT-PCR analysis was performed on mRNA extracted from the same lysates used in Fig 3B and C, respectively. Shown is the relative normalized LUC expression (R-LUC/F-LUC) in all samples, with WT EIF4G2 transfection set as 1 (dashed red line). (E) HEK293T KO cells were transfected with increasing concentrations of plasmids expressing EIF4G2 WT or R178Q, and with reporters containing BCL2 internal ribosome entry site upstream of F-LUC, along with R-LUC as an internal control. LUC activity assay was conducted as described in (B) on all WT plasmid concentrations (left), and on samples expressing similar levels of WT and R178Q EIF4G2, as indicated (right). F-LUC activity was quantified and normalized to the control R-LUC activity; the graph shows the relative normalized LUC activity with WT EIF4G2 transfection (right graph) or control transfection (left graph, 0) set as 1. (F) Lysates of samples transfected in parallel to those used in (E) were subjected to Western blot with anti-EIF4G2 antibodies and tubulin as loading controls, showing the dose–response of EIF4G2 expression to the increasing plasmid concentrations. Red asterisks mark the samples used for the LUC reporter assay in the right graph in (E). Shown is a representative blot from one of three independent transfection experiments used for the LUC reporter assays. Data information: for (B, C, D, E), data are presented as individual data points and as the mean ± SEM of three independent experiments. Significance was determined by matched one-way ANOVA test followed by Dunnett’s multiple comparison ad hoc test, comparing all samples with WT EIF4G2, or followed by Tukey’s multiple comparison ad hoc test, comparing all samples (left graph, (E)). In the latter, all comparisons with the 0 μg concentrations were statistically significant, but are not shown on the graph. Source data are available for this figure.
Figure 3.
Figure 3.. Effect of EIF4G2 mutations on internal ribosome entry site (IRES)-dependent and uORF-dependent translation.
(A) HEK293T EIF4G2 KO cells were co-transfected with the indicated EIF4G2 variants and a firefly luciferase (F-LUC) reporter driven by the BCL2 IRES and Renilla luciferase (R-LUC) reporter as an internal control. A schematic of the F-LUC reporter is shown, including a mutant A-cap structure and a hairpin upstream of the IRES sequence. F-LUC activity was quantified and normalized to the R-LUC activity; the graph shows the relative normalized LUC activity in all EIF4G2 transfectants with WT EIF4G2 transfection set as 1 (dashed red line). Total cell lysates were subjected to Western blot analysis using EIF4G2 and GAPDH antibodies as a loading control, shown below the graph. (B, C) HEK293T EIF4G2 KO cells were co-transfected with the indicated EIF4G2 variants and reporters containing ROCK1 5′UTR (B) or WNK1 5′UTR (C) upstream of R-LUC along with F-LUC as an internal control. Schematics of the R-LUC reporters are shown. R-LUC activity was quantified and normalized to the F-LUC activity; the graph shows the relative normalized LUC activity in all EIF4G2 transfectants with WT EIF4G2 transfection set as 1 (dashed red line). Total cell lysates were subjected to Western blot analysis using EIF4G2 and GAPDH antibodies as loading controls, shown below the graphs. Data information: for all panels, data are presented as individual data points and also as the mean ± SEM of three (A, C) or four (B) independent experiments, with a representative Western blot from one of the experiments shown. Significance was determined by matched one-way ANOVA followed by Dunnett’s multiple comparison ad hoc test (comparing all variants with the WT EIF4G2 construct). Non-significant results (P > 0.05) were not indicated in the figure. Schemes were created with BioRender.com. Source data are available for this figure.
Figure 4.
Figure 4.. EIF4G2 structural analysis predicts the possible outcome of patient-derived significant missense mutations.
(A) Model of the interaction between the MIF4G domain of EIF4G2 and EIF4A based on the structure of the yeast complex between EIF4G (yellow) and EIF4A (beige) (PDB entry 2VSX). The structure of the human EIF4G2 MIF4G domain (cyan) (PDB entry 4IUL) was superposed on yeast EIF4G. As in the yeast complex, MIF4G interacts with two domains of EIF4A. Inset a, magnification of the circled area a, showing the interface with the N-terminal domain of EIF4A. R295 (K837 in yeast EIF4G) is marked in red. Inset b, magnification of the circled area b, showing the interface with the C-terminal domain of EIF4A, highlighting the position of N86 (N86 corresponds to N615 in yeast eIF4G). R178 (K709 in yeast) is shown, making an ion pair with E174 (E706 in yeast). (B) Surface of the DAP5 MIF4G domain (PDB entry 2VSX), showing a trough between R165 and R178. The surface is colored by the Coulombic potential, blue for positive, red for negative, and white for neutral. Sulfate ions are shown as ball-and-stick, yellow and red, respectively, for the sulfur and oxygen atoms. The sulfate ion near R165 is located within a deep and strongly positive cavity. The sulfate ion near R178 is located near a weakly positive surface region.
Figure S4.
Figure S4.. Analysis of expression levels of mutant R178Q EIF4G2 (related to Fig 4).
(A) Western blot of EIF4G2 KO HEK293T cells transfected with equal quantities (5 μg plasmid) of FLAG-tagged WT or R178Q EIF4G2. Tubulin was used as a loading control. EIF4G2 signal was normalized to tubulin, and quantification results are represented as individual data points and also as mean values ± SEM of three independent experiments. Significance was determined by a paired two-tailed t test. (B) Quantitative PCR analysis was performed on mRNA extracted from the cell lysates transfected as described in (A). Shown is the relative FLAG-EIF4G2 expression, with WT EIF4G2 levels set as 1. Results are represented as individual data points and also as mean values ± SEM of three independent experiments. Significance was determined by a paired two-tailed t test. (C, D) EIF4G2 KO HEK293T cells transfected with equal quantities (5 μg) of FLAG-tagged WT or R178Q EIF4G2 were treated with proteasome inhibitor bortezomib (50 nM) for 8 h (C) or lysosome inhibitor hydroxychloroquine (10 μM) for 24 h (D), and lysates were Western-blotted for EI4G2 and either GAPDH or tubulin, as loading controls. Source data are available for this figure.

References

    1. Jackson RJ, Hellen CUT, Pestova TV (2010) The mechanism of eukaryotic translation initiation and principles of its regulation. Nat Rev Mol Cell Biol 11: 113–127. 10.1038/nrm2838 - DOI - PMC - PubMed
    1. Imataka H, Olsen HS, Sonenberg N (1997) A new translational regulator with homology to eukaryotic translation initiation factor 4G. EMBO J 16: 817–825. 10.1093/emboj/16.4.817 - DOI - PMC - PubMed
    1. Levy-Strumpf N, Deiss LP, Berissi H, Kimchi A (1997) DAP-5, a novel homolog of eukaryotic translation initiation factor 4G isolated as a putative modulator of gamma interferon-induced programmed cell death. Mol Cell Biol 17: 1615–1625. 10.1128/mcb.17.3.1615 - DOI - PMC - PubMed
    1. Yamanaka S, Poksay KS, Arnold KS, Innerarity TL (1997) A novel translational repressor mRNA is edited extensively in livers containing tumors caused by the transgene expression of the apoB mRNA- editing enzyme. Genes Dev 11: 321–333. 10.1101/gad.11.3.321 - DOI - PubMed
    1. Henis-Korenblit S, Shani G, Sines T, Marash L, Shohat G, Kimchi A (2002) The caspase-cleaved DAP5 protein supports internal ribosome entry site-mediated translation of death proteins. Proc Natl Acad Sci U S A 99: 5400–5405. 10.1073/pnas.082102499 - DOI - PMC - PubMed

Publication types

Substances