. 2024 Feb 23;73(3):485-495.
doi: 10.1136/gutjnl-2023-330987.

Gut microbiota predicts severity and reveals novel metabolic signatures in acute pancreatitis

Affiliations

Gut microbiota predicts severity and reveals novel metabolic signatures in acute pancreatitis

Christoph Ammer-Herrmenau et al. Gut. .

Abstract

Objective: Early disease prediction is challenging in acute pancreatitis (AP). Here, we prospectively investigate whether the microbiome predicts severity of AP (Pancreatitis-Microbiome As Predictor of Severity; P-MAPS) early at hospital admission.

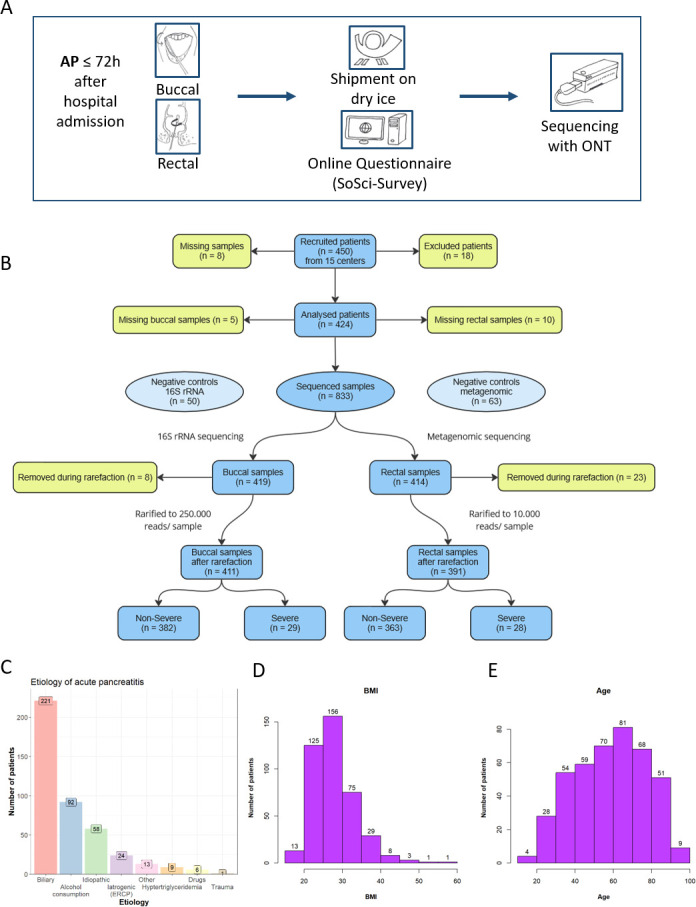
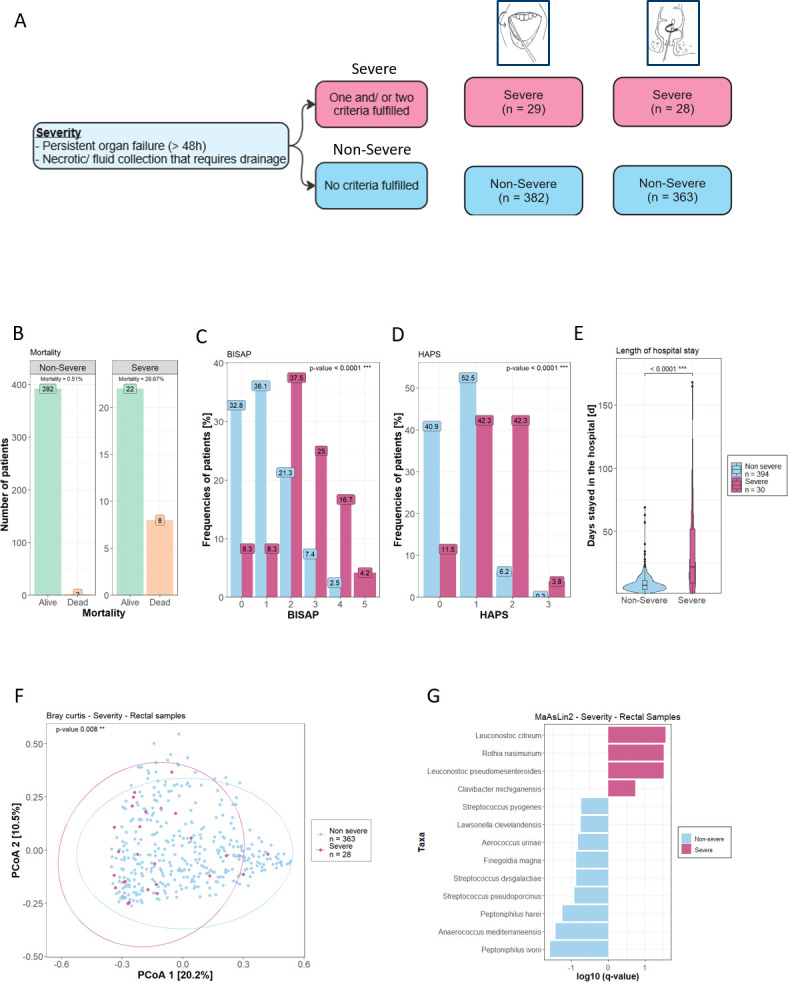
Design: Buccal and rectal microbial swabs were collected from 424 patients with AP within 72 hours of hospital admission in 15 European centres. All samples were sequenced by full-length 16S rRNA and metagenomic sequencing using Oxford Nanopore Technologies. Primary endpoint was the association of the orointestinal microbiome with the revised Atlanta classification (RAC). Secondary endpoints were mortality, length of hospital stay and severity (organ failure >48 hours and/or occurrence of pancreatic collections requiring intervention) as post hoc analysis. Multivariate analysis was conducted from normalised microbial and corresponding clinical data to build classifiers for predicting severity. For functional profiling, gene set enrichment analysis (GSEA) was performed and normalised enrichment scores calculated.

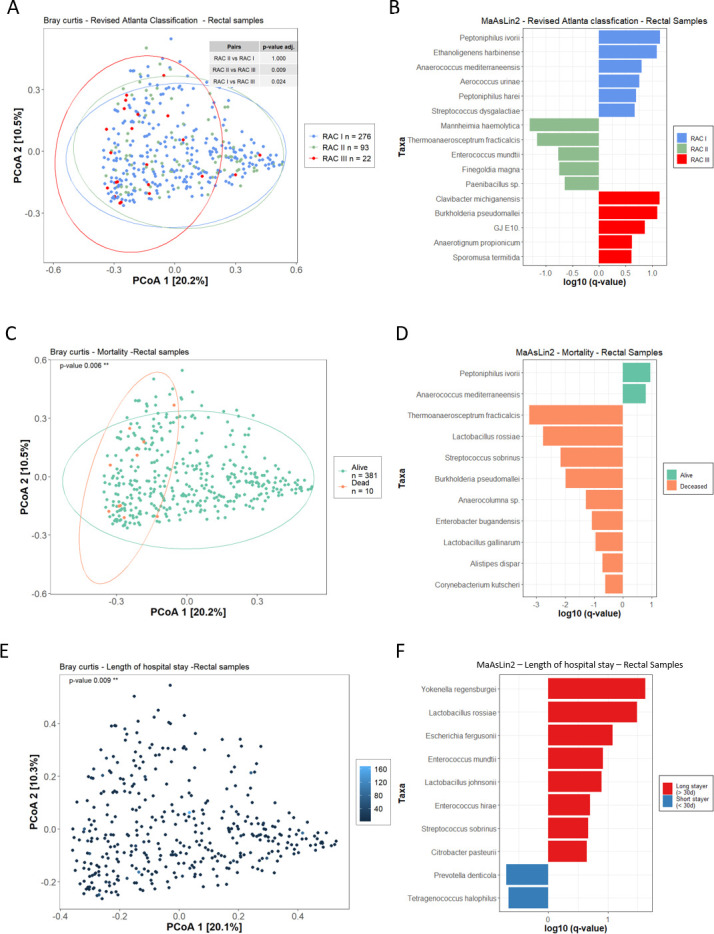
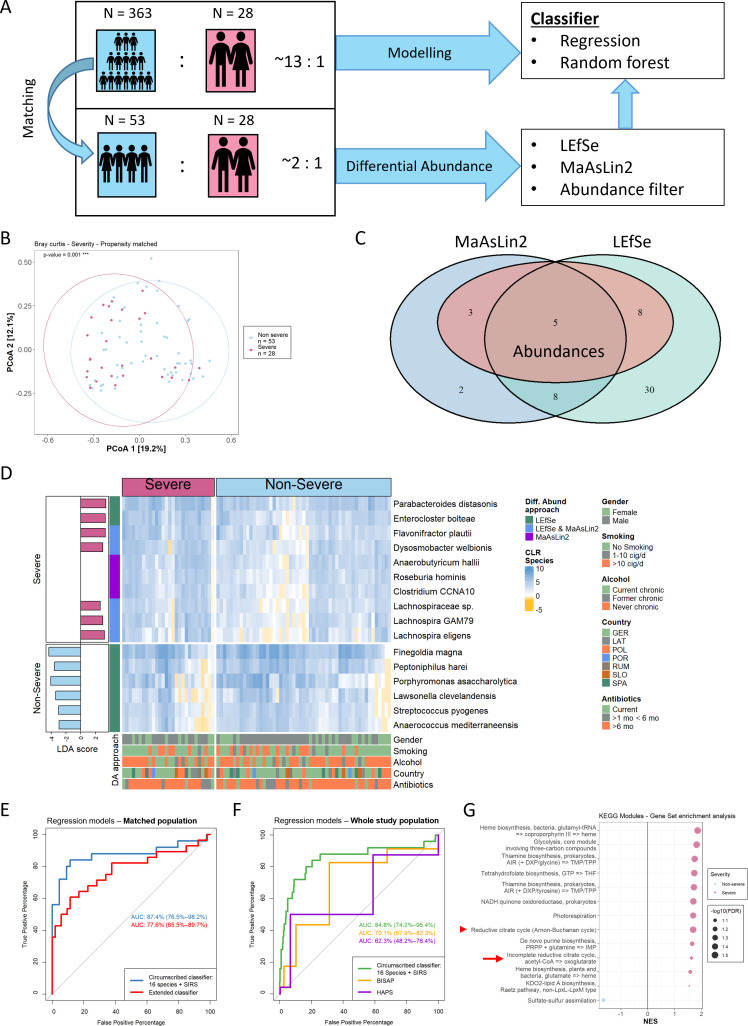
Results: After data processing, 411 buccal and 391 rectal samples were analysed. The intestinal microbiome significantly differed for the RAC (Bray-Curtis, p value=0.009), mortality (Bray-Curtis, p value 0.006), length of hospital stay (Bray-Curtis, p=0.009) and severity (Bray-Curtis, p value=0.008). A classifier for severity with 16 different species and systemic inflammatory response syndrome achieved an area under the receiving operating characteristic (AUROC) of 85%, a positive predictive value of 67% and a negative predictive value of 94% outperforming established severity scores. GSEA revealed functional pathway units suggesting elevated short-chain fatty acid (SCFA) production in severe AP.

Conclusions: The orointestinal microbiome predicts clinical hallmark features of AP, and SCFAs may be used for future diagnostic and therapeutic concepts.

Trial registration number: NCT04777812.

Keywords: acute pancreatitis; pancreas; pancreatic disorders.


Conflict of interest statement

Competing interests: None declared.

Figures

Figure 1
Figure 1
Study protocol and study population. (A) Patients with acute pancreatitis (AP) were recruited within 72 hours after hospital admission. Buccal and rectal swabs were stored at −80°C and were shipped on dry ice. Metadata were stored in SoSci Survey. All samples were sequenced using the Oxford Nanopore Technologies (ONT) platform. (B) Study population and negative control overview. Bar plots for (C) aetiologies, (D) body mass index (BMI) and (E) age. ERCP, endoscopic retrograde cholangiopancreatography.
Figure 2
Figure 2
Association of rectal microbiome with primary and secondary endpoints. (A) Bray-Curtis distances were plotted in PCoA for rectal samples and were grouped for revised Atlanta classification (RAC I=blue, RAC II=green, RAC III=red). (B) Differential abundances between RAC subgroups were calculated with MaAsLin2 and displayed in bar plots. Rectal samples were associated with mortality with (C) Bray-Curtis distances and (D) differential abundances (alive=light green, dead=orange). (E) The β-diversity distances for rectal microbiome were continuously coloured for length of hospital stay. (F) For differential abundances, a cut-off of 30 days was chosen and patients were grouped accordingly (long stayer ≥30 days=red, short stayer <30 days=blue). P values for β-diversity were calculated by PERMANOVA. Length of hospital stay was rank-transformed for PERMANOVA tests. For MaAsLin2, all potential confounders were included in multivariable testing and species were considered as differentially abundant if q-value <0.25. MaAsLin2, microbiome multivariable association with linear models; PCoA, principal coordinate analysis.
Figure 3
Figure 3
Association of rectal microbiome data with severity. (A) Definition and sample size of severe (violet) and non-severe (light blue) for buccal and rectal samples. (B) Mortality in severe and non-severe patients. Bar plots showing distributions of severe and non-severe APs regarding (C) BISAP score, (D) HAPS and (E) a violin plot for length of hospital stay. (F) For β-diversity, Bray-Curtis distances are ordinated with PCoA for rectal swabs. PERMANOVA was used to test significance. (G) Differential abundances between non-severe and severe were calculated with MaAsLin2 (including all potential confounding variables q-value <0.25) and displayed in bar plots. BISAP, Bedside Index of Severity in Acute Pancreatitis; HAPS, Harmless Acute Pancreatitis Score; LEfSe, linear discriminant analysis effect size; MaAsLin2, microbiome multivariable association with linear models; PCoA, principal coordinate analysis.
Figure 4
Figure 4
Building classifiers for prediction of severity. (A) The graphical summary describes the modelling process. By using the matchIT package, 53 patients were identified from the non-severe cohort who matched best regarding 79 clinical features. (B) Bray-Curtis distances were calculated for rectal samples of matched population and PERMANOVA test was performed to assess p value. (C) The Venn diagram explains the distribution of differential abundant species obtained by LEfSe (LDA score >2, p value < 0.05), MaAsLin2 (all potential confounders included and q value <0.05) and abundance filter (median proportion 0.002 in at least one group). (D) A heatmap displays the distribution of centred log transformed (CLR) abundances of 16 differential abundant species and clinical parameters in matched study population. An extended (elastic net) and circumscribed (Ridge) model was built for (E) matched cohort and (F) whole study population. The extended model included all 819 rectal species and all 79 potential clinical confounders. For circumscribed model, 16 differential abundant species and SIRS were combined and were compared with BISAP and HAPS. (G) Gene set enrichment analysis (GSEA) of KEEG orthologies (KOs) calculated for KEGG modules revealed functional pathway units which contribute to short-chain fatty acid (SCFA) production (red arrows) more expressed in severe APs (violet). AP, acute pancreatitis; BISAP, Bedside Index of Severity in Acute Pancreatitis; HAPS, Harmless Acute Pancreatitis Score; LEfSe, linear discriminant analysis effect size; LDA, linear discriminant analysis; MaAsLin2, multivariable association with linear models 2.

Similar articles

Cited by

References

    1. Peery AF, Crockett SD, Barritt AS, et al. . Burden of gastrointestinal, liver, and pancreatic diseases in the United States. Gastroenterology 2015;149:1731–41. 10.1053/j.gastro.2015.08.045 - DOI - PMC - PubMed
    1. Vege SS, Gardner TB, Chari ST, et al. . Low mortality and high morbidity in severe acute pancreatitis without organ failure: a case for revising the Atlanta classification to include "moderately severe acute pancreatitis" Am J Gastroenterol 2009;104:710–5. 10.1038/ajg.2008.77 - DOI - PubMed
    1. Mofidi R, Duff MD, Wigmore SJ, et al. . Association between early systemic inflammatory response, severity of multiorgan dysfunction and death in acute Pancreatitis. Br J Surg 2006;93:738–44. 10.1002/bjs.5290 - DOI - PubMed
    1. Kwong W-Y, Ondrejková A, Vege SS. Predictors and outcomes of moderately severe acute pancreatitis - evidence to reclassify. Pancreatology 2016;16:940–5. 10.1016/j.pan.2016.08.001 - DOI - PubMed
    1. Czapári D, Váradi A, Farkas N, et al. . Detailed characteristics of post-discharge mortality in acute pancreatitis. Gastroenterology 2023;165:682–95. 10.1053/j.gastro.2023.05.028 - DOI - PubMed

Publication types

Substances

Associated data