. 2023 Dec 21;14(12):854.
doi: 10.1038/s41419-023-06369-9.

UBE2O reduces the effectiveness of interferon-α via degradation of IFIT3 in hepatocellular carcinoma

Affiliations

UBE2O reduces the effectiveness of interferon-α via degradation of IFIT3 in hepatocellular carcinoma

Heng Li et al. Cell Death Dis. .

Abstract

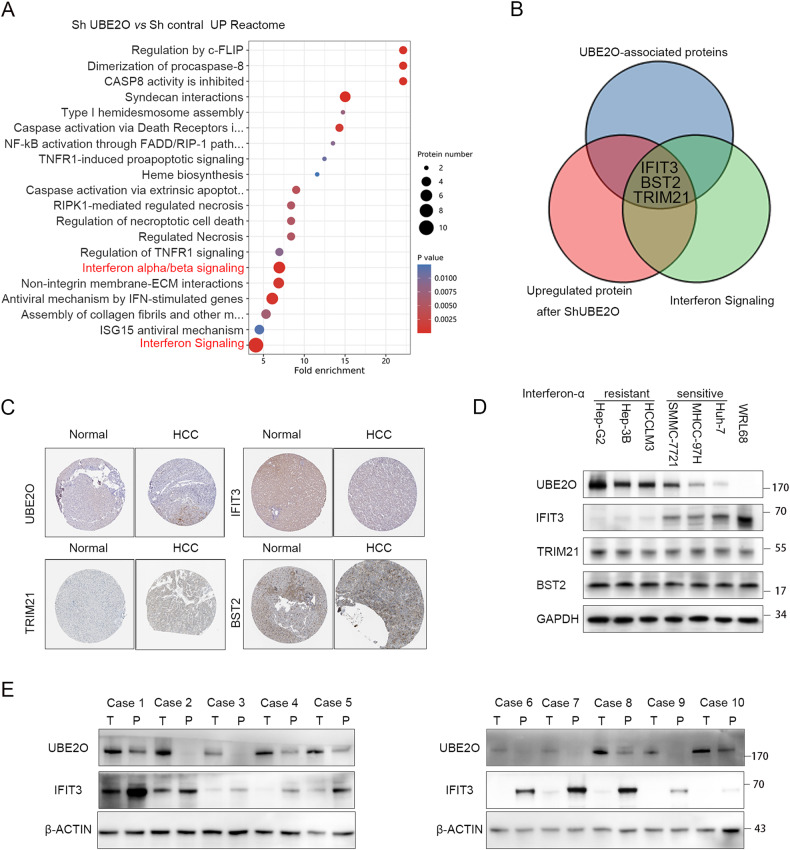
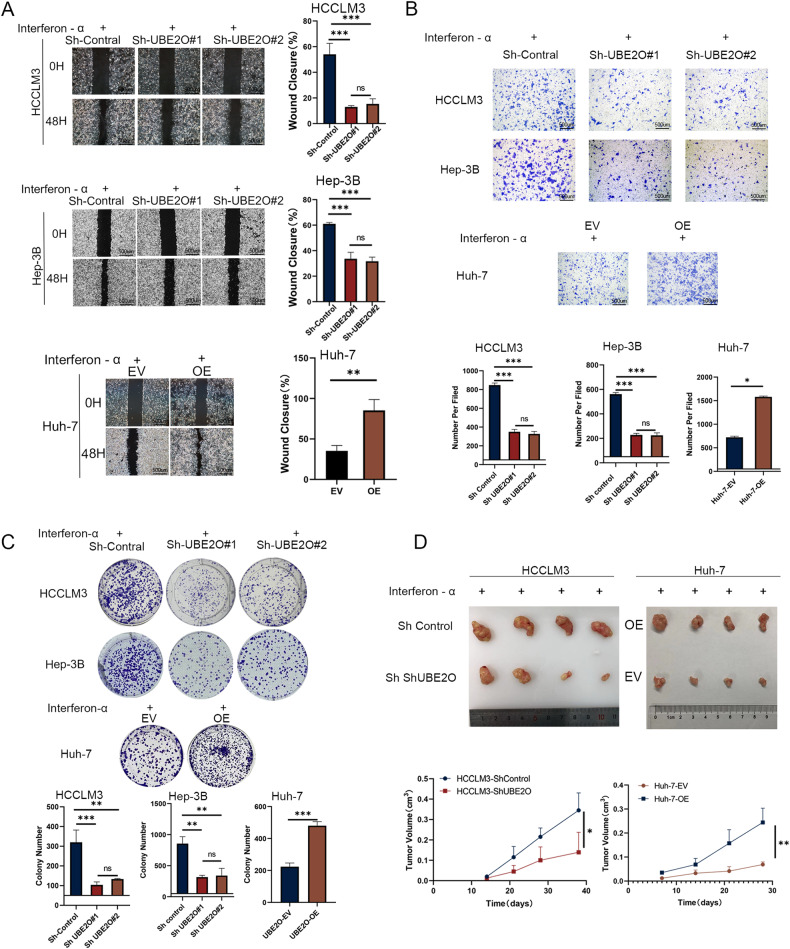
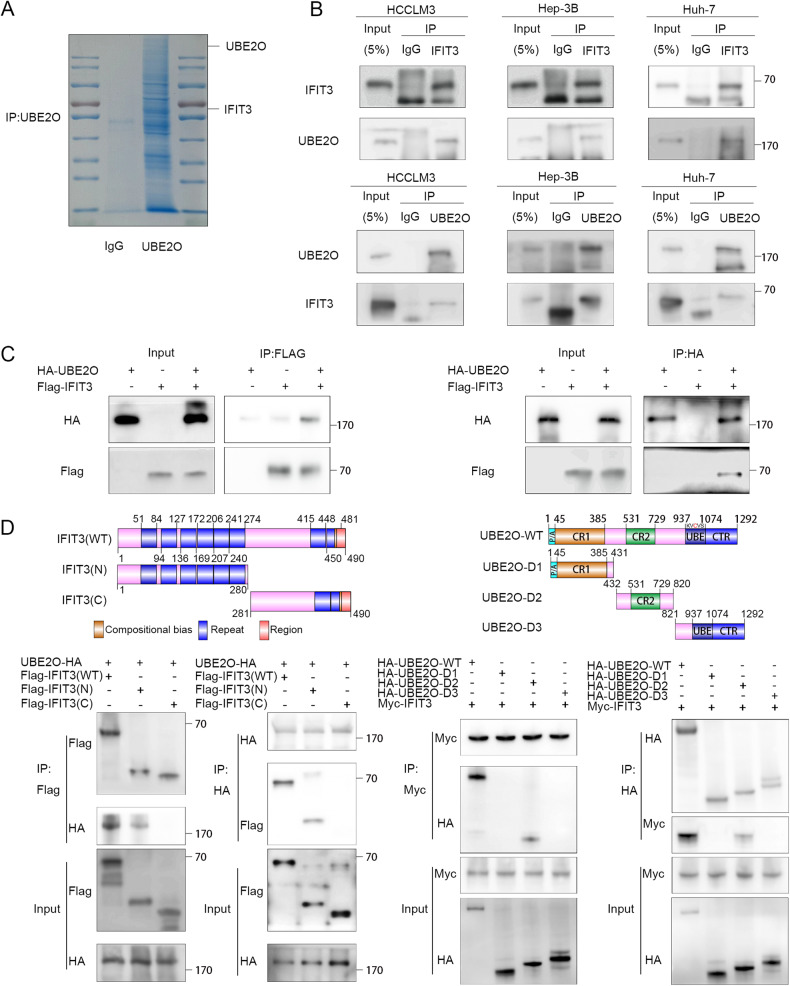
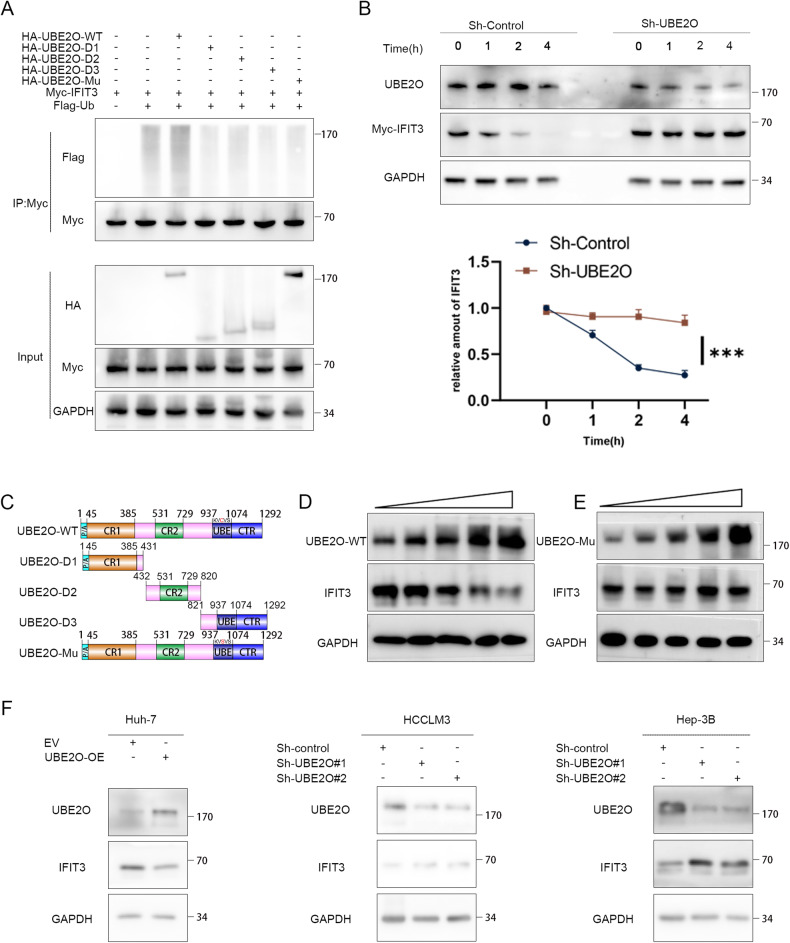
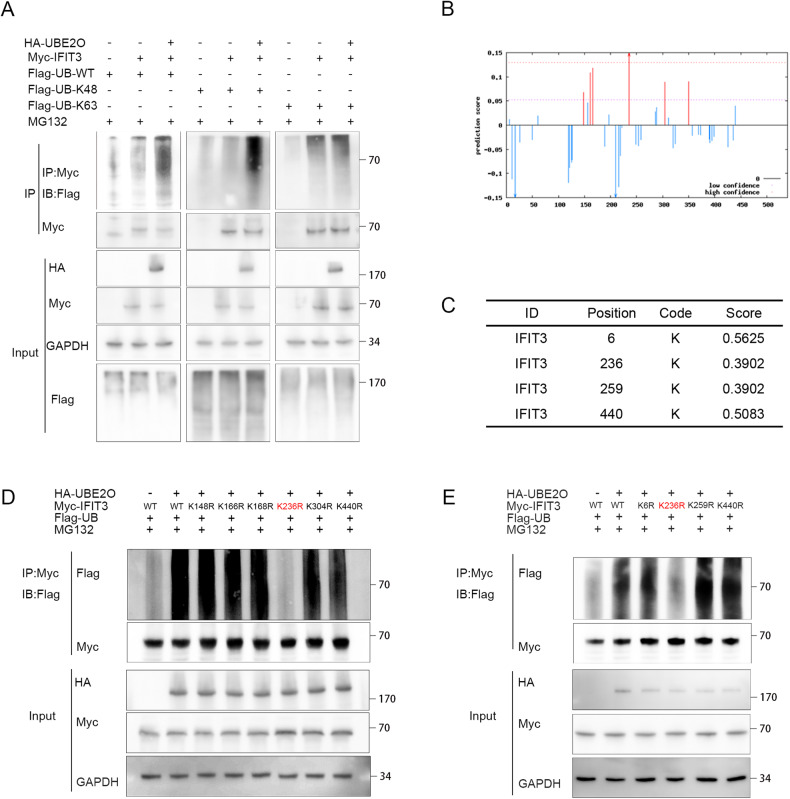
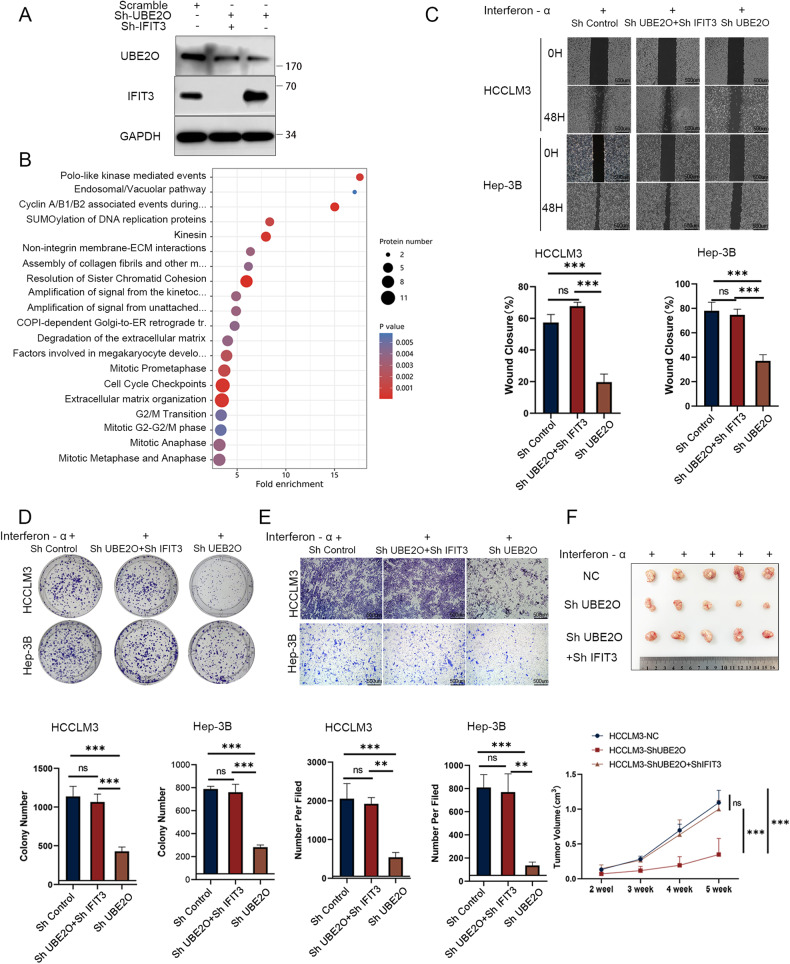
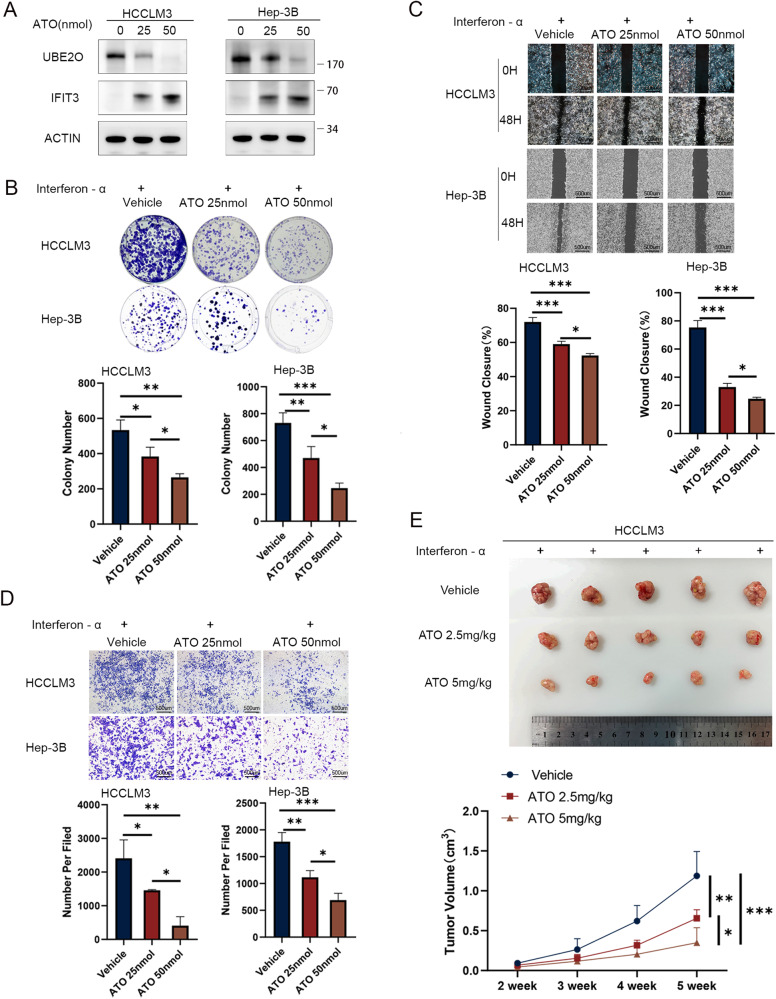
Interferon (IFN) exerts its effects through interferon-stimulated genes (ISGs), but its efficacy is limited by interferon resistance, which can be caused by the ubiquitination of key proteins. UBE2O was initially identified as a promising therapeutic target based on data from the TCGA and iUUCD 2.0 databases. Through the inhibition of UBE2O, interferon α/β signaling and overall interferon signaling were activated. Integrating data from proteomic, mass spectrometry, and survival analyses led to the identification of IFIT3, a mediator of interferon signaling, as a ubiquitination substrate of UBE2O. The results of in vitro and in vivo experiments demonstrated that the knockdown of UBE2O can enhance the efficacy of interferon-α by upregulating IFIT3 expression. K236 was identified as a ubiquitination site in IFIT3, and the results of rescue experiments confirmed that the effect of UBE2O on interferon-α sensitivity is dependent on IFIT3 activity. ATO treatment inhibited UBE2O and increased IFIT3 expression, thereby increasing the effectiveness of interferon-α. In conclusion, these findings suggest that UBE2O worsens the therapeutic effect of interferon-α by targeting IFIT3 for ubiquitination and degradation.


Conflict of interest statement

The authors declare no competing interests.

Figures

Fig. 1
Fig. 1. UBE2O negatively regulates IFIT3 expression in HCC.
A Cells stably transduced with Sh-UBE2O were established using lentiviral transduction, and proteomic analysis was performed with controls. Reactome enrichment analysis was performed with the upregulated differentially expressed proteins. Reactome enrichment analysis was performed with the ReactomePA R package. B Immunoprecipitation was conducted in HCCLM3 cells using an anti-UBE2O antibody, and the samples were sent for mass spectrometry analysis to identify proteins bound to UBE2O (indicated by blue circles). Proteins upregulated after UBE2O knockdown are indicated by red circles, while those involved in the interferon pathway are indicated by green circles. The proteins overlapping among these three groups were identified as IFIT3, BST2, and TRIM21. C The expression of UBE2O, IFIT3, TRIM21, and BST2 was queried in the HPA database. UBE2O and IFIT3 exhibited opposing expression trends; UBE2O was highly expressed, but IFIT3 was expressed at low levels in HCC tissues, whereas normal liver tissue showed low expression of UBE2O and high expression of IFIT3. Both UBE2O and TRIM21, as well as BST2, displayed similar trends, with high expression observed in HCC tissues but low expression observed in normal liver tissues. D In HCC cell lines, UBE2O was highly expressed in tumor cells and expressed at low levels in normal cells. In contrast, IFIT3 was expressed at low levels in tumor cells and highly expressed in normal hepatocytes (n = 3). Cell lines with low UBE2O combined with high IFIT3 are interferon-α sensitive, whereas cells with high UBE2O combined with low IFIT3 are interferon-resistant. E The protein expression levels of UBE2O and IFIT3 were determined in patients with hepatocellular carcinoma (n = 3).
Fig. 2
Fig. 2. Inhibition of UBE2O can increase the therapeutic effect of interferon-α.
After knockdown or overexpression of UBE2O and treatment with equal concentrations of interferon-α, wound healing (A) migration (B) and colony formation assays (C) were conducted to assess changes in HCC cell sensitivity to interferon. The data are expressed as the mean ± SD of three independent experiments. *p < 0.05, **p < 0.01, ***p < 0.001. The pictures are representative of the results of one experiment. Ordinary one-way ANOVA with multiple comparisons testing was used to examine the statistical significance of differences among the three independent groups. Unpaired t-test was used for comparisons between two independent groups. D Cells from the experimental and control groups were injected subcutaneously into the inguinal region of nude mice, followed by treatment with equal concentrations of interferon-α (5 × 106 U/kg per day). Tumor volumes were calculated every 3 days (n = 4 mice/group). The data are shown as the means ± SDs. *p < 0.05, **p < 0.01. Ordinary one-way ANOVA with multiple comparisons testing was used for statistical analysis.
Fig. 3
Fig. 3. UBE2O interacts with IFIT3.
A Immunoprecipitation was carried out using anti-rabbit IgG and an anti-UBE2O antibody. Following electrophoresis, the gel strips were stained with Coomassie blue. B The indicated cells were lysed in buffer and then subjected to Co-IP analysis with protein A/G magnetic beads and anti-UBE2O or anti-IFIT3 antibodies, followed by Western blot analysis (n = 3). C 293 T cells were transfected with plasmids containing different tags. After 48 h, the cells were treated with MG132 (10 μM) for 4-6 h. Cells were lysed with buffer and then subjected to Co-IP analysis with protein A/G beads and antibodies specific for the corresponding tags, followed by Western blot analysis (n = 3). D Truncation mutants of IFIT3 and UBE2O were generated as indicated, and plasmids carrying different tags were transfected into 293 T cells. IP was performed using anti-HA and anti-Myc antibodies, followed by IB with the corresponding antibodies.
Fig. 4
Fig. 4. IFIT3 protein stability is regulated by UBE2O.
A 293 T cells were transfected with the designated plasmids and subsequently exposed to MG132 (10 μM) for a duration of 6 h. The lysed cells were then subjected to coimmunoprecipitation using anti-Myc antibodies, followed by Western blot analysis utilizing anti-Flag antibodies (n = 3). B Stably transfected cells with UBE2O knockdown were established and validated. The cells were treated with cycloheximide (80 μg/mL), and protein was harvested at designated time points for Western blot analysis. Relative band densities were quantified by ImageJ. The data are expressed as the mean ± SD of three independent experiments. Ordinary one-way ANOVA with multiple comparisons testing was used for statistical analysis. *p < 0.05. C Schematic presentation of wild-type UBE2O and the UBE2O mutants. D Gradient overexpression of UBE2O-WT (0.5 µg, 1.5 µg, 2.5 µg, 3.5 µg, and 4.5 µg) was performed, and after 48 h of incubation, the cells were lysed to obtain ~400 ml of total cellular protein per dish for subsequent Western blot analysis of IFIT3 protein expression (n = 3). E Similarly, the amount of the UBE2O-mutant (M3) plasmid transfected was incrementally increased (0.5 µg, 1.5 µg, 2.5 µg, 3.5 µg, 4.5 µg), and the corresponding IFIT3 protein expression levels were measured 48 h posttransfection (n = 3). F In HCCLM3 and Hep-3B cells, knockdown of UBE2O resulted in an increase in the IFIT3 protein level, but overexpression of UBE2O led to a decrease in the IFIT3 protein level in Huh-7 cells (n = 3).
Fig. 5
Fig. 5. K236 is the site of UBE2O-mediated ubiquitination in IFIT3.
A Plasmids containing different tags were cotransfected into 293 T cells. Immunoprecipitation using an anti-Myc antibody, followed by immunoblotting (IB) with the corresponding antibodies, was conducted to determine the type of ubiquitination (n = 3). B Prediction of ubiquitination sites in IFIT3 using the CKSAAP database. C Prediction of ubiquitination sites in IFIT3 using the GPS-Uber database. D IFIT3 mutants were generated based on prediction results from the CKSAAP database and transfected into 293 T cells for the in vivo ubiquitination assay. Mutation of K236 abolished the ubiquitination-mediated degradation of IFIT3 via UBE2O. E Based on the prediction results from the GPS-Uber database, mutations were introduced into IFIT3, and plasmids with the appropriate tags were transfected. IP was performed using an anti-Myc antibody, while IB was carried out using the corresponding antibody. Mutation of K236 abolished the ubiquitination-mediated degradation of IFIT3.
Fig. 6
Fig. 6. IFIT3 reverses UBE2O knockdown-mediated interferon-α treatment potentiation.
Three kinds of cells were generated by transduction with the control, Sh-UBE2O, and Sh-IFIT3 lentiviral vectors, as shown in Fig. 6A. A Validation of the knockdown efficiency in the stably transduced cell lines. B Proteomic analysis was performed in the control and Sh-UBE2O+Sh-IFIT3 groups. The results showed that UBE2O no longer negatively regulated the interferon pathway after knockdown of IFIT3. Wound healing assays (C) colony formation assays (D) and migration assays (E) were used to verify the effect of the knockdown of UBE2O alone and simultaneous knockdown of UBE2O and IFIT3 on interferon sensitivity. Each set of experiments was performed with the same interferon concentration. The data are expressed as the mean ± SD of three independent experiments. *p < 0.05, **p < 0.01, *** p < 0.001, ns, nonsignificant. Ordinary one-way ANOVA with multiple comparisons testing was used to examine the statistical significance of differences among the three independent groups. F Stably transfected HCCLM3 cells from the control group, the UBE2O knockdown group, and the UBE2O and IFIT3 simultaneous knockdown group were injected into the inguinal region of mice, which were treated with the same dose of interferon, and the tumor volumes were calculated periodically (n = 5 mice/group). Ordinary one-way ANOVA with multiple comparisons testing was used for statistical analysis. ***p < 0.001, ns, nonsignificant.
Fig. 7
Fig. 7. ATO improves the effect of interferon-α therapy by inhibiting UBE2O in HCC.
Following treatment with interferon-α, cells were exposed to vehicle (0), 25 nmol of ATO, and 50 nmol of ATO for a duration of 4–8 h. Protein levels of UBE2O and IFIT3 were assessed via Western blot analysis (A). Cellular responses were evaluated using colony formation assays (B) wound healing assays (C) and migration assays (D). The images are from one representative experiment. The data are expressed as the mean ± SD of three independent experiments. *p < 0.05, **p < 0.01, ***p < 0.001. Ordinary one-way ANOVA with multiple comparisons testing was used to examine the statistical significance of differences among the three independent groups. (E) Three million HCCLM3 cells were implanted subcutaneously into nude mice. After 2 weeks, mice in the experimental and control groups were treated with interferon-α (5 × 106 U/kg per day) combined with different concentrations of ATO (2.5 mg/kg or 5 mg/kg, daily), and tumor volumes were calculated periodically. Ordinary one-way ANOVA with multiple comparisons testing was used for statistical analysis. *p < 0.05, **p < 0.01, ***p < 0.001.

Similar articles

Cited by

References

    1. Ferlay J, Steliarova-Foucher E, Lortet-Tieulent J, Rosso S, Coebergh JW, Comber H, et al. Cancer incidence and mortality patterns in Europe: estimates for 40 countries in 2012. Eur J Cancer. 2013;49:1374–403. doi: 10.1016/j.ejca.2012.12.027. - DOI - PubMed
    1. Byrne TJ, Rakela J. Loco-regional therapies for patients with hepatocellular carcinoma awaiting liver transplantation: selecting an optimal therapy. World J Transplant. 2016;6:306–13. doi: 10.5500/wjt.v6.i2.306. - DOI - PMC - PubMed
    1. Kao KC, Jaccard A, Ho PC. IFNalpha potentiates immune-checkpoint blockade by rewiring metabolic cross-talk. Cancer Discov. 2022;12:1615–6. doi: 10.1158/2159-8290.CD-22-0472. - DOI - PubMed
    1. Ma H, Yang W, Zhang L, Liu S, Zhao M, Zhou G, et al. Interferon-alpha promotes immunosuppression through IFNAR1/STAT1 signalling in head and neck squamous cell carcinoma. Br J Cancer. 2019;120:317–30. doi: 10.1038/s41416-018-0352-y. - DOI - PMC - PubMed
    1. Benci JL, Xu B, Qiu Y, Wu TJ, Dada H, Twyman-Saint Victor C, et al. Tumor interferon signaling regulates a multigenic resistance program to immune checkpoint blockade. Cell. 2016;167:1540–54.e12. doi: 10.1016/j.cell.2016.11.022. - DOI - PMC - PubMed

Publication types

MeSH terms

Substances