The potential of emerging bio-based products to reduce environmental impacts
- PMID: 38129383
- PMCID: PMC10739733
- DOI: 10.1038/s41467-023-43797-9
The potential of emerging bio-based products to reduce environmental impacts
Abstract
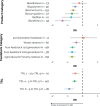
The current debate on the sustainability of bio-based products questions the environmental benefits of replacing fossil- by bio-resources. Here, we analyze the environmental trade-offs of 98 emerging bio-based materials compared to their fossil counterparts, reported in 130 studies. Although greenhouse gas life cycle emissions for emerging bio-based products are on average 45% lower (-52 to -37%; 95% confidence interval), we found a large variation between individual bio-based products with none of them reaching net-zero emissions. Grouped in product categories, reductions in greenhouse gas emissions ranged from 19% (-52 to 35%) for bioadhesives to 73% (-84 to -54%) for biorefinery products. In terms of other environmental impacts, we found evidence for an increase in eutrophication (369%; 163 to 737%), indicating that environmental trade-offs should not be overlooked. Our findings imply that the environmental sustainability of bio-based products should be evaluated on an individual product basis and that more radical product developments are required to reach climate-neutral targets.
© 2023. The Author(s).
Conflict of interest statement
The authors declare no competing interests.
Figures


References
-
- Global Bioeconomy Summit 2020. Expanding the Sustainable Bioeconomy – Vision and Way Forward. in Communiqué of the Global Bioeconomy Summit 2020 1–28 (2020).
-
- European Commission. A sustainable Bioeconomy for Europe: strengthening the connection between economy, society and the environment. 10.2777/478385 (2018).
-
- European Commission. Communication from the Commission to the European parliament, the European council, the council, the European economic and social committee and the committee of the regions the European green deal. (European Commission, 2019).
-
- Walker, S. & Rothman, R. Life cycle assessment of bio-based and fossil-based plastic: a review. J. Clean. Prod. 261, (2020).
Publication types
MeSH terms
Substances
Associated data
Grants and funding
- 016.Vici.170.190/Nederlandse Organisatie voor Wetenschappelijk Onderzoek (Netherlands Organisation for Scientific Research)
- 016.Vici.170.190/Nederlandse Organisatie voor Wetenschappelijk Onderzoek (Netherlands Organisation for Scientific Research)
- 016.Vici.170.190/Nederlandse Organisatie voor Wetenschappelijk Onderzoek (Netherlands Organisation for Scientific Research)
LinkOut - more resources
Full Text Sources

