. 2023 Dec 21;14(1):8499.
doi: 10.1038/s41467-023-43438-1.

ANKS1B encoded AIDA-1 regulates social behaviors by controlling oligodendrocyte function

Affiliations

ANKS1B encoded AIDA-1 regulates social behaviors by controlling oligodendrocyte function

Chang Hoon Cho et al. Nat Commun. .

Abstract

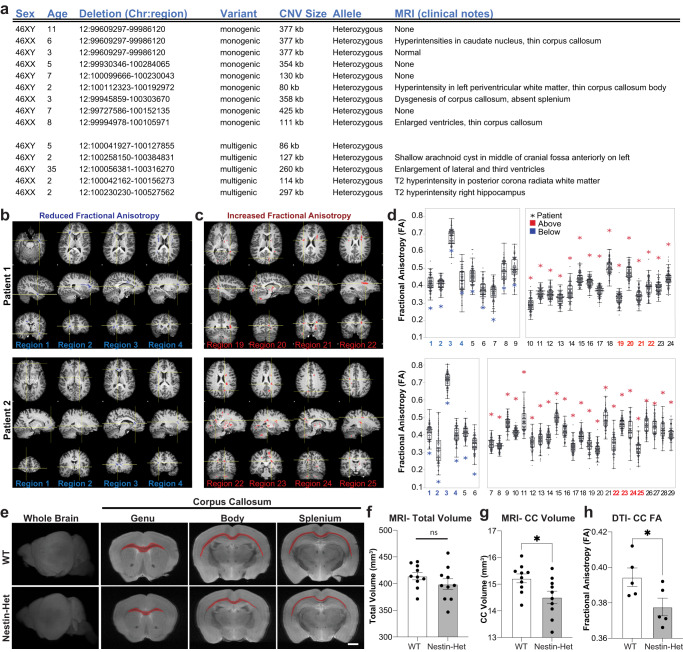
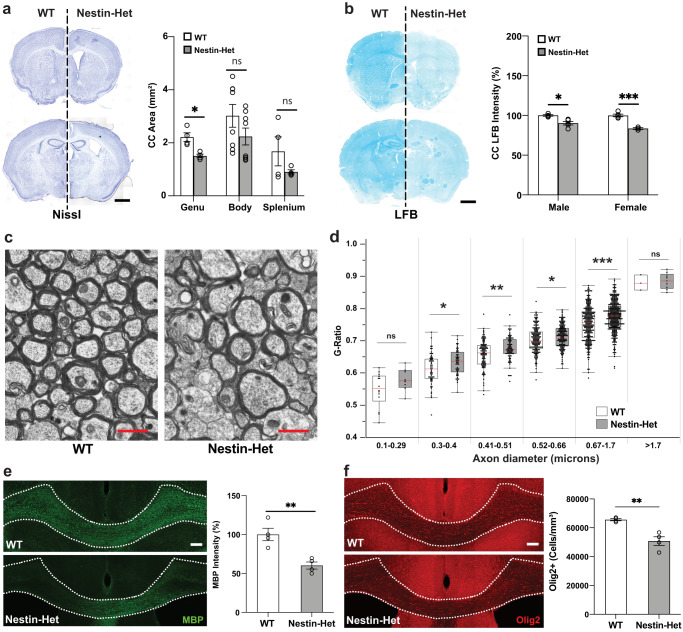
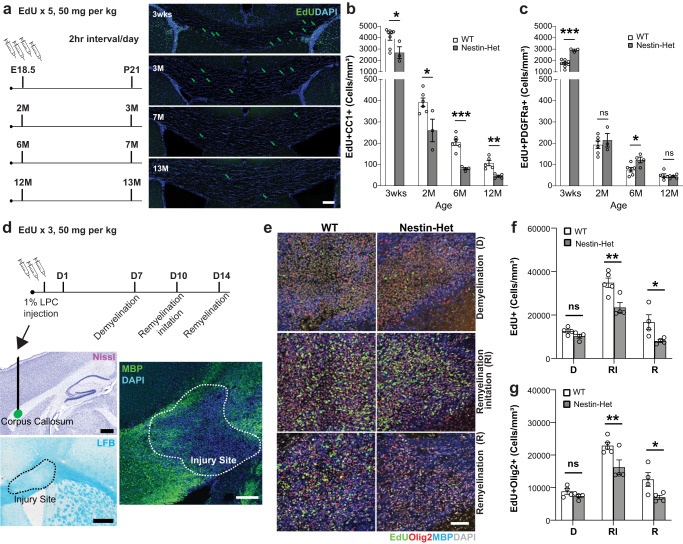
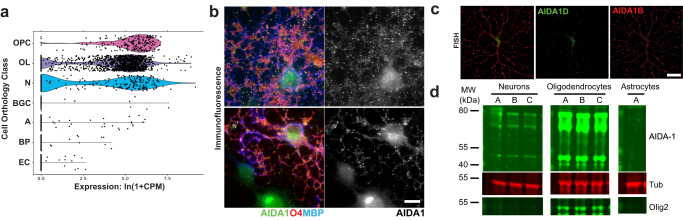
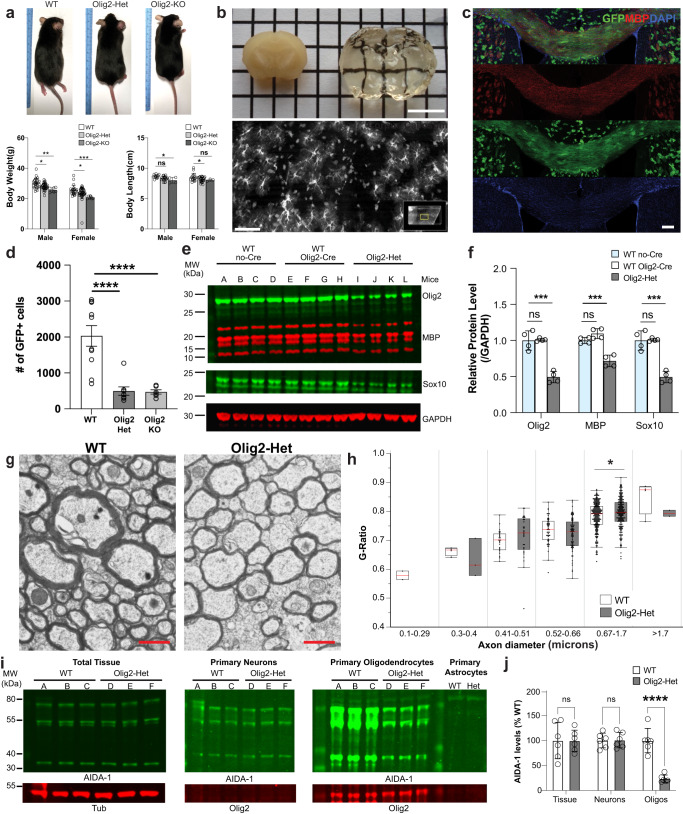
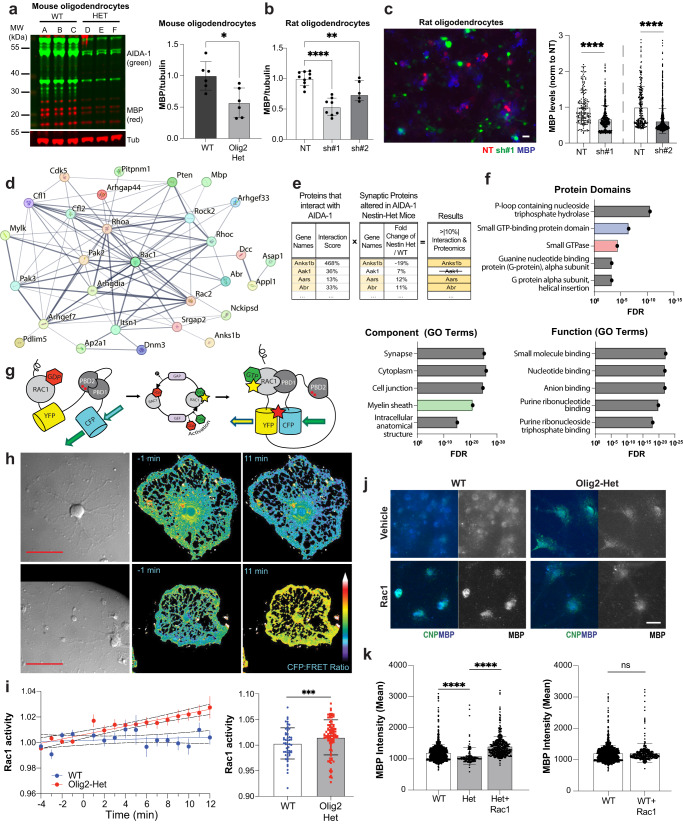
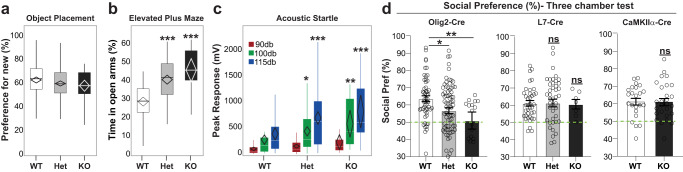
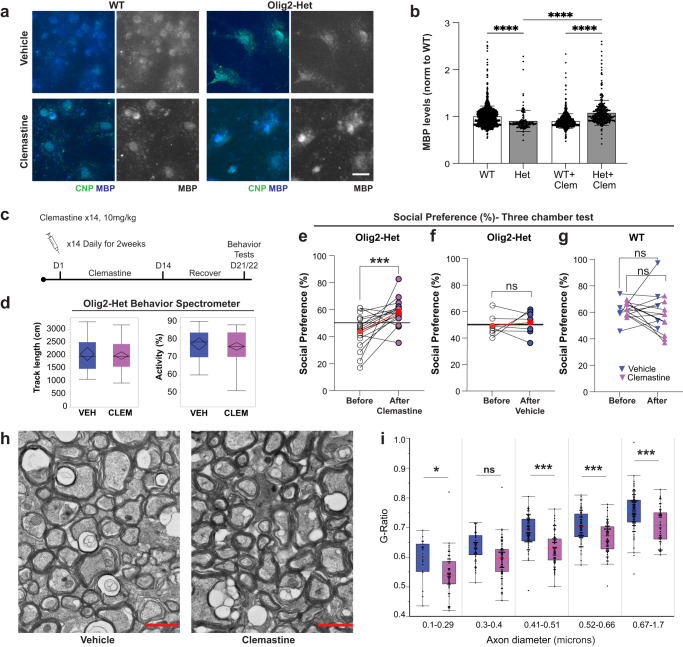
Heterozygous deletions in the ANKS1B gene cause ANKS1B neurodevelopmental syndrome (ANDS), a rare genetic disease characterized by autism spectrum disorder (ASD), attention deficit/hyperactivity disorder, and speech and motor deficits. The ANKS1B gene encodes for AIDA-1, a protein that is enriched at neuronal synapses and regulates synaptic plasticity. Here we report an unexpected role for oligodendroglial deficits in ANDS pathophysiology. We show that Anks1b-deficient mouse models display deficits in oligodendrocyte maturation, myelination, and Rac1 function, and recapitulate white matter abnormalities observed in ANDS patients. Selective loss of Anks1b from the oligodendrocyte lineage, but not from neuronal populations, leads to deficits in social preference and sensory reactivity previously observed in a brain-wide Anks1b haploinsufficiency model. Furthermore, we find that clemastine, an antihistamine shown to increase oligodendrocyte precursor cell maturation and central nervous system myelination, rescues deficits in social preference in 7-month-old Anks1b-deficient mice. Our work shows that deficits in social behaviors present in ANDS may originate from abnormal Rac1 activity within oligodendrocytes.


Conflict of interest statement

The authors declare no competing interests.

Figures

Fig. 1
Fig. 1. Anks1b haploinsufficiency leads to structural abnormalities in corpus callosum.
a Table showing patient genomic abnormalities and findings in clinical MRIs. MRIs from two patients showing sample brain regions of (b) reduced Fractional Anisotropy (FA) and (c) increased FA compared to controls. d Quantitation of FA in diverse brain areas showing patient values (asterisk) compared to the same regions in neurotypical controls (data points and box plots); Values shown = p < 0.05 as determined by voxel-wise comparison using EZ-Map. N = 2 affected individuals and 101 neurotypical controls. The range on box plots represents quartiles, center and whiskers delineate minima and maxima with outliers (3 standard deviations from the mean) plotted. Notice that most patient FA values lay beyond outliers. eg T2-weighted MRIs of ex vivo brain tissue from 10 female Anks1b Nestin-Het and 10 female WT controls (age 3 months) reveal (f) no changes in overall brain volume, but (g) a significantly smaller corpus callosum. (p = 0.02277). Scale bar = 1 mm (h) In vivo diffusion tensor imaging (DTI) reveals decreased fractional anisotropy in corpus callosum (p = 0.0493), suggesting impaired white matter integrity. Nestin-Het (n = 5), WT (n = 5) for in vivo mouse experiments. fh Error bars reflect mean ± s.e.m. T-tests, two-sided; *p < 0.05. Source data for d, fh are provided as a Source Data file.
Fig. 2
Fig. 2. Abnormal myelin sheath integrity and fewer oligodendrocytes in an Anks1b haploinsufficiency mouse model.
a Nissl staining of Anks1b Nestin-Het (n = 6) and WT (n = 8) mice shows decreased area of the corpus callosum. Images are representative of 18 sections from each mouse with acute slices from both genotypes placed side by side; scale bar = 1 mm; (p = 0.007463). b LFB (Luxol fast blue) staining for myelin sheath components reveals decreased density in corpus callosum of male and female Anks1b Nestin-Het mice compared to controls. Images are representative of 5 sections from each mouse; scale bar = 1 mm; (*p = 0.006713, ***p = 0.000357). c Transmission Electron Microscopy (TEM) images of callosal cross-sections from WT and Nestin-Het mice showing myelinated axons; scale bar = 1 µm. d Quantitation of g-ratio (the ratio of the inner-to-outer diameter of a myelinated axon) binned across the indicated axonal diameters. Results are from 12 animals (n = 6 WT, n = 6 Nestin-Het). Box plots show the 25th–75th quantiles (box), mean (red line), and whiskers delineate 3 standard deviations from the mean. e Immunostaining for myelin basic protein (MBP) reveals decreased myelination in callosal regions (dotted lines) of Anks1b Nestin-Het mice. Scale bar = 100 μm. (p = 0.00523). f Immunostaining for Olig2 reveals fewer oligodendrocytes per unit area. Scale bar = 100 μm. (p = 0.00299). For e, f: n = 8 Anks1b Nestin-Het, n = 8 WT, 4 sections from each mouse. a, b, e, f Error bars reflect mean ± s.e.m. af T-tests, two-sided; *, **, ***p < 0.05, p < 0.005, p < 0.0005. Source data for a, b, d, e, and f are provided as a Source Data file.
Fig. 3
Fig. 3. Impaired oligodendrocyte maturation and motility in Anks1b Nestin-Het mice.
a To label newborn cells: pregnant females at E18.5 or mice at 2, 6, or 12 months of age were injected with EdU IP five times, in 2-h intervals. Four weeks after injections, mice were sacrificed and brain tissue was sectioned and immunostained to identify newborn cells (EdU+) and oligodendrocyte developmental stage (PDGFRa for OPCs and immature oligodendrocytes, CC1 for mature oligodendrocytes). Scale bar = 100 μm. b Significantly fewer mature oligodendrocytes were observed in Anks1b Nestin-Het mice, (T-test, two-tailed: 3weeks p = 0.035; 2 months p = 0.023; 6 months p = 0.0001478; 12 months p = 0.00158). c with concomitant increases or unchanged numbers of immature oligodendrocytes throughout all ages tested, (T-test, two-tailed: 3weeks p = 0.0001587; 6 months p = 0.0264). Number of animals at 3 weeks (WT: 8, Het: 3), 2 months (WT: 6, Het: 3), 6 months (WT: 6, Het: 4), 12 months (WT: 5, Het: 5), 4 sections per mouse. d (Upper) For myelin lesion experiments: 1% LPC (lysophosphatidylcholine) was injected into callosal regions to lesion myelin sheaths. EdU was injected IP to track newborn cells, and mice were sacrificed 7 (Demyelination-D), 10 (Remyelination Initiation-RI), and 14 days later (Remyelination-R). (Lower) Lesions were observed as areas of decreased MBP expression or LFB staining. Scale bar = 20 μm. e Representative image showing newborn oligodendrocyte (EdU+ and Olig2+ together) accumulation in lesioned areas in both genotypes. Scale bar = 20 μm. f Quantitation showing that fewer cells overall (n = 4 WT and 4 Het mice for condition D, 5 WT and 4 Het mice for RI, and 4 WT and 4 Het mice for condition R), RI; p = 0.00056, R; p = 0.00722), and (g) fewer oligodendrocyte lineage cells accumulate in lesioned areas (n = same as (f), RI; p = 0.00247, R; p = 0.01314), suggesting impaired maturation or migration of OPCs. (b, c, f, g) Error bars reflect mean ± s.e.m. Source data for b, c, f, and g are provided as a Source Data file.
Fig. 4
Fig. 4. AIDA-1 is expressed in oligodendrocyte lineage cells.
a Partial list of Anks1b transcript expression data among 236 cell types as documented in Tabula Muris. Substantial Anks1b expression is observed in only 3 cell types: OPC (oligodendrocyte precursor cells), OL (oligodendrocytes), and N (neurons). Also see Supplementary Fig. 4; BGC: Bergmann glial cell, A: astrocyte, BP: brain pericyte, EC: endothelial cell. b Immunocytochemistry image showing AIDA-1 is expressed in puncta throughout oligodendrocyte cell bodies. MBP: myelin basic protein, O4: Oligodendrocyte Marker O4. Scale bar = 10 μm. Representative image of >20 cells from 3 independent cell cultures. c Fluorescent in situ hybridization reveals prominent expression of larger Anks1b transcripts encoding for large (AIDA-1B) and small (AIDA-1D) AIDA-1 splice variants throughout oligodendrocyte cell bodies. Scale bar = 10 μm. Representative image from 3 independent cell cultures. d Western blot of lysates from neuronal, oligodendrocyte, and astrocyte primary cell cultures isolated from WT mouse pups (P1-P5), with each letter representing a separate mouse (n = 3). Several AIDA-1 splice variants (immunoreactive bands) are observed in oligodendrocytes and at higher levels compared to neurons. 10 µg of total protein lysate was loaded. No expression was observed in astrocytes. Tub: tubulin.
Fig. 5
Fig. 5. Generation and characterization of Anks1b Olig2-Cre transgenic mice.
a Anks1b Olig2-Het and Olig2-KO mice were generated by crossing Olig2-Cre mice with Anks1b floxed mice. Olig2 transgenics were smaller and lighter than WT littermate controls (body weight n = 49 WT, 74 Olig2-Het, 14 Olig2-KO; body length n = 28 WT, 45 Olig2-Het, 7 Olig2-KO); Two-way ANOVA with Sidak’s posthoc corrections. (Weight- Male: WT vs Het, p = 0.0126; WT vs KO, p = 0.0014; Female: WT vs Het, p = 0.0379; WT vs KO, p = 0.0006. Length- Male: WT vs KO, p = 0.0321; Female: WT vs Het, p = 0.016). b Olig2-Cre transgenic mice were crossed to GFP Cre-reporters (Rosa26-GFP), and (upper) brain tissues were clarified using CUBIC and imaged by light sheet microscopy. Scale bar = 5 mm. (Lower) GFP-expressing cells were morphologically consistent with oligodendrocytes; scale bar = 20 μm. c Immunocytochemistry performed on CUBIC clarified brains shows that GFP-labeled cells are enriched in corpus callosum and colocalize with MBP, confirming correct targeting of Cre recombinase to oligodendrocytes; scale bar = 100 μm. d Quantitation of oligodendrocytes (GFP+ cells) in corpus callosum from acute coronal slices. As in Anks1b Nestin-Het mice, we found significantly fewer oligodendrocytes in Anks1b Olig2-Het and Olig2-KO mice (n = 8 WT, 6 Het, 4 KO, 8-10 slices from each mouse); One-way ANOVA with Sidak’s posthoc corrections. e Western blots of whole brain lysates from mice with indicated genotypes and for markers of oligodendrocytes (Olig2 and Sox10) and MBP. Each lane of the Western blot represents a different mouse. f Results show decreased expression of oligodendrocytes markers and MBP expression, recapitulating results observed in Nestin-Het mice. (n = 4 mice per genotype). Mice expressing Olig2-Cre but not the floxed Anks1b allele (WT Olig2-Cre), had similar Olig2, MBP, and Sox10 expression compared to mice expressing the floxed allele alone (WT no-Cre); One-way ANOVA with Sidak’s posthoc corrections. g Representative TEM images of callosal cross-sections from WT and Olig2-Het mice; scale bar = 1 µm. h G-ratio quantitation binned across the indicated axonal diameters shows significant myelination deficits in axons 0.67–1.7 µm in diameter (n = 3 WT, 3 Olig2-Het mice). Box plots show the 25th–75th quantiles (box), mean (red line), and whiskers delineate 3 standard deviations from the mean; T-tests, two-sided, p = 0.0206. i Western blots showing AIDA-1 expression in primary cell cultures isolated from WT (n = 3) and Olig2-Het pups (n = 3) (P1-P5). Significant decreases in AIDA-1 expression are seen in oligodendrocytes, but not neuronal cultures. Each lane of the Western blot represents a different mouse. j Quantitation of protein expression from (i) normalized to WT and tubulin (Tub). (n = 3 WT, 3 Olig2-Het mice).T-tests; two-tailed. a, d, f, j Error bars reflect mean ± s.e.m. a, d, f, h, j ***, ****p < 0.0005, p < 0.00005. Source data for a, d, f, h, and j are provided as a Source Data file.
Fig. 6
Fig. 6. Deficits in Rac1 activity underlie abnormal oligodendrocyte function.
a Western blots of lysates from oligodendrocyte monocultures obtained from WT and Olig2-Het mice (n = 3 mice per genotype, 2 technical replicates) show reduced MBP expression; T-test, two-sided. p = 0.00931. Primary rat oligodendrocyte culture (b) (lysates; NT: n = 6 independent cultures, 10 lanes; sh#1: n = 4 independent cultures, 8 lanes; sh#2: n = 3 independent cultures, 6 lanes: One-way ANOVA, NT vs sh#1, p = 0.0041) and (c) imaging (n = 4 independent cultures for each group; NT1 (164), sh#1 (389), NT2 (238), sh#2 (1167) cells) likewise show reduced MBP expression after knockdown of AIDA-1 with both shRNA viruses (sh#1 and sh#2) compared to non-targeting control virus (NT). One-way ANOVA with Dunnett’s posthoc corrections; scale bar = 20 μm. NT vs sh#1: p = <0.0001, NT vs sh#2: p = 0.0041. a Normalized to tubulin (Tub) and (ac) to WT/NT as appropriate. d A network map generated by StringDB showing the subset of proteins from the interactome data associated with small GTPases. e A sample of the cross-referenced interactome data with the previously published synaptic proteomics. Proteins that scored >|10%| fold-change over control in both the interactome and the proteomics were selected (Full list in Supplementary Data 2) were selected as strong functional links. f An analysis of protein domains found in this subset of proteins, shows that these were overwhelmingly associated with small GTPase function. Gene ontology (GO) terms of this protein subset indicated links to myelin and oligodendrocyte related functions. FDR: False Discovery Rate. g Schematic of the Rac1 (FRET: Fluorescence Resonance Energy Transfer)-based biosensor. PBD: p21-binding domain of Pak1. h Representative mouse cells expressing the G-protein biosensor and imaged for FRET. Scale bar = 50 μm. i (Left) Plot showing the Rac1 activity observed for WT and Olig2-Het cells, represented by the CFP to FRET ratio over time, with x-axis min 0-12 representing post stimulation imaging. (Right) bar graphs showing minutes 7-12 grouped together. n = 50 WT and 90 Het cells from 12 mice (5 WT and 7 Het mice); T-test, two-sided. CFP: Cerulean Fluorescence Protein. j Representative image of WT and Olig2-Het oligodendrocyte monocultures immunostained for MBP and the mature oligodendrocyte marker CNP. Scale bar = 20 μm. k (Left) Rac1 stimulation restores MBP expression to above-WT levels in CNP-positive oligodendrocytes and (right) had no effect on WT cells; T-test; two-sided; n = 4 independent cultures for each group; WT (1268), Het (147), WT+Rac (349), Het+Rac (452) cells. WT vs Het: p = 0.000064, Het vs Het+RAC: p = 4e−7. MBP: myelin basic protein, CNP: 2’,3’-cyclic nucleotide 3’-phosphodiesterase. ac, i, k Error bars reflect mean ± s.e.m. *, **, ***, ****p < 0.05, <0.005, <0.0005, <0.00005. Source data for ac, i, and k are provided as a Source Data file.
Fig. 7
Fig. 7. Mice with oligodendrocyte specific Anks1b deletion display behavioral deficits associated with ASD.
a Neither Olig2-Het nor Olig2-KO mice show learning deficits in the object placement test, a hippocampus-dependent memory assay. All 3 groups averaged above a passing score (>50% preference for new location) using a 40-minute retention interval. b Olig2-Het and Olig2-KO mice showed a robust reduction in avoidance behaviors compared to WT controls, spending more time in the open arms as a percentage of total time in open and closed arms of an elevated plus maze (but see Supplementary Fig. 8d). One-way ANOVA. c Peak magnitude of the acoustic startle reflex is robustly increased in Olig2-Het and Olig2-KO mice at 100db and 115db. (*p = 0.0334, **p = 0.00281). d In the three-chamber test, (left) Olig2-Het and Olig2-KO mice show significantly reduced and borderline preference for a conspecific mouse over an inanimate object (One-way ANOVA, Dunnett’s post hoc, WT vs Het: p = 0.0174; WT vs KO: p = 0.0077. This reduction in social preference was not observed in mice with Anks1b deletion from (middle) cerebellar Purkinje cells (L7-Het and L7-KO) or (right) forebrain specific excitatory neurons (Camk2a-KO). Dotted green line indicates 50% preference. ac Box plots show 25th–75th quantiles (box), median (black line), 95% confidence intervals (diamond), and range (black whiskers). Bar graphs in d show mean ± s.e.m. with all data points shown. For Anks1b Olig2-Het and Olig2-KO experiments, n = 53 WT, 82 Het, 15 KO (two measurements made for object placement). For L7-Het and L7-KO experiments, n = 38 WT, 44 Het, 7 KO. For Anks1b Camk2a-KO experiments, n = 23 WT, 27 KO. No significant sex differences were observed in any behaviors evaluated. If 2-way ANOVA showed significant main effect of genotype, post hoc 2-sided Student’s t test was performed, *, **, ***p < 0.05, <0.005, <0.0005. All significant results show high power (b > 0.85). For social preference test in Olig2-Het and Olig2-KO statistical power b > 0.95. Source data for all panels are provided as a Source Data file.
Fig. 8
Fig. 8. Clemastine rescues deficits in social preference in Anks1b Olig2-Het mice.
a Representative image of WT and Olig2-Het oligodendrocyte monocultures (3 independent replicates) immunostained for MBP and the mature oligodendrocyte marker CNP. Scale bar = 20 μm. b Clemastine rescues deficits in MBP expression in CNP-positive primary oligodendrocytes cultured from Olig2-Het mice, but reduced expression in cells from WT mice; Two-way ANOVA with Sidak’s multiple comparison; n = 4 independent cultures per group; WT (1268), Het(147), WT+Clem(776), Het+Clem(373) cells. Error bars reflect mean ± s.e.m. WT+Clem vs Het+Clem: p = 4e−7, Het vs Het+Clem: p = 4e−7. c Protocol for daily clemastine fumarate IP injections for 2 weeks. Mice were allowed to recover for 7 days before behavioral testing. Scale bar = 20 μm. d Total track length and activity as measured as time moving as a % of total time, showing that clemastine treatment had no overall effect on locomotion. Box plots show the 25th–75th quantiles (box), median (black line), 95% confidence intervals (black diamond), and range (black whiskers). n = 39 mice. e Paired results show Olig2-Het mice performance in three-chamber social preference test before and after clemastine treatment. n = 18 mice. Paired T-tests. p = 0.00169. f Paired results from Olig2-Het mice treated with vehicle. n = 7 mice. Paired T-tests. e, f Red circles represent mean performance for each population and reference line indicates 50% preference. g Paired results from WT mice treated with clemastine or vehicle. (n = 5 mice (WT + Veh), n = 9 mice (WT + Clem); Paired T-tests, two-sided. h Representative TEM images of callosal cross-sections from Olig2-Het mice that were treated with either clemastine or vehicle; scale bar = 1 µm. i G-ratio quantitation binned across the indicated axonal diameters shows significant myelination deficits in axons 0.1–0.29 and 0.41–1.7 µm in diameter. Results are from 6 animals (3 per treatment condition). Box plots show the 25th–75th quantiles (box), mean (red line), and whiskers delineate 3 standard deviations from the mean: T-tests, two-sided. (b, eg, i) *, ***, ****p < 0.05, <0.005, <0.0005, <0.00005. Source data for b, dg, and i are provided as a Source Data file.

References

    1. Anney R, et al. Individual common variants exert weak effects on the risk for autism spectrum disorders. Hum. Mol. Genet. 2012;21:4781–92. doi: 10.1093/hmg/dds301. - DOI - PMC - PubMed
    1. Barrett T, et al. NCBI GEO: archive for functional genomics data sets–update. Nucleic Acids Res. 2013;41:D991–5. doi: 10.1093/nar/gks1193. - DOI - PMC - PubMed
    1. Carbonell AU, et al. Haploinsufficiency in the ANKS1B gene encoding AIDA-1 leads to a neurodevelopmental syndrome. Nat. Commun. 2019;10:3529. doi: 10.1038/s41467-019-11437-w. - DOI - PMC - PubMed
    1. Jordan BA, et al. Identification and verification of novel rodent postsynaptic density proteins. Mol. Cell Proteomics. 2004;3:857–71. doi: 10.1074/mcp.M400045-MCP200. - DOI - PubMed
    1. Lowenthal MS, Markey SP, Dosemeci A. Quantitative mass spectrometry measurements reveal stoichiometry of principal postsynaptic density proteins. J. Proteome Res. 2015;14:2528–38. doi: 10.1021/acs.jproteome.5b00109. - DOI - PMC - PubMed

Publication types

Substances