. 2023 Dec 21;14(1):8497.
doi: 10.1038/s41467-023-43940-6.

The Mycobacterium tuberculosis methyltransferase Rv2067c manipulates host epigenetic programming to promote its own survival

Affiliations

The Mycobacterium tuberculosis methyltransferase Rv2067c manipulates host epigenetic programming to promote its own survival

Prakruti R Singh et al. Nat Commun. .

Abstract

Mycobacterium tuberculosis has evolved several mechanisms to counter host defense arsenals for its proliferation. Here we report that M. tuberculosis employs a multi-pronged approach to modify host epigenetic machinery for its survival. It secretes methyltransferase (MTase) Rv2067c into macrophages, trimethylating histone H3K79 in a non-nucleosomal context. Rv2067c downregulates host MTase DOT1L, decreasing DOT1L-mediated nucleosomally added H3K79me3 mark on pro-inflammatory response genes. Consequent inhibition of caspase-8-dependent apoptosis and enhancement of RIPK3-mediated necrosis results in increased pathogenesis. In parallel, Rv2067c enhances the expression of SESTRIN3, NLRC3, and TMTC1, enabling the pathogen to overcome host inflammatory and oxidative responses. We provide the structural basis for differential methylation of H3K79 by Rv2067c and DOT1L. The structures of Rv2067c and DOT1L explain how their action on H3K79 is spatially and temporally separated, enabling Rv2067c to effectively intercept the host epigenetic circuit and downstream signaling.


Conflict of interest statement

The authors declare no competing interests.

Figures

Fig. 1
Fig. 1. Rv2067c in vitro methylates histone H3 at lysine 79.
a Autoradiograph of methylation by Rv2067c with two different concentrations of histones salt extracted from THP-1 monocytes as substrate and tritiated S-Adenosyl-L-methionine (3H-SAM) as a methyl group donor (Lane 1 and 2). BSA (lane 3) was kept as negative control. Lower panel shows ponceau staining (n = 2 independent experiments). b, c Bar graph and autoradiograph showing methyltransferase (MTase) activity of Rv2067c against recombinant H3, H2A, H2B and H4 as substrate and tritiated SAM as methyl group donor. Recombinant Rv2067c was kept as negative control for scintillation counts and ponceau staining shows the loading of histones for autoradiograph. (n = 2 independent experiments; p = 0.002). d MS/MS spectra of H3K79 trimethylation performed by Rv2067c on recombinant H3. The table shows peptide EIAQDFK^TDLR is trimethylated (^ represents trimethylation) when the assay was performed with H3 and Rv2067c. H3 alone serves as control (n = 1). e Blots probed with H3K79me3 and H3K4me3 antibodies respectively depict MTase assays with synthetic H3 peptide 73–83 aa and 1–8 aa (negative control) as substrates, Rv2067c as MTase and non-radioactive SAM as methyl donor. f Scintillation counts for Rv2067c MTase activity with recombinant H3 and H3A79 mutant as substrate (n = 3 independent experiments; p = 0.002, 0.003). g Graph shows MTase assays with Rv2067c and its SAM-binding mutant (GxG to RxR; “Methods”) using recombinant H3 as substrate (n = 3 independent experiments; p = 0.006, 0.008). h Comparison of MTase activity of Rv2067c and DOT1L. Rv2067c methylates free H3, whereas DOT1L methylates H3 in nucleosomal core particle (NCP). Recombinant H3, reconstituted octamers and NCPs were kept as controls; Rv2067c and DOT1L were kept as control to check auto-methylation (p = 0.006, 0.0005). The data for MTase assays is plotted as mean. Error bars correspond to SD and P-value was calculated using unpaired two-tailed Student’s t-test. **, P-value < 0.01, ***, P-value < 0.001.
Fig. 2
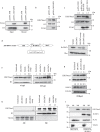
Fig. 2. Rv2067c methylates histone H3 at lysine 79 upon infection in THP-1 macrophages.
a Western blot showing interaction between Rv2067c and H3. Pulldown with streptavidin beads on lysates of HEK293T transfected with pcDNA: Rv2067cSFB and pcDNA SFB (control). 5% of whole cell lysate was kept as Input. Blot was probed with FLAG and H3 antibodies. SFB stands for S-protein, FLAG, streptavidin-binding peptide. b, c H3K79me3 mark in cell lysates of HEK293T transfected with pcDNA: Rv2067cSFB and pcDNA SFB (b); pcDNA: Rv2067cRxR-SFB (lane 2) (c). Blots were probed with H3K79me3, stripped, and probed with H3 antibody used as loading control. FLAG indicates expression of Rv2067c. d Schematic of the strategy for the generation of from Rv2067c gene knockout. From +53 bp to +1180 bp of was deleted Rv2067c and replaced with hygromycin resistance cassette (LoxP-GFP:hyg-LoxP). e Immunoblot shows levels of Rv2067c in the lysates of WtMtb (lane 1), ΔRv2067c (lane 2), ΔRv2067c:comp (lane 3) and ΔRv2067c:RxR (lane 4). Blot was probed with Rv2067c and Rho (control) antibodies. f H3K79me3 mark in THP-1 cell lysates 4 and 24 h.p.i with various Mtb strains. Lane 1: uninfected THP-1 macrophages; Lane 2, 3 and 4: THP-1 macrophages infected with ΔRv2067c, WtMtb and ΔRv2067c:comp strains respectively for each time point. H3 was used as loading control. g H3K79me3 mark (upper panel) and DOT1L levels (lower panel) in THP-1 infected with ΔRv2067c:RxR (lane 3). H3 and β-Actin were used as loading control, respectively. h H3K79me3 mark in subcellular fractions of uninfected THP-1 and macrophages infected with ΔRv2067c, WtMtb And ΔRv2067c:comp strains respectively, 24 h.p.i. Tubulin and H3 were used as control for cytosolic and nuclear extracts, respectively. NE nuclear extract, CE cytosolic extract. i Immunoblots show detection of H3K79me3 mark in cytosolic and nuclear extracts of HEK293T expressing Rv2067c and FLAG-tagged H3(H3-FL). HEK293T cells expressing HEK:H3-FL were kept as control. Blots were probed with FLAG and Rv2067c antibodies to show expression of H3 and Rv2067c, respectively. Tubulin was used as control for cytosolic fraction. eh Comp stands for complemented. Values above the blot represent quantitation (arbitrary units). For immunoblots, n = 2 independent experiments. Source data are provided as a Source Data file.
Fig. 3
Fig. 3. Structure of Rv2067c and its comparison to DOT1L.
a Crystal structure of Rv2067c. The asymmetric unit contains two molecules of Rv2067c related by two-fold symmetry and the two-fold axis is perpendicular to the page, shown as biconvex sign (maroon). b, c Each monomer is composed of catalytic domain (CD), dimerization domain (DD, composed of large subdomain, LSD and small subdomain, SSD) and C-terminal domain (CTD). Dimer is formed by cross-subdomain interactions between the DDs. SAH is depicted as spheres. a, b The broken lines represent the missing electron density (disordered regions). The substrate-binding troughs are indicated with arrowheads (yellow). d Schematic of domain organization in Rv2067c (top) and DOT1L (bottom). e Crystal structure of DOT1L (PDB: 1NW3). Residues 5–332 are structured (DOT1L3D). The DOT1L3D contains an N-terminal portion and a catalytic core. SAM is depicted as spheres. f Full length human DOT1L (1537 aa) structure model (AlphaFold2 model, AF-Q8TEK3-F1). The structured part of the catalytic domain (DOT1L3D) is rendered as surface and the remaining region as cartoon, which is disordered with interspersed α-helices (CC0–CC3) that form coiled-coil (CC) structures with the interacting partners. The model is colored according to the AlphaFold2 prediction confidence. The low confidence score indicates intrinsic disorder. The N- and C-termini are labeled as N and C, respectively. SAH S-adenosyl-L-homocysteine, SAM S-adenosyl-L-methionine. Scale bars 10 Å.
Fig. 4
Fig. 4. Comparison of active sites between Rv2067c and DOT1L.
a The complex between ubiquitinated nucleosome (UbNuc) and DOT1Lcat (middle panel). The substrate lysine (nucleosomal H3K79) binds in a narrow tunnel (cross sections across SAM, left and right panels). The length of the tunnel is about the length of the lysine side chain in its extended rotamer. b Cross sections (left and right panels) of substrate-binding trough of Rv2067c as depicted by planes passing through Rv2067c dimer (middle panel). The active site (broken circle) lies deep inside (right panel) and at one end (left panel) of the trough, and encompassed by catalytic domain and LSD. The active site, region opposite to methyl group of SAM is occluded and leaves no room for substrate lysine binding. a, b The radius 6.3 Å of the circle is equal to the length of lysine side chain in its extended rotamer. The substrate lysine must reach the encircled region to undergo methylation. c Non-accessibility of Rv2067c active site by nucleosomal H3K79 is shown by a hypothetical reaction complex model of nucleosome-Rv2067c and rotation scan. The total number of clashing atoms (TCA) for each pose is shown as a function of elemental rotation angles (α, β and γ) (left panel). Each subplot corresponds to the value of either α or β or γ at minimum TCA value (i.e., 211). The pose between Rv2067c and nucleosome reaction complex with minimum TCA (right panel). In this pose, nucleosomal H3K79 accesses the reaction center of Rv2067c via the SAM entry site. SAM: S-adenosyl-L-methionine, LSD: Large subdomain of dimerization domain, SSD: Small subdomain of dimerization domain, CTD: C-terminal domain. Scale bars 10 Å. The Source Data and plotting script for TCA plot are available at 10.5281/zenodo.8352903 and https://github.com/Venkat-Dadi/Rotation_Scan.
Fig. 5
Fig. 5. Rv2067c active site dynamics.
Volumetric density map of Rv2067c substrate-binding trough calculated using POVME 3.0 for a crystal structure (monomer A) and molecular dynamics (MD) trajectory. a In the crystal structure, the active site is occluded (broken circle). b During 100 ns MD simulations, the active site was widened to accommodate substrate lysine (broken circle). The volumetric density map is shown as an isosurface (maroon) at 0.1 contour level. c The widened active site (marked with a double-headed yellow arrow) as compared to the occluded active site seen in the crystal structure (Fig. 4b) for a simulation snapshot is shown. SAM S-adenosyl-L-methionine. Scale bars 10 Å.
Fig. 6
Fig. 6. Rv2067c-H3 peptide complex model.
Rv2067c-H3 peptide complex model (middle panel) depicting H3 peptide (73-EIAQDFKTDLR-83) binding in the substrate-binding trough. The H3 peptide was modeled in two binding modes along the trough, i.e., from N- to C-terminal (left panel) or from C- to N- terminal (right panel) with respect to the active site (broken white circle). In both modes, H3K79 can access the SAM methyl group in a similar fashion seen in MTase-substrate complexes (Supplementary Fig. 9a–h). SAM S-adenosyl-L-methionine. Scale bars 10 Å. The coordinates for the Rv2067c-H3 peptide model are available as Supplementary Data 4.
Fig. 7
Fig. 7. Rv2067c modulates DOT1L expression.
a Immunoblot depicts DOT1L levels in THP-1 cell lysates 4 and 24 h.p.i with various Mtb strains. Lane 1: uninfected THP-1; Lane 2, 3 and 4: THP-1 infected with ΔRv2067c, WtMtb and ΔRv2067c:comp strains, respectively, for each time point. β-Actin was used as loading control. Values above the blot represent quantitation (arbitrary units). b Relative expression of DOT1L in THP-1 4 (dark gray bars) and 24 (light gray bars) h.p.i with ΔRv2067c, WtMtb and ΔRv2067c:comp normalized with respect to uninfected THP-1. Levels were normalized against GAPDH. n = 2 independent infections; p = 0.02, 0.04. Data is plotted as mean and error bars represent SD. P-values depicted on the graphs were calculated using unpaired two-tailed Student’s t-test; *P-value < 0.05. Comp stands for complemented c H3K79me3 mark in cell lysates of HEK293T with the following treatment: Lane 1: scramble shRNA (control); Lane 2: DOT1L inhibition by shRNA and Lane 3: DOT1L inhibition by shRNA along with expression of Rv2067c. H3 was used as loading control. Values above the blot represent quantitation (arbitrary units). d Graph depicts inhibition of DOT1L with small molecule inhibitor EPZ004777 which does not inhibit Rv2067c. Filled circles and squares represent scintillation counts for DOT1L and Rv2067c with EPZ004777 inhibitor at indicated concentrations. Each data point represents the mean of three replicates at each specified concentration of the compound, and the error bars represent SD. e Immunoblot analysis of H3K79me3 mark in uninfected THP-1 (left panel), inhibitor-treated THP-1 infected with M.smeg:FLAG (middle panel) and M.smeg:Rv2067c-FLAG (last panel) at indicated concentrations. H3 was kept as loading control. Source data are provided as a Source Data file.
Fig. 8
Fig. 8. Downstream events consequent to H3K79 methylation by Rv2067c.
a Fold enrichment of H3K79me3 at specific loci (as indicated) added by Rv2067c in THP-1 infected with ΔRv2067c (dark gray), WtMtb (light gray) and ΔRv2067c:comp (checker). Data is shown as fold enrichment over IgG control. b Relative expression of TMTC1, NLRC3 and SESTRIN3 in THP-1 infected with ΔRv2067c (dark gray), WtMtb (light gray) and ΔRv2067c:comp (checker) with respect to uninfected THP-1 macrophages. Ct values were normalized against GAPDH. c Graph shows relative expression of indicated cytokines in THP-1 infected with ΔRv2067c (dark gray), WtMtb (light gray) and ΔRv2067c:comp (checker). Ct values were normalized against GAPDH. d Fold enrichment of H3K79me3 mark at the promoter region of IL-6 and TNF-α in THP-1 infected with ΔRv2067c (dark gray), WtMtb (light gray) and ΔRv2067c:comp (checker). Data is shown as fold enrichment over IgG control. ad For all ChIP and qRT-PCR, n = 2 independent infections. Data is plotted as mean and error bars represent SD. P-values depicted on the graphs were calculated using unpaired two-tailed Student’s t-test. e, f Immunoblots depict levels of caspase-8, necrotic, pro- and anti-apoptotic markers as indicated in THP-1 cell lysates infected with various Mtb strains. Lane 1: uninfected THP-1; Lane 2, 3 and 4: THP-1 infected with ΔRv2067c, WtMtb and ΔRv2067c:comp strains, respectively. β-Actin was used as loading control for TNF- α and caspase-8 and H3 as loading control for RIPK1, FADD and RIPK3 (e). H3 was used as loading control (f). Values above the blot represent quantitation (arbitrary units). g Graph depicts the percentage of apoptotic and necrotic macrophages analyzed by flow cytometry upon infection with ΔRv2067c (dark gray), WtMtb (light gray) and ΔRv2067c:comp (checker) n = 2 independent infections. Data is plotted as mean and error bars represent SD. P-values depicted on the graphs were calculated using unpaired two-tailed Student’s t-test. Source data are provided as a Source Data file.
Fig. 9
Fig. 9. Rv2067c gives survival advantage to Mtb.
a Survival of intracellular bacilli post 24 and 48 h of infection in THP-1 with ΔRv2067c (filled triangle), WtMtb (open circle), ΔRv2067c:RXR (open triangle) and ΔRv2067c:comp (filled square). n = 3 independent infections. Three technical replicates were kept during each infection. b Bacillary burden in lungs of mice infected with ΔRv2067c (filled triangle), WtMtb (open circle) and ΔRv2067c:comp (filled square), 4- and 8-week p.i (n = 6 animals per group per time point, two technical replicates for plating were kept). a, b Data is plotted as mean and error bars represent SD. P-values depicted on the graphs were calculated using unpaired two-tailed Student’s t-test. c Gross pathology of the lungs of BALB/c mice infected with ΔRv2067c, WtMtb and ΔRv2067c:comp harvested 8 weeks after infection. d Haematoxylin and eosin–stained mouse lung sections 8 weeks p.i with ΔRv2067c, WtMtb and ΔRv2067c:comp.The pathology sections show granuloma (G), alveolar space (AS), Alveolar consolidation (AC) and bronchial lumen (B). All images were taken at 4X magnification and scale bars = 50 μm. e Graph depicts granuloma score of lung sections of mice infected with ΔRv2067c, WtMtb and ΔRv2067c:comp, 8 weeks p.i. (n = 5 animals). The error bars represent SD. Source data are provided as a Source Data file.
Fig. 10
Fig. 10. Multi-pronged mechanism of Rv2067c induces necrosis in macrophages to enhance Mtb’s survival.
Mtb secretes MTase Rv2067c into the host macrophages, which trimethylates free H3 at lysine 79. Rv2067c mediated H3K79me3 mark enhances the expression of genes such as NLRC3, SESTRIN3 and TMTC1, enabling the bacteria to counter the host defense. Rv2067c also steers the cell toward RIPK3-mediated necrosis by downregulating DOT1L to impact the expression of pro-inflammatory cytokines such as TNF-α and IL-6. A concomitant upregulation of anti-apoptotic markers is observed. Green and red arrows show upregulation and downregulation of genes, respectively.

References

    1. Bierne H, Hamon M, Cossart P. Epigenetics and bacterial infections. Cold Spring Harb. Perspect. Med. 2012;2:a010272. doi: 10.1101/cshperspect.a010272. - DOI - PMC - PubMed
    1. Silmon de Monerri NC, Kim K. Pathogens hijack the epigenome: a new twist on host-pathogen interactions. Am. J. Pathol. 2014;184:897–911. doi: 10.1016/j.ajpath.2013.12.022. - DOI - PMC - PubMed
    1. MacMicking J, Xie QW, Nathan C. Nitric oxide and macrophage function. Annu. Rev. Immunol. 2003;15:323–350. doi: 10.1146/annurev.immunol.15.1.323. - DOI - PubMed
    1. Jenner RG, Young RA. Insights into host responses against pathogens from transcriptional profiling. Nat. Rev. Microbiol. 2005;3:281–294. doi: 10.1038/nrmicro1126. - DOI - PubMed
    1. Jaenisch R, Bird A. Epigenetic regulation of gene expression: how the genome integrates intrinsic and environmental signals. Nat. Genet. 2003;33:245–254. doi: 10.1038/ng1089. - DOI - PubMed

Publication types

MeSH terms