. 2023 Dec 20;13(1):22806.
doi: 10.1038/s41598-023-48173-7.

Prognostic utility and characterization of left ventricular hypertrophy using global thickness

Affiliations

Prognostic utility and characterization of left ventricular hypertrophy using global thickness

Magnus Lundin et al. Sci Rep. .

Abstract

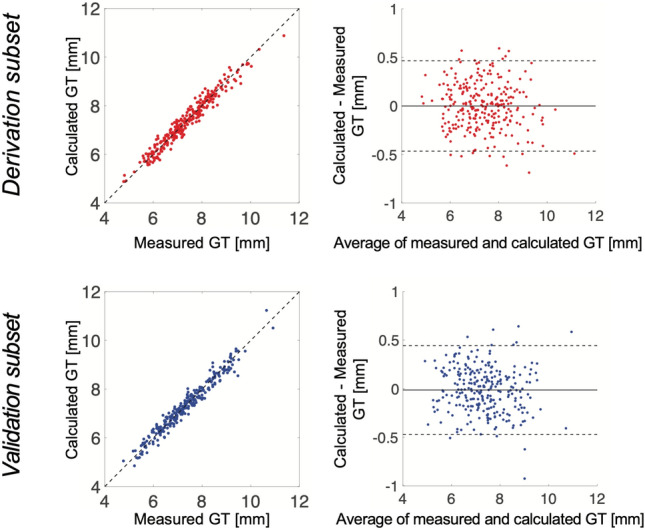
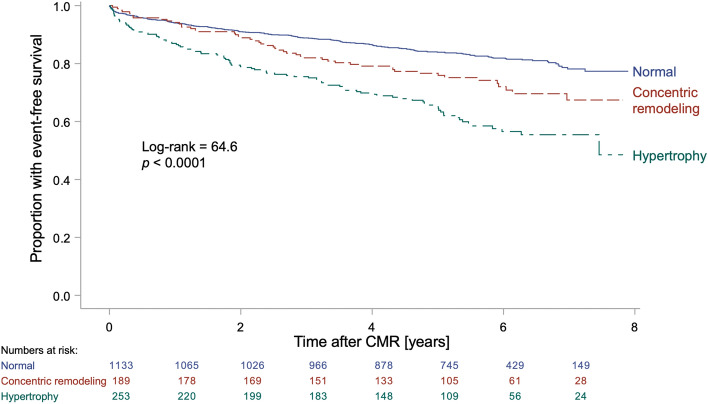
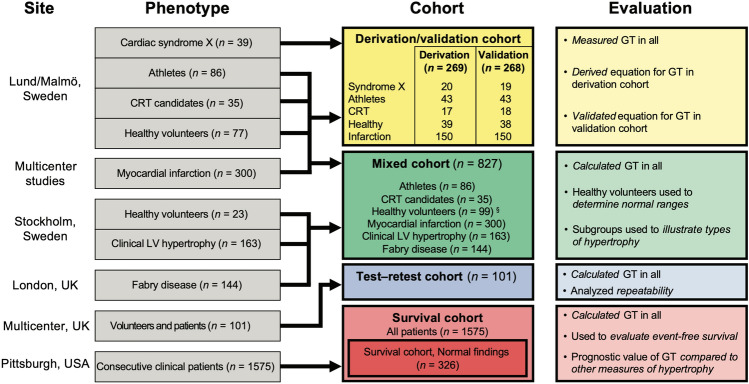
Cardiovascular magnetic resonance (CMR) can accurately measure left ventricular (LV) mass, and several measures related to LV wall thickness exist. We hypothesized that prognosis can be used to select an optimal measure of wall thickness for characterizing LV hypertrophy. Subjects having undergone CMR were studied (cardiac patients, n = 2543; healthy volunteers, n = 100). A new measure, global wall thickness (GT, GTI if indexed to body surface area) was accurately calculated from LV mass and end-diastolic volume. Among patients with follow-up (n = 1575, median follow-up 5.4 years), the most predictive measure of death or hospitalization for heart failure was LV mass index (LVMI) (hazard ratio (HR)[95% confidence interval] 1.16[1.12-1.20], p < 0.001), followed by GTI (HR 1.14[1.09-1.19], p < 0.001). Among patients with normal findings (n = 326, median follow-up 5.8 years), the most predictive measure was GT (HR 1.62[1.35-1.94], p < 0.001). GT and LVMI could characterize patients as having a normal LV mass and wall thickness, concentric remodeling, concentric hypertrophy, or eccentric hypertrophy, and the three abnormal groups had worse prognosis than the normal group (p < 0.05 for all). LV mass is highly prognostic when mass is elevated, but GT is easily and accurately calculated, and adds value and discrimination amongst those with normal LV mass (early disease).


Conflict of interest statement

ML, JN, RT, EM, KC, AS, PS, and MU are affiliated with Karolinska University Hospital which has a research agreement with Siemens regarding cardiovascular magnetic resonance imaging. EH is the founder of Medviso AB (Lund, Sweden), manufacturer of medical image analysis software. MC and HE have received consultancy fees from Imacor AB (Lund, Sweden) for cardiac MRI analysis. RB has been a speaker consultant for Medtronic (Dublin, Ireland) and for Abbott (Lake Bluff, Illinois, USA), and is on the advisory board for Pfizer (New York, New York, USA). JN has been a speaker for Orion Pharma (Esbo, Finland). HA is a stockholder in Imacor AB (Lund, Sweden). The remaining authors declare no competing interests.

Figures

Figure 1
Figure 1
Plots of the calculated vs. measured global wall thickness (GT) in mm. GT was measured using the method illustrated in Fig. 7, and was estimated using the derived Eq. (1). Top left: Correlation plot for the derivation subset (n = 269), R2 = 0.95, bias 0.00 ± 0.24 mm, identity line shown dashed. Top right: Bland–Altman plot for the derivation subset of the cohort. Solid line shows mean difference and dashed lines show ± 1.96 standard deviations. Bottom left: Correlation plot for the separate validation subset (n = 268), R2 = 0.95, p < 0.001, bias 0.01 ± 0.23 mm, identity line shown dashed. Bottom right: Bland–Altman plot for the validation subset of the cohort. Solid line shows mean difference and dashed lines show ± 1.96 standard deviations. GT global wall thickness.
Figure 2
Figure 2
Proposed flow chart for characterizing different types of LV hypertrophy and remodeling. The bottom of the image includes a schematic illustration of a typical LV short axis slice for each classification outcome. BSA body surface area, GT global wall thickness, LV left ventricular, LVMI LV mass indexed to BSA.
Figure 3
Figure 3
Kaplan–Meier curves for the survival cohort. Kaplan–Meier curves for the consecutive clinical patients of the survival cohort (n = 1575, follow-up 5.4 [3.9–6.4] years) classified as having either hypertrophy (increased LVMI regardless of GT as a combined group); concentric remodeling (normal LVMI, increased GT); or being classified as normal (normal LVMI, normal GT). Event-free survival was defined as absence of the combined endpoint of death or hospitalization for heart failure. The patients with hypertrophy had worse prognosis compared to both the concentric remodeling (p = 0.003) and the normal group (p < 0.0001). Patients with concentric remodeling had worse prognosis compared to the normal group (p = 0.004). An increase in LVMI or GT was based on the 95% upper limit of normal calculated from the healthy volunteers for females and males respectively. CMR cardiovascular magnetic resonance, GT global wall thickness, LVMI left ventricular mass indexed to body surface area.
Figure 4
Figure 4
Characterization of left ventricular hypertrophy using wall thickness and mass. Global wall thickness (GT) plotted versus left ventricular mass index (LVMI) for the mixed cohort, who were not used in the prognostic analysis. The solid circles show the median and the whiskers show the interquartile range. Both GT and LVMI have been standardized to standard deviations (SD) from the sex-specific mean of the healthy volunteers. The colored fields show the proposed classification of hypertrophy based on LVMI and GT. The gray dashed lines indicate the upper limit of normal (+ 1.96 SD) for both GT and LVMI. The mixed cohort consists of healthy volunteers, endurance athletes, cardiac resynchronization therapy (CRT) candidates, patients with recent acute ST-elevation myocardial infarction (Infarction), patients with Fabry disease (Fabry), and patients with at least moderate left ventricular hypertrophy (LVH). Four examples of the proposed classification of hypertrophy are shown in the four corners. CRT cardiac resynchronization therapy, GT global wall thickness, LVH left ventricular hypertrophy, LVMI left ventricular mass index, SD standard deviations.
Figure 5
Figure 5
Schematic summary of the composition of the respective cohorts and what they were used to evaluate. CRT cardiac resynchronization therapy, GT global wall thickness, LV left ventricular. §One of the healthy volunteers was an outlier and was excluded, see “Methods”.
Figure 6
Figure 6
An example of a LV short axis image stack. A stack of nine short-axis cine slices (from base to apex) of the heart in end-diastole where the LV borders are outlined in green for the epicardium and red for the endocardium. The space between the epicardium and endocardium corresponds to the myocardial volume from which LV mass i calculated by multiplying the volume with the density. LV left ventricular.
Figure 7
Figure 7
Schematic illustration of how mean left ventricular (LV) end-diastolic global wall thickness (GT) was measured using a LV short-axis image stack. The distance between the endocardial and epicardial borders at end-diastole was measured at 24 evenly distributed positions (shown as dashed black lines) around the circumference of all short-axis slices of a full LV short-axis stack from base to apex. Basal sections with a wall thickness of less than 2 mm in the LV outflow tract and the apex were excluded. The mean thicknesses for each individual short-axis slice was multiplied by the midmural circumference of that slice (pink circle), these were summed and then divided by the sum of the midmural circumference for all slices to yield the GT. GT global wall thickness, LV left ventricular.

References

    1. Levy D, Garrison RJ, Savage DD, Kannel WB, Castelli WP. Prognostic implications of echocardiographically determined left ventricular mass in the Framingham Heart Study. N. Engl. J. Med. 1990;322:1561–1566. doi: 10.1056/NEJM199005313222203. - DOI - PubMed
    1. Gupta S, et al. Left ventricular hypertrophy, aortic wall thickness, and lifetime predicted risk of cardiovascular disease: The Dallas heart study. JACC Cardiovasc. Imaging. 2010;3:605–613. doi: 10.1016/j.jcmg.2010.03.005. - DOI - PubMed
    1. Verdecchia P, et al. Adverse prognostic significance of concentric remodeling of the left ventricle in hypertensive patients with normal left ventricular mass. J. Am. Coll. Cardiol. 1995;25:871–878. doi: 10.1016/0735-1097(94)00424-O. - DOI - PubMed
    1. Ganau A, et al. Patterns of left ventricular hypertrophy and geometric remodeling in essential hypertension. J. Am. Coll. Cardiol. 1992;19:1550–1558. doi: 10.1016/0735-1097(92)90617-V. - DOI - PubMed
    1. Caputo GR, Tscholakoff D, Sechtem U, Higgins CB. Measurement of canine left ventricular mass by using MR imaging. Am. J. Roentgenol. 1987;148:33–38. doi: 10.2214/ajr.148.1.33. - DOI - PubMed