. 2023 Dec 21;14(1):8517.
doi: 10.1038/s41467-023-44355-z.

Unraveling the causal genes and transcriptomic determinants of human telomere length

Affiliations

Unraveling the causal genes and transcriptomic determinants of human telomere length

Ying Chang et al. Nat Commun. .

Abstract

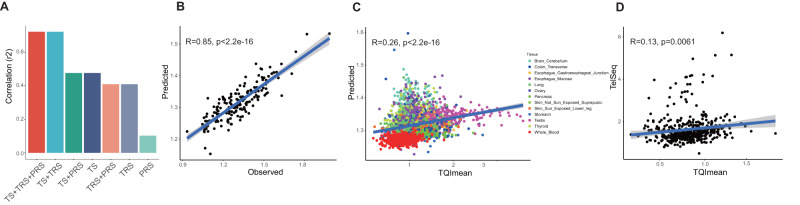
Telomere length (TL) shortening is a pivotal indicator of biological aging and is associated with many human diseases. The genetic determinates of human TL have been widely investigated, however, most existing studies were conducted based on adult tissues which are heavily influenced by lifetime exposure. Based on the analyses of terminal restriction fragment (TRF) length of telomere, individual genotypes, and gene expressions on 166 healthy placental tissues, we systematically interrogate TL-modulated genes and their potential functions. We discover that the TL in the placenta is comparatively longer than in other adult tissues, but exhibiting an intra-tissue homogeneity. Trans-ancestral TL genome-wide association studies (GWASs) on 644,553 individuals identify 20 newly discovered genetic associations and provide increased polygenic determination of human TL. Next, we integrate the powerful TL GWAS with placental expression quantitative trait locus (eQTL) mapping to prioritize 23 likely causal genes, among which 4 are functionally validated, including MMUT, RRM1, KIAA1429, and YWHAZ. Finally, modeling transcriptomic signatures and TRF-based TL improve the prediction performance of human TL. This study deepens our understanding of causal genes and transcriptomic determinants of human TL, promoting the mechanistic research on fine-grained TL regulation.


Conflict of interest statement

The authors declare no competing interests.

Figures

Fig. 1
Fig. 1. Placental material extraction and measurement.
A Schematic depicts the collection procedures of placental samples and the workflow of analysis in this study. TRF analysis, genotyping, and RNA-seq were conducted simultaneously for each sample. Created with BioRender.com [https://www.biorender.com/]. B TL of different sets from the same placental tissue was analyzed by TRF with regular electrophoresis gels (n = 4). C The statistical analysis presents the telomere length measurements of the same placental sample obtained from different positions and different batches of measurements (n = 4). D Scatter dot plots of individual data points and mean and standard deviation (SD) showing the distribution of RTL across placenta and 4 different adult tissues. Data are presented as mean values +/- SD (n = 166 for placenta, n = 231 for blood, n = 12 for skin, n = 6 for heart, n = 6 for lung). E Scatter plot shows the correlations between short telomere proportion and RTL (n = 166), with a simple linear regression line fitted. For boxplots, five-number summary of the data set (minimum, lower quartile, median, upper quartile and maximum) and outliers are shown. The two-sided P-value of Pearson’s correlation test was 1.48e-18.
Fig. 2
Fig. 2. Trans-ancestral TL GWAS and PRS analysis.
A Manhattan plot of various TL GWASs and GWAS meta-analysis. The x-axis represents the genome in physical order; the y-axis shows -log10 two-sided P-values for all variants using an inverse-variance weighted fixed effects model and a total sample size n = 644,553. B The quantile-quantile (Q-Q) plot compared the two-sided P-values generated from this fitted distribution against the observed P values. C LocusZoom plot for regional associations of a locus associating with TL in SWT1 gene, SNPs are colored according to their LD with the lead SNP, rs10798002. The left y-axis shows association -log10 two-sided P-values for all SNPs in this locus, the right y-axis shows the recombination rate and the x-axis shows the chromosomal position. The bottom of plot shows the near genes. D Dot plot of GO enrichment for the nearest genes of TL-associated variants. The diameter indicates the number of genes overlapping the gene ontology term and the color indicates the BH-adjusted enrichment P value. E Scatter plot for RTL vs. PRSs with a simple linear regression line fitted in this study (n = 166) and GTEx (n = 442). The grey shade area represents 95% confidence interval.
Fig. 3
Fig. 3. Gene expression patterns of placental TL maintenance.
A Scatter plots shows the associations between RTL and top2 genes involved in each of telomerase activity, telomere capping, and ALT pathways. The grey shade area represents 95% confidence interval. P represents the two-sided P-value of Pearson’s correlation test, p.adjust represents the BH-adjusted P values. B Scatter plots shows the associations between STP and top2 genes involved in telomerase activity, telomere capping, and ALT pathway. The grey shade area represents 95% confidence interval. The two-sided P-values of Pearson’s correlation test were 3.00e-4 for HMBOX1, 3.37e-4 for SP1, 6.47e-4 for TOP3A. C Dendrogram of module eigengenes based on dissimilarity measure (1-TOM) and the associations between each module and TL. D Heatmap of the connectives for high-variance genes based on about 25% of samples, while the left-most is based on samples with upper-quartile TLs, and the right-most is based on samples with lower-quartile TLs, lower score represents a low overlap and larger score represents a high overlap between the genes. E Dot plot of GO enrichment for genes clusters that predominately have higher connectives in samples with long TL (upper) or short TL (bottom). The diameter indicates the number of genes overlapping the gene ontology term and the color indicates the BH-adjusted enrichment P-value.
Fig. 4
Fig. 4. Causal associations between genetically determined gene expressions and TL.
A Manhattan plot of transcriptome-wide association results. The x-axis represents the genome in physical order; the y-axis shows Z score for all genes. Genes that passed multiple testing corrections (FDR < 0.1) are highlighted in red and labeled with gene name. BE LocusCompare plots for the (B) MMUT, (C) RRM1, (D) KIAA1429, and (E) YWHAZ loci, where the GWAS signals (x-axis) colocalized the eQTL signals (y-axis). LD is colored with respect to the GWAS lead SNPs. The lead SNPs are plotted as a purple upright triangle. The x-axis and y-axis show the -log P values for variants located at the respective loci. FI Scatter plot of the effect sizes of variants reported in TL GWAS and placental eQTLs from (F) MMUT, (G) RRM1, (H) KIAA1429, and (I) YWHAZ. Effect sizes of the variants in the TL GWAS (y-axis) and eQTL (x-axis) are plotted. Error bars indicate 95% confidence interval. The red triangle shows the top cis-eQTL, blue circles indicate cis-eQTLs. Error bars show the standard errors of the SNP effects.
Fig. 5
Fig. 5. Experimental validation of TL regulation by perturbing expression of MMUT, RRM1, KIAA1429, and YWHAZ.
A 34 days after HTR8/SVneo cells were infected with shRRM1 lentiviral particles, 8 shRRM1 monoclonal cell lines grown in 96-well plates were transferred to 6-well plates. TRF assay was used to measure the TL of these cell lines. B RRM1 RNA levels were estimated by qPCR and analyzed by GraphPad Prism software version 6.0. Data are represented as mean ± SD (n = 3). The two-sided P values of t test were (1.36e-7, 7.23e-8, 6.28e-7, 1.01e-5, 1.35e-7, 1.48e-7, 3.20e-7, 4.08e-7). ****P value < 0.0001. (C) HTR8/SVneo cells stably expressing control (shScramble) and shRRM1 were passaged over time (DAY) and examined for average TL by TRF (n = 4). D 34 days after HTR8/SVneo cells were infected with shMMUT lentiviral particles, six shMMUT monoclonal cell lines grown in 96-well plates were transferred to 6-well plates. TL of these six cell lines was measured by TRF assay. E MMUT RNA levels were estimated by qPCR and analyzed by GraphPad Prism software version 6.0. Data are represented as mean ± SD (n = 3). The two-sided P-values of t test were (1.23e-04, 2.34e-05, 2.05e-04, 2.19e-04, 7.63e-05, 1.78e-04). ***P value < 0.001; ****P value < 0.0001. F HTR8/SVneo cells stably expressing control (shScramble) and shRNA sequences against MMUT were passaged over time (DAY) and examined for average TL by TRF (n = 4). G 32 days after infection of shKIAA1429 lentiviral particles, six shKIAA1429 monoclonal cell lines from 96-well plates were grown in 6-well plates. The TL of these cell lines was measured by TRF assay. (H) KIAA1429 RNA levels were tested by qPCR and analyzed by GraphPad Prism software version 6.0. Data are represented as mean ± SD (n = 3). The two-sided P values of t test were (6.15e-05, 2.51e-05, 2.82e-05, 2.59e-05, 3.14e-05, 2.96e-05). ****P value < 0.0001. I 32 days after infection of shYWHAZ lentiviral particles, 5 shYWHAZ monoclonal cell lines grew from 96-well plates to 6-well plates. TL of these cell lines was measured by TRF assay. J YWHAZ RNA levels were estimated by qPCR and analyzed by GraphPad Prism software version 6.0. Data represent mean ± SD (n = 3). The two-sided P-values of t test were (7.80e-05, 7.80e-05, 7.30e-05, 7.70e-05, 1.01e-03). ****P-value < 0.0001.
Fig. 6
Fig. 6. Performance of placental TL prediction model.
A Bar chart for performance (r2) of elastic net models based on different feature combinations. B Scatter plot shows the actual TL values in placenta against the values predicted by the best model (TS + TRS + PRS). The grey shade area represents 95% confidence interval. Two-sided P-value was computed for Pearson’s correlation test. C Scatter plot shows the actual TL values in GTEx tissues against those predicted by the model, only GTEx tissues with >100 samples were used for validation. The grey shade area represents 95% confidence interval. Two-sided P value was computed for Pearson’s correlation test. Dots are colored according to their tissue types. D Scatter plot shows the correlations between TelSeq and TQImean for GTEx whole blood individuals with a simple linear regression line fitted. The grey shade area represents 95% confidence interval. Two-sided P value was computed for Pearson’s correlation test.

References

    1. McEachern MJ, Krauskopf A, Blackburn EH. Telomeres and their control. Annu Rev. Genet. 2000;34:331–358. doi: 10.1146/annurev.genet.34.1.331. - DOI - PubMed
    1. Blackburn EH, Epel ES, Lin J. Human telomere biology: A contributory and interactive factor in aging, disease risks, and protection. Science. 2015;350:1193–1198. doi: 10.1126/science.aab3389. - DOI - PubMed
    1. von Zglinicki T. Oxidative stress shortens telomeres. Trends Biochem Sci. 2002;27:339–344. doi: 10.1016/S0968-0004(02)02110-2. - DOI - PubMed
    1. Fasching CL. Telomere length measurement as a clinical biomarker of aging and disease. Crit. Rev. Clin. Lab Sci. 2018;55:443–465. doi: 10.1080/10408363.2018.1504274. - DOI - PubMed
    1. Vaiserman A, Krasnienkov D. Telomere Length as a Marker of Biological Age: State-of-the-Art, Open Issues, and Future Perspectives. Front Genet. 2020;11:630186. doi: 10.3389/fgene.2020.630186. - DOI - PMC - PubMed

Publication types